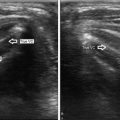
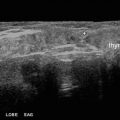
Fig. 13.1
Value of color Doppler with isoechoic nodules. (a) Longitudinal gray-scale view shows a solid isoechoic nodule that is very difficult to visualize and measure. (b) Longitudinal color Doppler view shows perinodular blood flow that defines the margin of the nodule

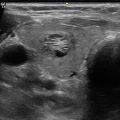
Fig. 13.2
Value of color Doppler with cystic nodules containing eccentric solid components. (a) Longitudinal gray-scale view shows a predominantly cystic nodule that has what appears to be a solid mural nodule (N). Because of this solid component, this patient had been scheduled for FNA. (b) Transverse color Doppler view shows lack of blood flow in the apparent solid mural nodule. This suggests the solid lesion may be a luminal blood clot and not a mural nodule. (c) Longitudinal view with the patient in the upright position shows that the avascular solid component has moved to the inferior portion of the cyst, confirming that it is mobile and not a mural nodule. In this case, FNA was canceled

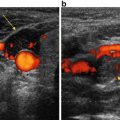
Fig. 13.3
Value of color Doppler with cystic nodules containing eccentric solid components. (a) Longitudinal gray-scale view shows a nodule (cursors) with a cystic component in the nondependent portion and a solid component (N) in the dependent portion. The differential diagnosis based on this image is a cyst with dependent debris or clot versus a cyst with a solid eccentric mural nodule. (b) Corresponding color Doppler view shows intense hypervascularity in the solid component, confirming it is a mural nodule. Cytology was interpreted as a follicular lesion of undetermined significance
The value of color Doppler in distinguishing benign and malignant nodules is much less certain. Many investigators have analyzed the degree and pattern of vascularity in thyroid nodules. Most have shown that intranodular vascularity is statistically more likely to be detected in malignant nodules (Fig. 13.4) than in benign nodules (Fig. 13.5). Unfortunately, they have also shown that malignant nodules have a range of vascular patterns as well as a range of degrees of vascularity (Fig. 13.6). In addition, benign nodules have been shown to have a broad range of vascular patterns and degrees, including hypervascular internal flow (Fig. 13.7). The amount of overlap in the vascularity of benign and malignant nodules substantially limits the value of vascularity in the differentiation of these nodules.


Fig. 13.4
Papillary thyroid cancer with hypervascular intranodular blood flow. (a) Longitudinal gray-scale view shows an intermediate suspicion, entirely solid, slightly hypoechoic smoothly marginated nodule (cursors) with refractive shadowing and no calcifications. (b) Corresponding color Doppler view shows marked intranodular blood flow
Fig. 13.5
Benign nodular hyperplasia with predominantly peripheral flow. (a) Longitudinal gray-scale view shows a low suspicion, almost entirely solid, isoechoic, smoothly marginated nodule (cursors) with no calcifications. (b) Corresponding color Doppler view shows abundant peripheral flow and almost no central flow
Fig. 13.6
Spectrum of vascularity in malignant thyroid nodules. (a) Papillary thyroid cancer (cursors) with no detectable blood flow. (b) Papillary thyroid cancer (cursors) with minimal internal blood flow. (c) Medullary thyroid cancer (cursors) with hypervascular internal blood flow
Fig. 13.7
Benign nodular hyperplasia with hypervascular internal blood flow. (a) Transverse gray-scale view shows an intermediate suspicion, lobulated, predominantly solid, slightly hypoechoic smoothly marginated nodule (cursors) with no calcifications. (b) Corresponding color Doppler view shows hypervascular internal blood flow
Table 13.1 summarizes the results of a number of studies that had histologic proof and specifically determined the statistics of nodule vascularity independent of gray-scale findings [1–12]. Most have divided flow patterns into peripheral and intranodular. The definition of flow that increases the risk of malignancy varies but included (1) any detectable peripheral or intranodular flow , (2) any detectable intranodular flow , (3) isolated or predominant intranodular flow , and (4) marked intranodular flow . Using these different criteria, the sensitivity, specificity, positive predictive value, and negative predictive values ranged from 15 to 75 %, 34 to 96 %, 6 to 61 %, and 28 to 97 %, respectively. In addition to the statistics mentioned above, one can use an odds ratio to compare the risk of malignancy of a positive result (for instance, intranodular flow ) to the risk of malignancy of a negative result (for instance, no intranodular flow ). A ratio of 5 would indicate that a nodule with intranodular flow was five times more likely to be malignant than a nodule without intranodular flow . As Table 13.1 shows, the odds ratios ranged from 0.2 to 9.4. In most cases the odds ratio was less than 2. In a study that included 31 malignant nodules, Papini et al. had the highest odds ratio of 9.4 using any intranodular flow as the criterion [2]. In this study, intranodular flow had a 24.5 % risk of malignancy and no intranodular flow had a 2.6 % risk of malignancy.
Table 13.1
Relationship to the pattern of nodular blood flow and risk of malignancy
Study | Criteria used | # of nodules | % malignancy | Sens (%) | Spec (%) | PPV (%) | NPV (%) | Odds ratio | Conclusion |
|---|---|---|---|---|---|---|---|---|---|
Sharma 2011 [8] | Detectable flow anywhere | 67 | 23 (16/67) | 75 | 60.80 | 37.50 | 88.60 | 3.3 | Not helpful |
Rosario 2015 [12] | Intranodular flow | 1502 | 10.6 (160/1502) | 70 | 36 | 11.50 | 91.00 | 1.28 | Not helpful |
Isolated or predominant intranodular flow | 1502 | 10.6 (160/1502) | 15 | 96 | 31.60 | 90.50 | 3.3 | Not helpful | |
Cappelli 2006 [4] | Intranodular flow | 6135 | 4.6 (284/6135) | 62 | 50 | 5.60 | 96 | 1.4 | ? Not included in final recommendations |
Popowicz 2009 [6] | Intranodular flow | 316 | 8.5 (27/316) | 51.90 | 56.70 | 8.90 | 92.70 | 1.2 | Not helpful |
Rago 1998 [1] | Marked intranodular flow | 104 | 28.8 (30/104) | 49 | 67 | 34 | 78 | 1.5 | Not helpful |
Brito 2014 [11] | Increased central flow | 7578 | 48 | 53 | Not helpful | ||||
Papini 2002 [2]a | Intranodular flow | 402 | 7.7 (31/402) | 74 (23/31) | 80.8 (300/371) | 24.50 | 97.40 | 9.4 | Helpful—included in recommendations |
Frates 2003 [3] | Extensive intranodular flow | 209 | 15.3 (32/209) | 43.80 | 85.30 | 35.00 | 85.30 | 2.4 | Limited usefulness |
Small to moderate or greater intranodular flow | 209 | 15.3 (32/209) | 62.50 | 57.10 | 20.80 | 79.50 | 1 | Limited usefulness | |
Lyshchik 2007 [5] | Intranodular flow (all nodules) | 86 | 53.5 (46/86) | 65.20 | 52.50 | 61.20 | 56.80 | 1.4 | Qualitative analysis of vascularity was not helpful |
Intranodular flow (nodules <2 cm) | 43 | 67.4 (29/43) | 65.50 | 85.70 | 90.50 | 54.50 | 2 | Qualitative analysis of vascularity was not helpful | |
Intranodular flow (nodules >2 cm) | 43 | 39.5 (17/43) | 64.70 | 34.60 | 49.30 | 60.00 | 1.23 | Qualitative analysis of vascularity was not helpful | |
Lee 2011 [9] | Predominant intranodular | 191 | 37.7 (72/191) | 11.1 | 94.1 | 53.3 | 63.6 | 1.5 | Not useful |
Ozel 2012 [10] | Any intranodular | 363 | 6.10 | 63.6 | 34 | 10.1 | 96.4 | 2.8 | Useful |
(22/363) | |||||||||
Moon 2010 [7] | Any flow | 1083 | 24.8 (269/1083) | 40.1 | 43 | 18.9 | 68.5 | 0.6 | Negative correlation between vascularity and malignancy |
Intranodular flow | 1083 | 24.8 (269/1083) | 16.7 | 69.3 | 15.3 | 28.4 | 0.21 | Negative correlation between vascularity and malignancy |
In a recent study of 1342 benign and 160 malignant nodules (malignant rate of 10.6 %), suspicious flow was defined in two different ways [12]. Intranodular flow of any degree regardless of the presence or degree of peripheral flow had an odds ratio of 1.28 and a positive predictive value of 11.5 %. Intranodular flow without peripheral flow or exceeding peripheral flow had an odds ratio of 3.3 and a positive predictive value of 31.6 %. The authors concluded that Doppler evaluation of blood flow was not helpful.
In another large study of 5851 benign and 284 malignant nodules (malignant rate of 4.6 %), intranodular flow of any degree was considered suspicious for malignancy [4]. Using this criterion, the odds ratio was 1.4 and the positive predictive value was 5.6 %. Doppler findings were not included in the final recommendations of this study.
In a study of 814 benign and 269 malignant nodules (malignant rate of 24.8 %), suspicious flow was defined in two different ways [7]. In both cases there was actually a negative correlation with malignancy.
A meta-analysis of studies including 7578 nodules used increased intranodular flow as the criterion for malignancy and found a sensitivity of 48 % and a specificity of 53 % [11]. The authors did not conclude that analysis of vascularity was helpful.
In a slightly different analysis, Phuttharak compared the results of gray-scale findings alone versus the combination of gray-scale and Doppler findings [13]. Central hypervascularity that exceeded flow in the remainder of the nodule was considered suspicious for malignancy. The sensitivity, specificity, positive predictive value, and negative predictive value were 80 % (4/5), 84.6 % (22/26), 50 % (4/8), and 95.7 % (22/23), respectively, for gray-scale findings alone and 40 % (2/5), 96.2 % (25/26), 66.7 % (2/3), and 89.3 % (25/28) for combined gray-scale and Doppler findings. The authors concluded that Doppler findings were useful since they improved the specificity and the positive predictive values, albeit with a loss of sensitivity. A significant limitation of this study was the low number of nodules that were analyzed (only 31 total nodules and only five malignant nodules).
There is some data that suggests Doppler flow patterns may add clinically useful information for nodules that have been aspirated and have cytology indicative of follicular lesions of undetermined significance or atypia of undetermined significance [14–17]. Approximately 15–20 % of these indeterminate lesions ultimately are shown to be malignant. Currently there are no gray-scale sonographic features that assist in separating the benign and malignant nodules in this category. However, intranodular vascularity has been shown in several studies to be more closely associated with malignancy (Fig. 13.8). Sensitivity, specificity, positive predictive value, and negative predictive value range from 80 to 86 %, 39 to 90 %, 23 to 51 %, and 90 to 97 %, respectively. The odds ratio for a positive result ranges from 2.8 to 17.7. Table 13.2 shows the results of several studies that had histologic proof and specifically determined the statistics of nodule vascularity independent of gray-scale findings. DeNicola also evaluated measurement of RI values from the nodules and using a cutoff value of less than 0.75 as a sign of malignancy obtained a sensitivity of 40 %, specificity of 97 %, positive predictive value of 67 %, negative predictive value of 92 %, and an odds ratio for a positive result of 8.4 [15]. These results suggest a complimentary role for color Doppler in the management of follicular lesions. However, it is important to realize that in individual patients the presence of central flow (Fig. 13.9) does not ensure that a lesion is malignant and predominantly peripheral flow does not exclude a malignancy .

 Ultrasound-Guided Laser Ablation
 Transcutaneous Laryngeal Ultrasonography: Clinical Variables
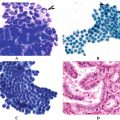 Cytomorphology of Fine Needle Aspiration of Thyroid
 The Ultrasound Lexicon: Common Terminology for Thyroid and Parathyroid Sonography
 Ultrasound Characteristics and Ultrasound-Guided Fine-Needle Aspiration of Lymph Nodes in the Cervical Soft Tissues: A Radiology Perspective
 Pattern Recognition: Diffuse Thyroid Disease


Related posts:
Ultrasound-Guided Laser Ablation
Transcutaneous Laryngeal Ultrasonography: Clinical Variables
Cytomorphology of Fine Needle Aspiration of Thyroid
The Ultrasound Lexicon: Common Terminology for Thyroid and Parathyroid Sonography
Ultrasound Characteristics and Ultrasound-Guided Fine-Needle Aspiration of Lymph Nodes in the Cervical Soft Tissues: A Radiology Perspective
Pattern Recognition: Diffuse Thyroid Disease
Stay updated, free articles. Join our Telegram channel
Full access? Get Clinical Tree
