Field of View
Introduction
A pulse sequence diagram (PSD) provides a timing algorithm for the sequence of events that is carried out during an MR study. However, the operator must specify the dimensions of the desired part of the body under study. This is the subject of this chapter, namely, the field of view (FOV). As we shall see shortly, there is a limitation as to how small we can make the FOV, depending on the maximum strength of the gradients and the bandwidth of the received signals.
Field of View (FOV)
We’re going to discuss the relationship between the following entities:
Bandwidth
Gradients
Understanding these concepts is important because these features have definite clinical applications.
Let’s take an image with its x and y axes (Fig. 15-1). There is an FOV along the x-axis. Normally, we apply a gradient that increases as we move in the x direction (Gx). This means that we create magnetic inhomogeneities along the x-axis in a linear fashion. Consequently,
At the center point of the FOV, the magnetic field will be B0.
On the right side of the FOV, the magnetic field will be greater than B0.
On the left side of the FOV, the magnetic field will be less than B0.
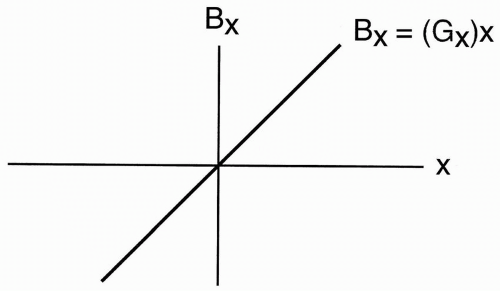
The magnetic field along the x-axis is Bx. The value of Bx is given by the linear equation: Bx = (Gx)x This equation shows that the value of the magnetic field at any point along the gradient (Gx) is the slope of the gradient (Gx) times the distance x along the x-axis (Fig. 15-2). Let’s multiply both sides of the equation by the gyromagnetic ratio γ: γ · Bx = γ(Gx)x
Recall that (γBx) is the Larmor equation, which relates the magnetic field strength to the frequency: frequencyx = γBx This equation states that the frequency of oscillation at any point along the x-axis is proportional to the magnetic field strength at that point, that is, fx = γBx or fx = γ(Gx)x In other words, the frequency at any point along the x-axis is proportional to the slope of the gradient (Gx) multiplied by the position along the x-axis.
Recall that (γBx) is the Larmor equation, which relates the magnetic field strength to the frequency: frequencyx = γBx This equation states that the frequency of oscillation at any point along the x-axis is proportional to the magnetic field strength at that point, that is, fx = γBx or fx = γ(Gx)x In other words, the frequency at any point along the x-axis is proportional to the slope of the gradient (Gx) multiplied by the position along the x-axis.
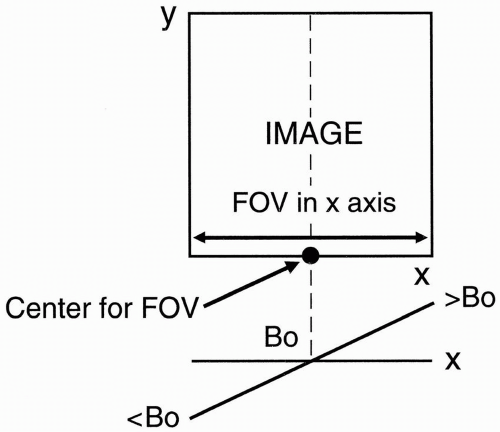 Figure 15-1. An image with axes x and y. The frequencyencode gradient Gx causes the center of the field of view (FOV) to have magnetic field strength B0 and the right and left ends to have strengths greater and less than B0, respectively. |
Let’s see what happens at each end of the FOV (Fig. 15-3). At the right-side end of the FOV (i.e., at x = FOV/2), the frequency is maximum (call it fmax) because the Gx gradient, and therefore the magnetic field strength, is maximum.
The formula for frequency is fx = γ(Gx)x Now, for fmax, the distance along the x-axis is ½ FOV. So, fmax = γ(Gx)FOV/2 Remember this is after we subtract the center frequency. Therefore, these measurements are centered around the zero frequency. At the opposite end of the gradient, we have −fmax: −fmax = −γ(Gx)FOV/2 What is the range of frequencies? The frequency range is from −fmax to +fmax, that is, Frequency range = −fmax → +fmax = ±fmax = 2fmax Another term for the range of frequencies is bandwidth (BW). Thus, BW = ±fmax = 2fmax


Stay updated, free articles. Join our Telegram channel

Full access? Get Clinical Tree


