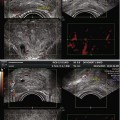
Fig. 14.1
(a) 3D. Right solid tumor (arrows) has irregular borders and internal tortuous vascularity compared to left BPH nodule. (b) MRI. Homogeneous signal loss in right tumor (open arrows). Inhomogeneous left and right midgland well-circumscribed nodules (closed arrows). (c) DCE-MRI. Homogeneous enhancement of tumor. BPH nodules (arrows)
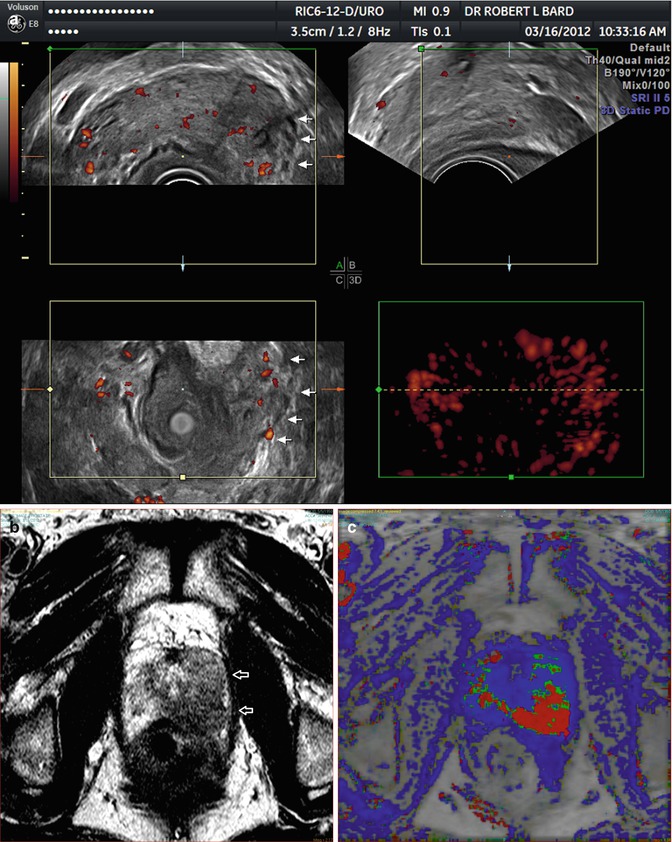
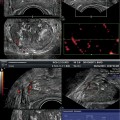
Fig. 14.2
(a) 3D. Tumor with left capsular erosion (arrows). (b) MRI. Tumor (arrows) with mixed signal and intact capsule. (c) DCE-MRI. Homogeneous enhancement of tumor
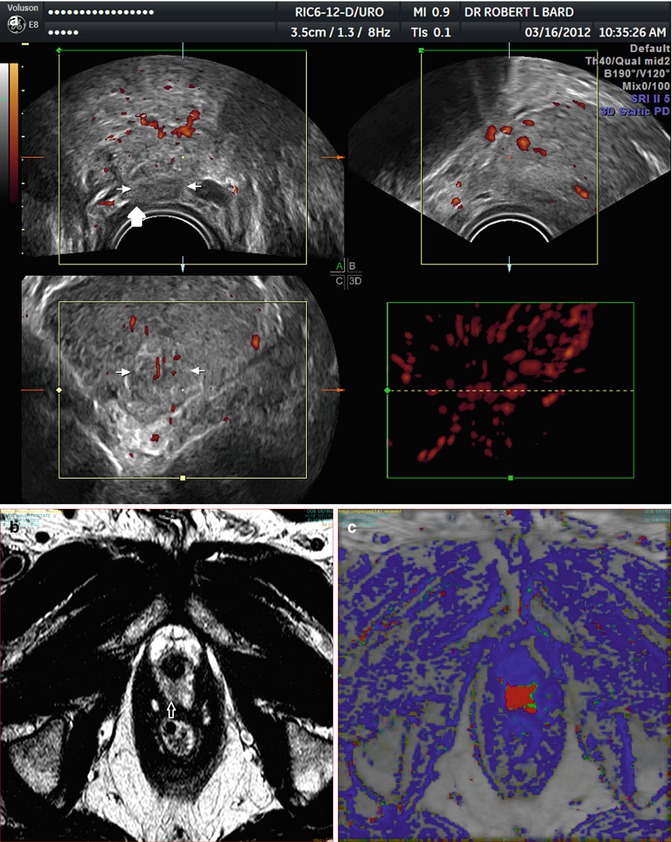
Fig. 14.3
(a) 3D. Apical tumor (arrows) with posterior erosion. (b) MRI. Apical tumor (arrows) without erosion. (c) DCE-MRI. Homogeneous enhancement
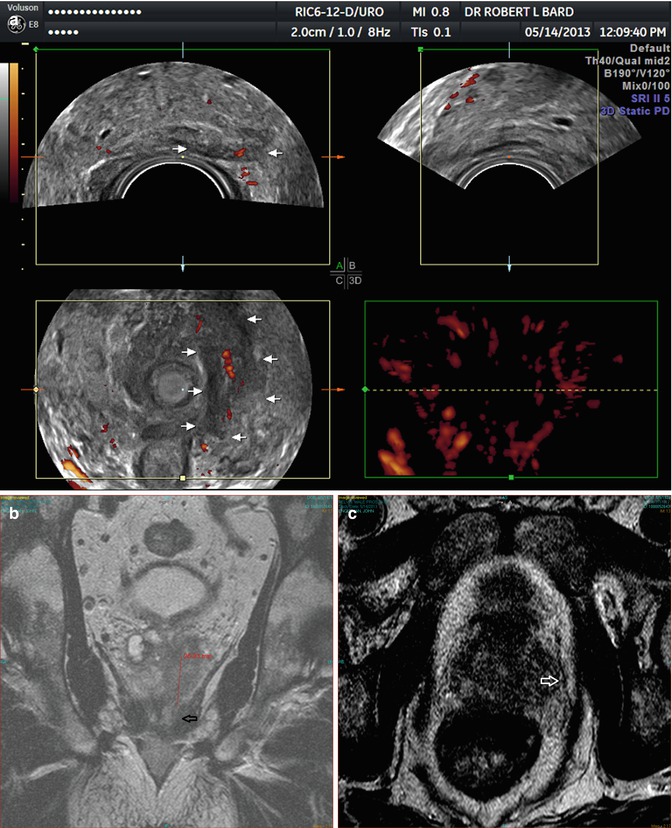
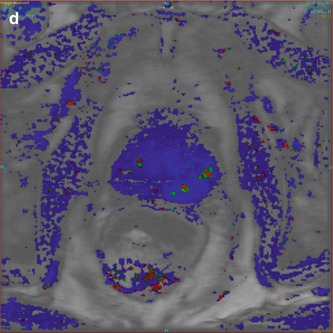
Fig. 14.4
(a) 3D. Midgland tumor with erosion (arrows) best on coronal plane. (b) MRI. Coronal plane. Capsular erosion (arrows). (c) MRI. Left capsular erosion (arrows). (d) DCE-MRI. Tumor eroding capsule has minimal perfusion
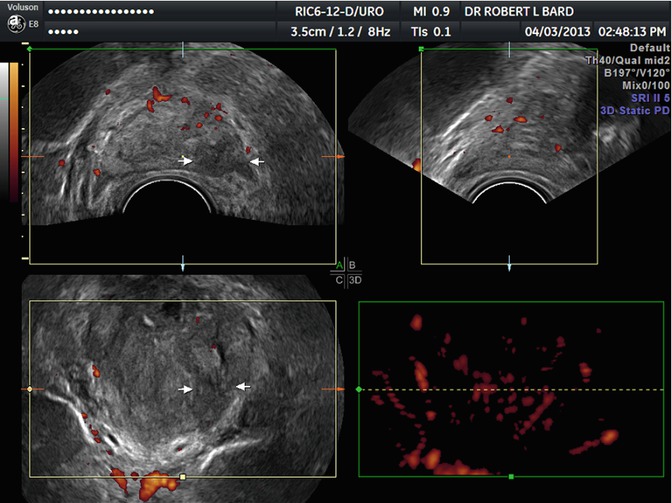
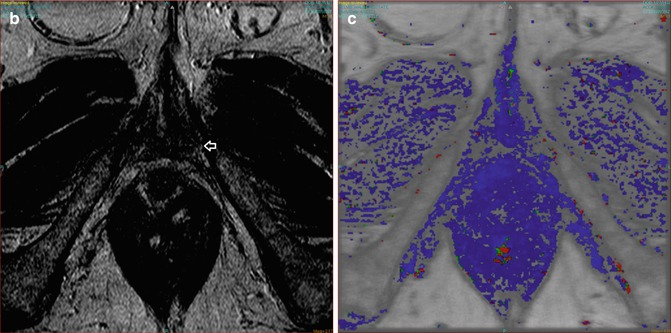
Fig. 14.5
(a) 3D. Avascular apical tumor (arrows) eroding capsule. (b) MRI. Capsular erosion (arrows) questionable. (c) DCE. Tumor missed on perfusion study
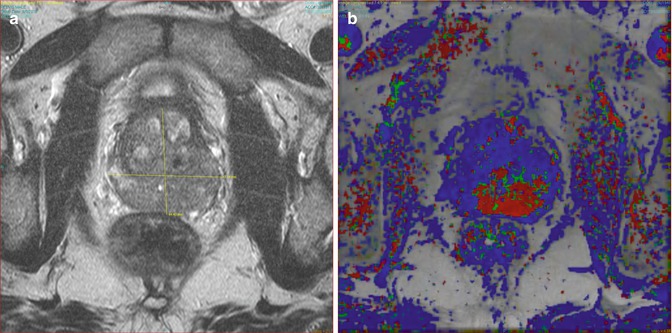
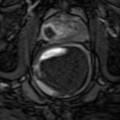
Fig. 14.6
(a) MRI. Tumor involving both halves of gland. (b) DCE-MRI. Gleason 9 tumor perfusion matches T2 study
Related posts:

Stay updated, free articles. Join our Telegram channel

Full access? Get Clinical Tree


