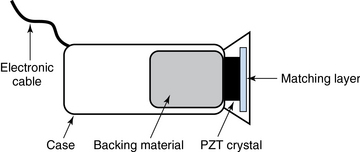
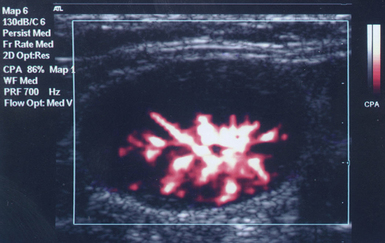
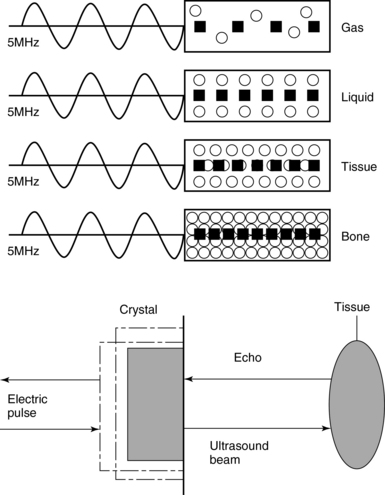
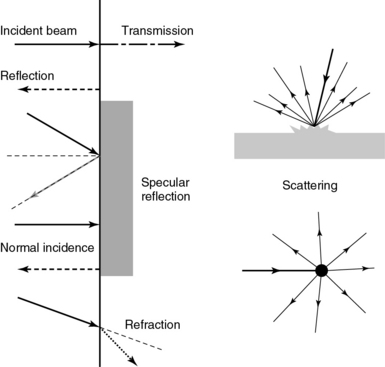
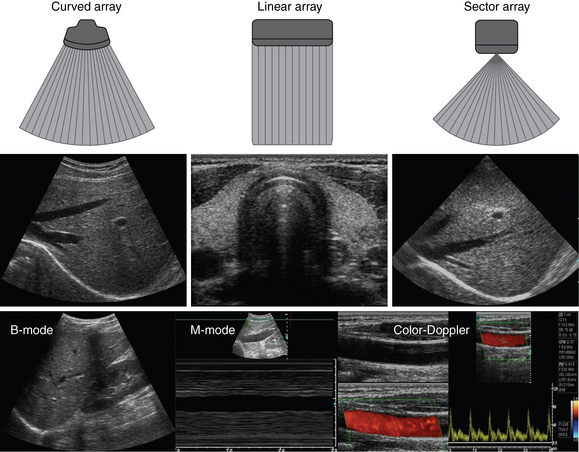
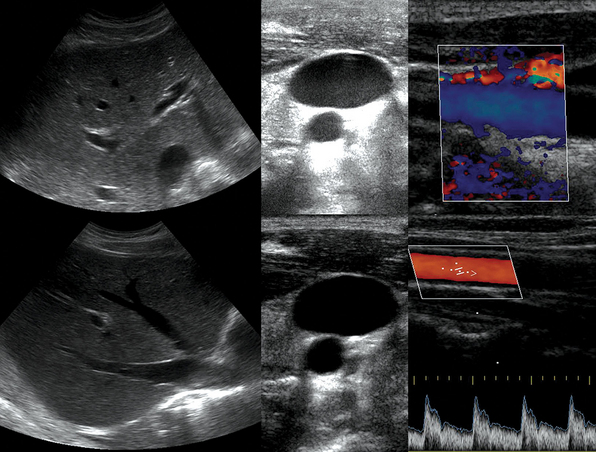
1 “There is geometry in the humming of the strings . . . there is music in the spacing of the spheres” Ultrasound is a mechanical wave that requires a medium to travel (i.e., human tissue), with a frequency above the audible range ceiling of 20 kHz. Ultrasound systems are tomographic devices that transmit short pulses of ultrasound into the body and measure the round-trip time and intensity of each of the numerous echoes returning after the pulse. The time of arrival of an echo determines the distance from the transducer, that is, the location of its source in the body. The intensity of the echo is converted to brightness of a given point in the image. In other words, each pixel (element of the image) on the display device corresponds to a point inside the body, and its brightness depends on the strength of the echo that came from that location. Together, all pixels form a grayscale tomographic image. Parts of the image with mostly bright pixels (a brighter overall appearance) are termed hyperechoic, as opposed to hypoechoic (darker) areas. The relative ability of an organ or tissue to produce echoes is called echogenicity, that is, tissues or structures producing hyperechoic image are considered more echogenic.1–7 Parts of the image with only black pixels are called anechoic or echo-free and mostly correspond to homogenous liquids (e.g., blood, urine, effusion, cystic fluid). Frequency (measured in cycles per second [hertz, Hz]) is the number of wave cycles in 1 second. Frequency is determined solely by the sound source and not by the medium. Frequencies used by general-purpose ultrasound machines range between 2 and 15 megahertz (MHz). Higher frequencies, up to 40 MHz, are used for intravascular and other catheter-based applications and in specialized ophthalmologic and dermatologic techniques. Propagation speed is the velocity of sound in a given medium and is determined solely by the characteristics of the medium, such as density and stiffness (does not depend on the source of sound or its frequency). Ultrasound travels through soft tissues at a speed of approximately 1.54 mm/μsec, or 1540 m/sec). The stiffer the tissue, the greater the propagation speed (Figure 1-1). Ultrasound waves are generated by piezoelectric crystals (e.g., lead zirconate titanate, or PZT) that convert electrical energy into mechanical energy and vice versa (see Figure 1-1). Electrical pulses or short bursts of alternating voltage stimulate crystals to produce ultrasound pulses in the medium, causing displacement and oscillation of its molecules. Pressure change–Velocity of such oscillations in response to sound pressure determines the acoustic impedance (lower velocities correspond to higher impedance). As ultrasound passes from one medium to another (e.g., from gas to liquid), an impedance gradient at the tissue boundary causes a part of the energy to form a reflected wave (echo) while the remainder of the energy proceeds into the second medium.1–7 Reflection occurs every time the ultrasound pulse encounters a new boundary (reflector). Specular (mirror-like) reflectors are smooth and flat boundaries larger than the pulse dimensions (e.g., diaphragm, walls of a major vessels). The echo reflection angle equals the angle of incidence; when the beam strikes a specular reflector at 90 degrees (normal incidence, Figure 1-2), a very strong echo travels back toward the source. Nonspecular reflection, or scattering, occurs when the incident beam strikes boundaries that have irregular surface or are smaller than the beam’s dimensions, resulting in the beam’s energy scattering in multiple different directions (see Figure 1-2). The beam travels around even smaller obstacles without scattering (diffraction). Because a higher frequency results in smaller beam dimensions, obstacles diffracting at lower frequencies act as scatterers at higher frequencies. This explains both higher imaging resolution and higher beam attenuation at higher frequencies. Refraction is the redirection of a beam when striking obliquely at a boundary between two media with different propagation speeds. Unlike reflection, refraction does not contribute to the image formation process but contributes to attenuation (see Figure 1-2). Part of the ultrasound beam’s energy is transferred to the medium in the form of heat. This is absorption, which also increases proportionally to frequency in soft tissues. The bones absorb ultrasound more intensely, together with other energy loss mechanisms, producing acoustic shadows behind them. Finally, part of the original beam is converted by tissues to waves with double or higher-order frequency (harmonic waves). The total propagation losses from the combined effects of scattering, refraction, and absorption are called attenuation, which is directly proportional to frequency. Body compartments with low attenuation that allow imaging deeper structures through them are good acoustic windows (e.g., liquid cavities), while those with high attenuation are acoustic barriers (e.g., bones). The near-total loss of ultrasound at boundaries between tissues and gas makes gas the strongest barrier; nevertheless, important lung ultrasound techniques rely on the abundant artifacts that the aerated lung creates. Figure 1-1 Propagation speed is different in different tissues (top); electrical impulses stimulate the lead zirconate titanate (PZT) crystal to produce a beam (bottom), while every time an echo is reflected back, the crystal deforms and vibrates, generating another impulse that is processed into an image. Figure 1-2 Left panel, Reflection (top), specular reflection (middle), and refraction (bottom) of the incident beam. Right panel, Scattering occurs when the incident beam strikes boundaries that are irregular in shape (top) or smaller than the beam’s dimensions (bottom), resulting in the beam’s energy scattering in multiple different directions. Ultrasound machines consist of electric pulse generators, transducers, systems for processing received echoes, and image display screens. Modern systems use digital technology and have central processing units running advanced software that forms beams and processes echoes and thereafter stores images. The key elements of transducers (probes) are PZT crystals, matching layers, backing material, cases, and electrical cables (Figure 1 E-1). Modern electronic transducers generate a range of frequencies (bandwidth) around the central frequency, and contain multiple crystal elements (arrays). This permits them to display the sequence of two-dimensional (2D) images so rapidly that motion is displayed as it actually occurs (real-time scanning). Main transducer types are phased array (sector), linear array, and curved array (Figure 1-3). Sector (phased array) transducers (2 to 4 MHz) have small footprints that produce images of sector format through small acoustic windows (e.g., cardiac and cranial applications). Linear array transducers (7 to 15 MHz) provide images in rectangular or trapezoidal format. They feature high resolution and shallow depth of view because their penetration into deeper structures is limited. Convex (curved array, curvilinear) transducers (2 to 6 MHz) of different shapes and sizes produce images in a sector-shaped format with a wide apex. Microconvex transducers (3 to 8 MHz) feature small footprints and are useful in difficult-access areas, such as the neonatal brain. Transducers generating frequencies of 2.5 to 5 MHz feature a larger curvature radius and are used for abdominal imaging. A variety of convex arrays operating at higher frequencies are used in intracavitary and transesophageal scanning. Finally, transducers with frequencies up to 50 MHz are used for endovascular applications and ultrasound biomicroscopy.1–7 Figure 1-3 Main types of transducers and formats of their produced images (top and middle); basic imaging modes (bottom). Notwithstanding the similarities of all general-purpose ultrasound systems, it is critical for every user to be especially familiar with a specific machine’s features, transducer choices, and controls in advance and to practice with it sufficiently in nonemergency settings. Attempting to navigate screens or modes while resuscitating a critically ill patient can be a frustrating process. A demonstration of a common ultrasound machine and its essential controls is provided in Video 1-1. The ability to switch transducers between imaging applications or their components helps optimize image acquisition; even seemingly simple examinations, such as the extended Focused Assessment by Sonography for Trauma (e-FAST) evaluation, may require a transducer change, as well as the use of depth and gain adjustment and image optimization techniques. An e-FAST examination using several transducers is demonstrated in Video 1-2, whereas Video 1-3 shows the use of various imaging modes and may be helpful for novice ultrasound users. Some imaging modes may appear to be the prerogative of advanced users; however, novices quickly learn taking advantage of the additional information they offer. Of note, correct choice of transducers and machine settings will help ensure proper identification of pathology or estimation of physiologic parameters, whereas poor preparation may render the study ambiguous or completely nondiagnostic. A-mode (amplitude) is a nonimaging mode no longer used in general-purpose machines. B-mode (brightness) is the main imaging mode of any ultrasound machine. Each grayscale tomographic image in B-mode is composed of pixels with brightness, that depends on the intensity of the echo received from the corresponding location in the body. M-mode (motion) displays the movement of structures along a single line (axis of the ultrasound beam) chosen by the operator (Figure 1-4). M-mode is used in the intensive care unit (ICU) for evaluating heart wall or valve motion (echocardiography), hemodynamic status (vena cava analysis), and documentation of lung sliding or movement of the diaphragm. Doppler modes detect frequency shifts created by sound reflections off a moving target (Doppler effect). A moving reflector or scatterer changes the frequency of the beam (Doppler shift), as in (Fs − Ft) = 2VFt cos Φ/c, where V = the velocity of moving blood cells, c = the propagation speed, Ft = the frequency emitted by the transducer, Fs = backscattered frequency returning to the transducer, and Φ = the angle between beam and blood flow direction). If the beam lines up in parallel with blood flow (Φ = 0 degrees), cos 0 degrees = 1 (maximum Doppler shift). If the beam is perpendicular to the blood flow (Φ = 90 degrees), velocity measurements cannot be performed because cos 90 degrees = 0 (no Doppler shift). Angles in the 45- to 60-degree range are generally preferred.7 Figure 1-4 Old and new ultrasound techniques are useful in the intensive care unit. Left, M-mode showing diaphragmatic motion during T-piece trials (spontaneous breathing): normal movement (top), deep inspiration (middle), and flat-line in hemidiaphragmatic paralysis (bottom). Right, Contrast agents “light up” the left ventricle, and an apical thrombus is revealed. The Doppler effect is used in several modes. Color Doppler maps all Doppler shifts in the region of interest (ROI) by using a color scale over the grayscale anatomic image. The colors (usually shades of red and blue) denote flow toward and away from the transducer, regardless of the vessel’s nature (artery or vein). The power Doppler mode, also known as Doppler angiography, displays all flow within the ROI in one color (usually orange) without regard to direction and is more sensitive (Figure 1 E-2). Spectral Doppler (see Video 1-3) refers to two different techniques: pulsed wave (PW) Doppler and continuous wave (CW) Doppler. CW Doppler involves continuous (not pulsed) generation of ultrasound by one crystal and reception of echoes by another, detects all shifts along the line chosen by the operator, and detects high velocities accurately. In PW Doppler, transmission is pulsed, and reception is performed by the same crystal. The operator places a special cursor (sample volume or gate) at the point of interest (e.g., center of a vessel). Its main advantage is the ability to display a full spectrum of frequency shifts from a specific anatomic point only. However, PW Doppler is unable to measure velocities greater than 1.5 to 2 m/sec because of aliasing. The term duplex ultrasound refers to the combination of anatomic information of B-mode with either color or spectral Doppler information on the same display. Triplex ultrasound demonstrates a grayscale image, the color Doppler overlay, and the spectral Doppler graph on the same display. Color M-mode displays in color the pulsed Doppler information along a single line of interrogation versus time. The Doppler velocity shift is color-encoded and superimposed on the M-mode image, providing high temporal resolution data on the direction and timing of flow events and is used mainly in cardiovascular imaging. Tissue Doppler imaging (TDI) is a modality in which the small Doppler shifts from tissue movements (most <20 mm/sec) are detected, while higher shifts from blood flow are suppressed. It is increasingly used in echocardiography for the assessment of various aspects of myocardial performance, especially in the diastolic function and greatly contributes to the differential diagnosis and management of myocardial pathology (Figure 1 E-3).7 Figure 1 E-3 Pulsed wave, tissue Doppler imaging–derived myocardial velocities (peak myocardial velocities during systole = Sa, early = Ea, and late = Aa diastole, respectively) obtained adjacent to the tricuspid annulus (echocardiography). Reduced velocities have been documented in several disorders, such as postinferior myocardial infarction, chronic pulmonary hypertension, and chronic heart failure. Harmonic frequencies are higher-integer multiples of the fundamental transmitted frequency that are produced as beams travels through tissues. With tissue harmonic imaging (THI), a software filter suppresses the fundamental frequency in the echoes and allows only harmonic signals to be received and processed into images. This may improve resolution and attain higher signal-to-noise ratios, minimizing the degradation effect of body wall fat. In some circumstances, however, THI image quality may actually be poor because of excessive filtering, with a resulting decrease in penetration and resolution. Anisotropic imaging is a recent evolution in ultrasound used for identifying abnormalities within normally anisotropic tissues. Anisotropy is a directional dependency of backscattered waves, which is present to varying extents in myocardium, renal cortex, tendons, and cartilage.7 Three-dimensional (3D) ultrasound acquires the anatomical information in a volume (3D) format. This technology undergoes continuous refinement as vendors seek to improve the performance and utility of 3D systems. By moving the 2D transducer in a controlled manner (linear-shift, swinging, or rotation), spatially tagged 2D data matrices are stored, to be reconstructed mathematically. 3D imaging can work with both B- and color Doppler modes, and its field of applications is constantly expanding (cardiology, obstetrics, neonatology, etc.). 3D images can be displayed in a variety of formats, including multiplanar reconstruction, surface rendering, volume rendering, and virtual endoscopy.7 This technology undergoes continuous refinement as vendors seek to improve the utility and performance of 3D systems. Contrast-enhanced imaging has been a major development in ultrasound technology in recent years. Most contrast agents are microbubbles of gas encapsulated in a polymer shell. They are much more reflective than normal tissues and thus significantly improve B-mode and color Doppler image quality (see Figure 1-4). It is a generally safe method for cardiac imaging, vascular evaluation, and parenchymal enhancement. Microbubbles in some agents “burst” when subjected to ultrasound energy, enhancing the image even further. Potential ICU applications include detection of right-to-left shunts, thrombosis, and solid organ injury, as well as assessment of renal perfusion and demonstration of ischemia.8 When the goal is to attain unimpeded, high-resolution views of hard-to-reach tissues and structures, specialized high-frequency transducers are available. Endocavitary (vaginal, rectal) and transesophageal transducers are usually of microconvex configuration. Endoluminal imaging techniques (e.g., intravascular, endobronchial, and endourologic ultrasound) are catheter-based techniques using rotational scanning that produce 360-degree B-mode views of the vascular (ureteral, etc.) wall and adjacent tissue. Some of these invasive techniques are applied in the ICU to evaluate intraluminal disorders and guide procedures.7 Resolution is a general term denoting the ability of the imaging method to discriminate the structural detail. The better (higher) the resolution, the greater the clarity and detail of the image. Spatial resolution (axial and lateral) refers to the ability of the B-mode to identify and display echoes from closely spaced echo-producing structures as distinct and separate objects. Axial resolution is the ability to discriminate individual echoes along the direction of the ultrasound beam (beam axis) and is approximately 0.5 to 1 mm at the operating frequency of 3.5 MHz. Higher frequencies produce better axial resolution at the expense of penetration. Lateral resolution is the ability to discriminate echoes located side by side at the same depth, and is approximately 1 to 2 mm at 3.5 MHz. Besides choosing the highest possible frequency that still penetrates to the depth of ROI, spatial resolution is improved by “focal zone” placement at the depth of the ROI (focus control) and by avoiding excessive gain settings. Contrast resolution, also known as grayscale resolution, is the ability to discriminate returning echoes of different amplitudes and assign different grayscale values to the respective pixels. Most ultrasound systems permit assignment of 256 shades of gray, which resolves the subtle differences among various structures. Increasing the contrast (less shades of gray) results in an image that is more pleasing to the human eye but likely contains less diagnostic information.1–5 Temporal resolution corresponds to the image frame rate (refresh rate), which ranges from 15 to 100 frames per second in different imaging modes and decreases when the depth or the number of focal zones is increased. Modern portable ultrasound systems are significantly automated and similar in their user-adjustable functionality; however, controls (knobs) of the machine are still important to know. Depth (a knob or toggle switch) controls the depth of view and should be used to keep ROI in the central area of the screen (Figure 1-5). Depth is displayed along the edge of the image on a centimeter scale. Depth function alters the manner of acquisition of imaging data (preprocessing). An image at a shallower depth takes less time to form because only earlier-arriving echoes are processed, hence higher frame rates (better temporal resolution). The focus control allows moving the focal zone(s) to the ROI depth to ensure a narrower beam and therefore a better lateral resolution. The focal zone may be indicated as an arrowhead at the side of the image (usually on the depth scale). Most machines allow setting multiple focal zones; multifocusing degrades temporal resolution but improves spatial (both axial and lateral) resolution. Zoom control magnifies the selected image section without adding new information or changing the data acquisition (postprocessing). Some systems have an additional “high-definition zoom” option, whereas the machine’s beam-forming and data-processing capabilities are mobilized from other areas to optimize the image of the ROI. Figure 1-5 “Knobology”: Left, Too-shallow image depth (top) and correct depth adjustment (bottom) to depict the region of interest (ROI, liver). Middle, Image with inappropriate (high) gain (top) and correctly gained (bottom). Right, Increased color gain and large color box that is inappropriately angled (top) resulting in aliasing (common carotid artery) and properly sized and angled color-box with adjusted color gain to perform color Doppler measurements (bottom). Gain adjusts overall image brightness by amplifying electronic echo signals; thus it works only on the receiving side and has no impact on transmitted power or bioeffects. Gain must be adjusted to such a level that anechoic structures (e.g., fluids) appear black on screen. Using too much gain can degrade the image and create artifacts, and using too little gain can negate real echo data (see Figure 1-5). In addition, most machines also have time gain compensation (TGC) controls (usually a group of slider rheostats) to adjust the gain selectively at various depths. To compensate for attenuation, echoes are electronically amplified proportional to the depth of their origin (i.e., time of their return to the transducer). TGC controls need readjustment when, for example, a large fluid-filled window is used; otherwise, the ROI behind the window will be too bright (overamplified). Further improvement of B-mode image quality can sometimes be achieved by THI.1–5 PRF is the rate of pulses used to analyze the Doppler shift. For PW Doppler measurements of arterial flow, PRF is generally set at 3000 to 4000 pulses/second or Hz, which allows a wide enough Doppler range to fit spectra with most arterial velocities. If the actual shifts exceed the scale, the peak part of the spectrum in excess of the scale appears in the wrong place (PW Doppler) or in the wrong color (color Doppler). This phenomenon is called aliasing, and the Doppler shift limit at which it occurs is called the Nyquist limit and equals 1⁄2 PRF. In color Doppler, aliasing is avoided by increasing the scale (PRF) and/or using the baseline control to dedicate a larger portion of the scale to the flow in the dominant direction (toward or away from the probe), and/or by increasing the angle between the ultrasound beam and the flow vector (e.g., from 45 to 60 degrees) to reduce the actual shifts. In spectral Doppler, similar controls are available. In veins with much lower flow velocities, a PRF setting of 1000 Hz is a typical starting frequency. Modern machines have built-in “presets” for arterial and venous examinations, with PRF set to appropriate values. Older machines may have to be adjusted manually, including frequency filters. In PW Doppler, sample volume (also known as gate) size and placement are essential for correct measurements. A smaller sample volume of 1 to 2 mm is used when detailed investigation of flow within the vessel is required (e.g., when the degree of flow turbulence is to be assessed). The sample volume is placed in the center of the vessel or at the point of peak velocity indicated by the color image. In cases where blood flow is reduced (e.g., venous circuits) a larger sample volume may be appropriate. The Doppler spectral waveforms are produced by spectral analysis of the frequencies contained in the echoes returning from the sample volume area, using real-time fast Fourier transform or similar algorithms.1–5
Fundamentals: Essential technology, concepts, and capability
Fundamentals: Principles, terms, and concepts
Equipment and imaging modes
Equipment
![]()
![]()
![]()
Imaging modes (see figure 1-3)
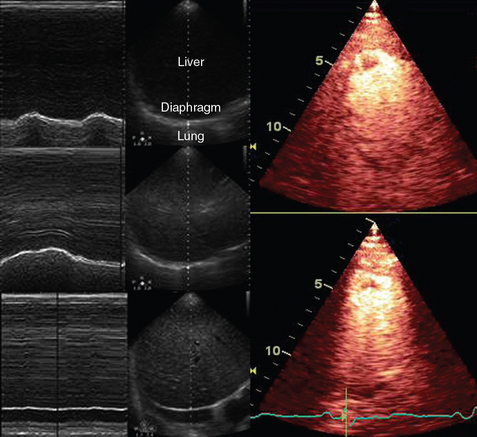
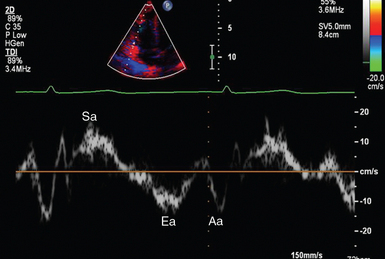
Image quality and optimization
Radiology Key
Fastest Radiology Insight Engine

