Imaging genomics combines imaging-defined phenotypes with molecular determinants of disease. Recent studies have examined the relationship between MRI-derived feature sets and gene expression in gliomas, including glioblastoma (GBM). Several groups have identified correlations between the expression of particular molecularly defined oncogenic pathways in GBM and malignant phenotypes on MRI. The combination of clinical, genetic, and imaging data has improved prognostic modeling and has identified potential therapeutic targets. Many challenges remain in fully leveraging the associations between such large datasets, but even current methodology shows promise in helping to craft individually tailored treatments to patients with brain tumors and other diseases.
Key points
- •
Imaging genomics seeks to develop a method that leverages and integrates large datasets to identify predictive and prognostic biomarkers and new therapeutic targets in patients with glioblastoma.
- •
A substantial methodological framework including new data analysis methods has been developed to meet the challenge of working with big data.
- •
Malignant imaging phenotypes determined by MRI have genetic correlates; therefore, imaging may provide a means of panoramic and noninvasive surveillance of oncogenic pathway activation as patients are treated for GBM.
Introduction
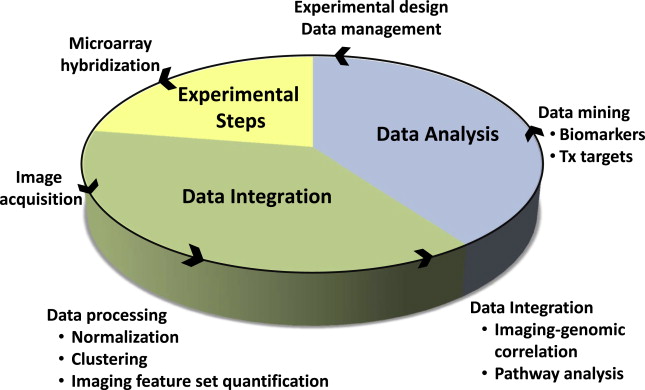
Imaging genomics, radiogenomics, and radiomics are different names for essentially the same thing, a field of study focused on understanding the relationship between medical imaging data and molecular features of disease. It is the integration of big data, quantitative imaging features taken from large numbers of images (typically MRI and computed tomography [CT]) and “-omic” data, which represent gene, protein or metabolite expression, as well as gene copy number, DNA methylation, and other important molecular markers. In oncology, this approach is being used to combine cancer phenotypes that can be globally assessed by imaging, with relevant molecular data, in order to develop prognostic and predictive biomarkers ( Fig. 1 ). Improved diagnostic tests, better clinical decision making, new therapeutic targets, and improved understanding of tumor biology are all potential deliverables. Another promise of this approach is the ability to tailor therapy to enhance treatment effectiveness at the individual patient level. This article focuses on the application of imaging genomics to glioblastoma, one of the first pathologies for which this concept was applied.
Introduction
Imaging genomics, radiogenomics, and radiomics are different names for essentially the same thing, a field of study focused on understanding the relationship between medical imaging data and molecular features of disease. It is the integration of big data, quantitative imaging features taken from large numbers of images (typically MRI and computed tomography [CT]) and “-omic” data, which represent gene, protein or metabolite expression, as well as gene copy number, DNA methylation, and other important molecular markers. In oncology, this approach is being used to combine cancer phenotypes that can be globally assessed by imaging, with relevant molecular data, in order to develop prognostic and predictive biomarkers ( Fig. 1 ). Improved diagnostic tests, better clinical decision making, new therapeutic targets, and improved understanding of tumor biology are all potential deliverables. Another promise of this approach is the ability to tailor therapy to enhance treatment effectiveness at the individual patient level. This article focuses on the application of imaging genomics to glioblastoma, one of the first pathologies for which this concept was applied.
Background
Microarray Technology
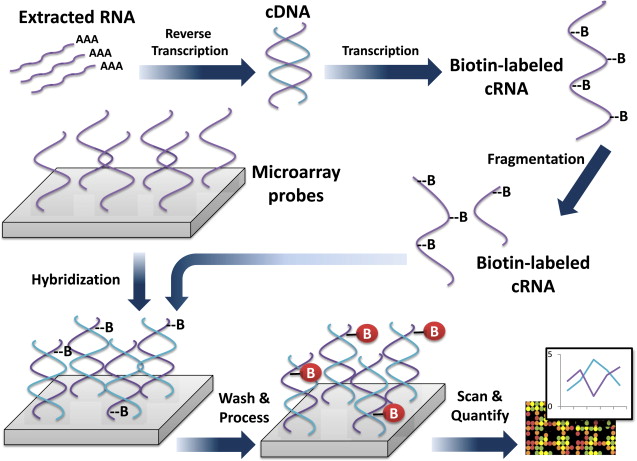
Genomic information is a measure of gene expression based on mRNA isolated from tissue of interest. Microarrays, which contain thousands of complementary oligonucleotide or cDNA sequences (referred to as probes) are affixed in designated positions to a glass slide, so that mRNA-derived nucleic acids can be specifically detected via hybridization. The plates are washed, and the signal from these hybridized probes is detected and recorded. In this way the expression of thousands of genes can be quantified in a single experiment ( Fig. 2 ). Microarray technology and analysis have generated great interest among investigators of brain cancer for over a decade.
Microarray Technology—Limitations
Oftentimes tissue for microarray analysis will be derived from surgical resections without precise tissue sample localization. This introduces sampling error in tumors such as glioblastoma (GBM) that are spatially heterogeneous in gene expression and imaging features. Additionally, tissue may not be composed of 100% tumor cells but may be of variable tumor cell concentration. This will be reflected in the average tissue expression of tumor-associated genes and can lead to spurious conclusions about gene expression levels when unaccounted for.
Another limitation of microarray analysis is that multiple probes recognizing the same gene may be present. These probes can have varying sensitivity and specificity for the target gene, and some probes may more accurately reflect the dynamic range of gene expression than others. This variability can be a source of error or potentially lead to varying conclusions about gene expression from the same dataset. If multiple microarray platforms are used, then data will need to be normalized across platforms. Another caveat is that gene expression levels do not always reflect protein concentrations, and proteins are typically the effector molecules of interest.
Caveats in Interpreting Genomic Data
Once genomic data is acquired, association with imaging features must be performed. This presents some difficulties due to multiple-hypothesis testing leading to type 1 error (false positives). Clearly when there are thousands of genes that are being tested for a relationship to multiple imaging features, numerous correlations in expression (at the P <.05 level) occur by chance. Conversely, if one were to use a Bonferroni correction for multiple hypothesis testing, the requisite P values to demonstrate a statistically significant link would be so small that few associations would be found, even when those associations exist (that is, type 2 error or false negative). To overcome these issues, various techniques have been employed. For instance, Tusher and colleagues described a method called Significance Analysis of Microarrays (SAM) that “assigns a score to each gene on the basis of change in gene expression relative to the standard deviation of repeated measurements.” A false discovery rate is determined by using permutations of the repeated measures in order to develop an estimate of the percentage of genes that will show such a change by chance. Using this method, the authors were able to reduce the false discovery rate from 60% to 84% to a more reasonable 12% in their analysis.
Another method to account for multiple hypothesis testing is gene set enrichment analysis (GSEA). GSEA involves ranking genes from 2 sample groups by their differential expression, scoring enrichment by the Kolmogorov-Smirnov statistic using a predetermined set of genes common to a particular biological function, chromosomal location, or regulation. The significance of the scoring is assigned based on an empirical permutation method that corrects for multiple hypothesis testing.
In addition to identifying associations between single genes and imaging features, it also is possible to group genes by pathways based on prior knowledge. There are several proprietary as well as freely available computer programs that cluster genes based on potentially congruous function or patterns of activation. Commonly used methods include The Database for Annotation, Visualization and Integrated Discovery (DAVID), the Kyoto Encyclopedia of Genes and Genomes (KEGG), and the Ingenuity Pathway Analysis (IPA). If genes that are known to be regulated as a functional unit are all correlated with a particular image feature, then the level of confidence that this represents a nonrandom association increases.
Gene expression levels of identified targets can be independently confirmed with reverse transcription polymerase chain reaction (RT-PCR), but it is important to keep in mind that correlative microarray data analysis is, by necessity, somewhat of a fishing expedition (ie, a method that sweeps up a broad swath of potential associations for the purpose of directing further investigation). In this way, it can serve as a hypothesis-generating, rather than a hypothesis-testing, approach.
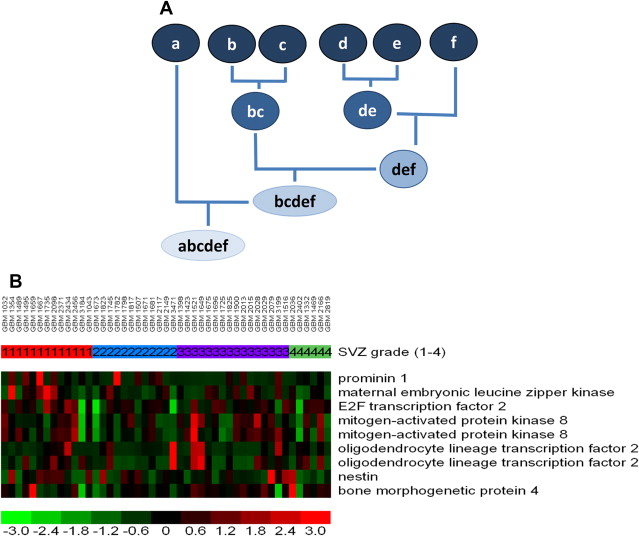
Genes are typically organized via a hierarchical clustering analysis (to construct a dendrogram), arranged according to the degree of correlation between expression levels, and displayed as heat maps ( Fig. 3 ). This is among the many ways to organize gene expression information. Such hierarchical clustering analysis is the most common method used, albeit with several known limitations. For instance, varying ways of clustering yield (sometimes substantially) different results. Leaving out samples (for quality control or other reasons) can drastically affect the progression of the analysis, resulting in potentially different dendrograms. Any mistakes made early in the process are propagated throughout the analysis without the ability to be rectified.
Imaging-Genomics—Advantages
Whereas microarray data usually represent a snapshot in time (ie, state of tumor at time of biopsy/resection), imaging surrogates of molecular features can potentially be followed for the lifetime of a patient. In addition, imaging has the advantage of providing a global assessment of the tumor, whereas microarray data represent gene expression from only a small fragment of tissue, and, as mentioned, are subject to sampling error.
History of Cancer Genome Atlas and the Visually Accessible Rembrandt Images Feature Set
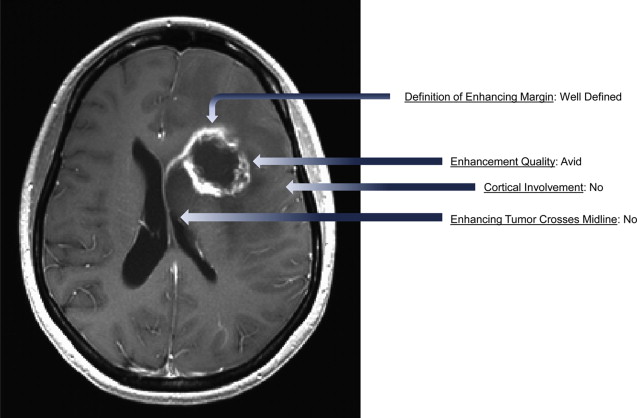
The National Institutes of Health (NIH)-sponsored Cancer Genome Atlas (TCGA) is an open-access repository of genomic and clinical data for more than 20 tumor types, including GBM. The TCGA is linked to The Cancer Imaging Archive (TCIA), which contains presurgical MRI scans of GBM cases that are associated with the patient’s genomic and clinical data. In addition, a multi-institutional group of neuroradiologists has developed a standardized feature set ( Fig. 4 ) consisting of 24 observations (expanded from a published report of potentially prognostic imaging features in malignant glioma). This visually accessible rembrandt images (VASARI) feature set has been used to score over 100 tumors, and the results have been made freely accessible as part of the TCGA/TCIA initiative. The advantage of this approach is that it allows for the investigation of large data sets that are rarely available at the single institution level, resulting in the generation of more statistically robust findings. Another advantage is that open access to the source data allows analyses to be independently validated by other interested researchers. One of the limitations of the TCGA data is that the specific tumor location and accompanying imaging features are not reported, as many tissue samples are from standard surgical resections rather than stereotactic biopsies.
Molecular Classification of Glioblastoma
In 2010, Verhaak and colleagues published a seminal analysis of the TCGA database that divided GBM into 4 distinct molecular subtypes based on PDGFRA, IDH1, EGFR, and NF1 expression. EGFR was associated with classical GBM, NF-1 with mesenchymal, and PDGFRA/IDH1 with the proneural group. They also defined a neural group. The nomenclature used by Verhaak and colleagues was developed earlier by Phillips and colleagues and was originally published in 2006. These authors divided malignant glioma into 3 subclasses based on similar gene expression profiles of tumors within a class and on interclass survival differences. The groups were named proneural, proliferative, and mesenchymal. Proneural tumors had the best prognosis and were abundant in grade 3 tumors. Proneural tumors also were associated with increased gene expression of OLIG-2 and BCAN . The authors additionally noted that tumors tended to shift to the mesenchymal class at recurrence. Thus molecular subclasses of GBM capture some of the molecular heterogeneity of GBM and appear to add value to histopathologic analysis for prognosis, and also identify potential driver pathways that are, or could be, therapeutic targets.
There are at least 2 additional molecular determinants in GBM that affect prognosis and potentially have imaging correlates. The first is the methylation, and therefore inactivation, of the O 6 -methylguanine-DNA methyltransferase (MGMT) promoter. MGMT is a key DNA repair enzyme that specifically removes promutagenic alkyl groups from the O 6 position of guanine in DNA, thereby diminishing toxicity of akylating agents used for chemotherapy. MGMT promoter methylated tumors carry a better prognosis than unmethylated tumors and are thought to be more sensitive to temozolomide therapy (TMZ, the chemotherapy agent used for standard treatment of malignant gliomas).
Recently (2008), a cancer genome sequencing project discovered an association between mutations in the isocitrate dehydrogenase-1 (IDH-1) gene and GBM. This mutation was subsequently shown to result in the production of the putative onco-metabolite 2-hydroxyglutarate (2-HG) and appears to be a driver of gliomagenesis, occurring before the p53 mutation. The IDH-1 mutation is associated with DNA hypermethylation; it is linked to the CpG island methylator phenotype (G-CIMP), which includes methylation of the MGMT promoter. The IDH-1 mutation also acts to inhibit the differentiation of progenitor cells, is common in lower grade gliomas and secondary GBM, and is thought to be rare in primary GBM. The IDH-1 mutation, like MGMT promoter methylation with which it is associated, is linked to longer survival in glioma patients.
Molecular Heterogeneity of Gliobastoma
Heterogeneity of GBM is an obstacle to successful treatment, and may indicate that effective therapy requires a combination approach to target multiple abnormal molecular pathways that drive malignant phenotypes. Heterogeneity of GBM includes variations in imaging features and tissue histology and is found at the level of a single cell. Recently in a report published in Science , Patel and colleagues performed a transcriptome analysis of single cells disassociated from GBM tumor samples. They demonstrated that gene expression was broadly spread between cells from the same tumor, indicating substantial intratumoral heterogeneity. They identified 4 genomic metasignatures that were enriched in genes for cell cycle, hypoxia, immune system, and oligodendrocyte function. Interestingly, molecularly defined subsets of GBM (proneural, proliferative, mesenchymal) were represented by single cells from the same tumor. The use of imaging to provide a multiple time point and panoramic view of this spatial and temporal heterogeneity in GBM is an important rationale underlying the potential of imaging–genomic analysis.
Imaging–Genomic Analyses for Glioma
One of the first papers to try to correlate imaging with “-omics” data, in this case proteomics, was authored by Hobbs and colleagues in 2003. Using mass spectrometry as an alternate to 2-dimensional polyacrylamide gel electrophoresis (2D-PAGE), the authors examined the relationship between expression of approximately 100 proteins and peptides and contrast enhancement in 4 patients with GBM, generating protein profiles for comparison. Specifically, they compared protein levels in contrast-enhanced and nonenhanced regions of tumor derived from surgical resection specimens. They found that protein expression was different between enhancing and nonenhancing components of the same tumor. Protein expression varied in enhancing tumor even within areas of similar histology. Nonenhancing tumor appeared to be more similar between patients compared with enhancing tumor. Thus the authors demonstrated the molecular heterogeneity of GBM, and how that heterogeneity is most abundant in contrast-enhancing regions. Additionally, given similar histology, they demonstrated that this heterogeneity is not captured by features visible in tissue sections by light microscopic evaluation. The authors hypothesized that underlying gene expression profiles correlate with imaging features of these tumors. It is exactly this hypothesis that has driven much of imaging–genomic analysis since. Although a remarkable paper, the authors were limited by the technology available at the time. For instance, only peptide/protein profiles generated by mass spectra were used for analysis; individual proteins were not identified. The study also was limited by the scope; only 4 patients, 1 imaging feature, and 100 peptides/proteins were considered. Microarrays and advanced proteomic techniques, which provide for the genome-wide compilation of expression data, were not available at that time. However, even using the limited means available, the authors were able to provide a proof-of-principle of the potential value in combining imaging and expression data to increase understanding of tumor biology.
The following year, a report was published that confirmed the hypothesis of Hobbs and colleagues, namely that there is a relationship between imaging features and gene expression levels. Raza and colleagues examined the correlation between the amount of necrosis and gene expression in patients with GBM. Again limited by the technology available, the authors were able to examine the expression of 588 genes in 15 GBMs, finding that 9 genes positively correlated and 17 genes negatively correlated with necrosis grade. Importantly, these findings were corroborated with immunohistochemical analysis of tissue sections from these tumors, confirming the relationship between the microarray data and protein expression levels.
Necrosis is a hallmark of GBM and, previous to this work, had already been shown to be tightly associated with shortened patient survival. Underscoring the prognostic impact of imaging features, Pope and colleagues demonstrated that histopathologically defined grade 3 tumors have survival times comparable to GBM if they show imaging evidence of necrosis. Hypoxia, underlying the development of necrosis, is also thought to drive the malignant potential of GBM, resulting in increased invasion, and also, through the up-regulation of VEGF, increased angiogenesis. Imaging is the only method to obtain a global view of necrosis levels in these tumors. Thus the work of Raza and colleagues represents an important advance, because it is the first to specifically evaluate the relationship between gene expression and necrosis levels determined by MRI. Several subsequent studies have also investigated this association. And perhaps in the near future imaging with specific hypoxia markers (such as 18F-fluoromisonidazole, 18F-FMISO PET) will provide additional understanding of the molecular mechanisms that drive hypoxia in malignant gliomas.
Several papers further characterized the regional variation of gene expression present in glioblastoma. For instance, Mariani and colleagues used a 5700-gene cDNA array to examine gene expression in core versus peripheral invasive cells isolated from GBM tumor patients. A significant difference in gene expression between these 2 groups of cells was demonstrated. Van Meter and colleagues used MRI-guided biopsies to compare intratumoral regional differences in gene expression, expanding the analysis to 22,283 probes by using more modern microarray technology. They established a consensus list of 643 genes that were expressed at a 2-fold difference in periphery versus core tissue samples from 6 GBMs. Importantly, results were validated with PCR and Western blotting analyses, and demonstrated, for instance, that VEGF expression was elevated in tumor core compared with the periphery. Barajas and colleagues also analyzed differences in gene expression between the enhancing tumor core and peripheral nonenhancing GBM with similar results; the contrast-enhancing regions had more complex vascular hyperplasia as well as increased hypoxia and tumor cell density. Additionally, 846 genes were expressed differentially at the 2-fold level between the enhancing core and the tumor periphery. There is substantial overlap with the findings of Van Meter and colleagues For instance, both groups showed up-regulation of VEGF and various collagen genes in the enhancing tumor core. However, there were also some differences in relative gene expression, which may be due to regional heterogeneity of GBM and the relatively small tumor sample size in the 2 studies. In general, the Van Meter paper emphasized increased expression of genes associated with cell migration, angiogenesis, cell survival, and integrin signaling in the enhancing core, whereas Barajas and colleagues report increased expression of genes associated with mitosis, angiogenesis, and apoptosis. It is important to note that part of this discrepancy may be due to differences in gene classification schemes used in the 2 papers.
In 2007, Pope and colleagues published the first genome-wide analysis of the relationship between specific imaging traits and gene expression in malignant gliomas (grade 3 and 4 tumors), using microarrays to assess the expression of approximately 14,500 genes in 71 malignant tumors. The analysis focused on the relationship between VEGF expression and edema, as VEGF is known to be a potent permeability factor and is the target of the antiangiogenic humanized monoclonal antibody bevacizumab. VEGF gene expression levels were tightly correlated with tumor grade, being expressed approximately 4-fold higher in GBM than in grade 3 tumors. RT-PCR was used to confirm VEGF expression levels and showed good correspondence with the microarray data. As expected, VEGF expression was also correlated with several other known proangiogenic genes. Tumors with little or abundant edema had higher levels of VEGF than tumors with no edema. For tumors with no edema—but not tumors with little or abundant edema— VEGF stratified survival. This demonstrates how gene expression can provide prognostic information in subsets of tumors that are defined by imaging traits.
This study also addressed the question of whether VEGF is the sole driver of edema in malignant gliomas. To investigate this issue, gene expression was acquired from tumors that had both low VEGF expression levels and substantial edema. Using this method, neuronal pentraxin 2 ( NPTX2 ) was identified as a gene whose expression levels correlated with edema, were prognostic for survival (independent of edema) and were independent of VEGF expression. Expression of NPTX2 was tightly correlated with the water channel aquaporin 3 (AQP3), in addition to several other genes including hepatocyte growth factor (HGH). Neuronal pentraxins are homologous to the acute phase-associated C-reactive protein. Aquaporins are a family of membrane proteins that facilitate the movement of water molecules across cell membranes, and at least 1 member of the aquaporin family, aquaporin-4, has been shown to promote brain edema in ischemic stroke models. Lastly HGF is a proangiogenic cytokine that acts on endothelial cells and has a variety of protumor effects in GBM. The relationship between these proteins and the production of edema certainly requires further study, but this correlation of gene expression suggests the possibility of a proedema gene module that is VEGF -independent, and therefore could represent a complementary target to VEGF inhibition. Understanding the regulation of VEGF in GBM may be crucial, as VEGF is driven by hypoxia, and adaptation to hypoxia is a key phenotypic property of GBM. The findings of this imaging–genomic analysis illustrate how this methodology can uncover potential gene modules that mediate tumor phenotypes and malignant cascades in GBM and other tumors. Additionally, these data may help to explain treatment failure (ie, why some tumors do not have reduction in edema following anti- VEGF therapy). Of note, these observations would not have been possible without the use of genomic–imaging analysis, because imaging is the only way to get a global perspective of edema for these tumors.
Pope and colleagues also assessed differences in gene expression in GBM based on the presence or absence of nonenhancing tumor (nCET). This was based on previous work that had shown that nCET was associated with longer survival. Fifty-two GBMs were split into 2 groups, those that contained regions of nCET, and those that did not. Microarray analysis showed that high expression levels of proangiogenic genes were associated with the lack of nCET, whereas the presence of nCET was associated with high expression levels of the stem cell and oligodendrocyte lineage marker OLIG-2 as well as genes previously shown to be associated with secondary GBM (GBM arising from lower-grade gliomas). Later work demonstrated the association of nCET with the isocitrate dehydrogenase-1 (IDH-1) mutation. The IDH-1 mutation is thought to be a marker of secondary, as opposed to de novo, GBM and drives the methylated, proneural GBM phenotype. Synthesizing this information, it appears that 2 classes of GBM emerge. One includes tumors that are IDH-1 positive, MGMT promoter methylated, secondary GBMs that occur in younger patients, have nCET, are of the proneural molecular class, and carry a better prognosis. The other group is comprised of de novo GBMs that are highly necrotic, IDH-1 and nCET negative, have increased expression of proangiogenic factors, are not proneural, and have shorter survival ( Table 1 ). Although clearly simplistic, this model shows how the integration of molecular, genomic, epigenetic, imaging, and clinical data can be used to generate a broad understanding of the heterogeneity of tumor biology in GBM and how this impacts prognosis. It also supports the argument that image–gene expression correlates do correspond with the understanding of tumor biology. There has been some concern that such associations might be random, given the high dimensionality of the gene expression data and lack of multiple hypothesis testing or other appropriate safeguards against type 1 error, but this does not seem to be the case.
Related posts:


Stay updated, free articles. Join our Telegram channel

Full access? Get Clinical Tree


