Heart and Pericardium
Pamela K. Woodard
Sanjeev Bhalla
Cylen Javidan-Nejad
Paul D. Stein
Fernando R. Gutierrez
Cardiovascular disease is the major cause of death in the Western world. More than 70 million Americans have cardiovascular disease (6). Predominantly this is coronary artery disease, but it also includes congenital heart disease and other forms of acquired heart disease, such as valvular disease, cardiomyopathies, tumors, and pericardial processes. In 2002, an estimated 1.5 million invasive diagnostic cardiac catheterizations were performed (6). Cardiac computed tomography (CT) and magnetic resonance imaging (MRI) can be minimally invasive alternatives to cardiac catheterization, providing anatomical and—with MRI and newer multidetector (MDCT) systems—functional information. Although echocardiography is also noninvasive and more portable and widely available than MR or MDCT, MRI and CT have the advantage of three-dimensional (3D) coverage of the heart. Thus, imaging results are less operator- dependent. Indeed, for certain cardiac indications, MRI and CT have become the gold standard. This is the case with cardiac MR imaging for left ventricular function and myocardial mass. In this chapter we address the technical aspects of MDCT and MR imaging of the heart, along with specific indications for their use and diagnosis of disease entities.
TECHNIQUE
Cardiac CT
Recent progression in multidetector computed tomography (MDCT) technology has advanced its capability in the diagnosis of cardiac disease. Specifically, the progression from single- and dual-detector systems to 4-detector, and now 16- to 64-detector systems, has allowed improved coronary CT angiography, leading to better coronary lesion visibility (42,75,94). Cardiac CT, in terms of protocol, can broadly be broken down into four categories:
Coronary CT angiography
Calcium scoring
ECG-gated noncoronary contrast-enhanced cardiac imaging (e.g., pericardial disease, congenital heart disease)
Non–ECG-gated contrast-enhanced cardiac image for pulmonary vein mapping
The latter protocol is non–ECG-gated, as these patients usually are in atrial fibrillation with an irregular cardiac rhythm.
Image Acquisition and Technique
Cardiac Gating
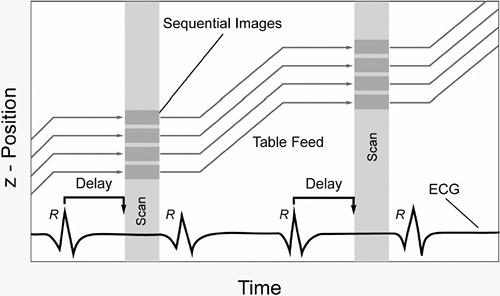
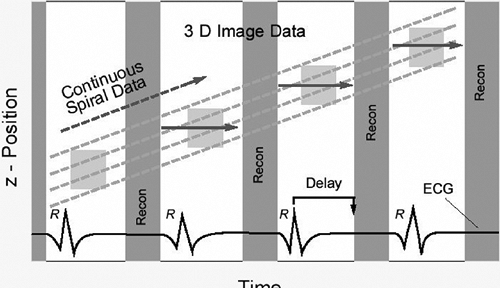
Unlike CT imaging of other organ systems, CT imaging of the heart requires methods to decrease cardiac motion artifacts. Two basic methods can be used: prospective electrocardiogram (ECG)-triggering (also known as sequential scanning) and retrospective ECG-gating (89,102). With prospective ECG-triggering, a signal is derived from the R-wave of the patient’s ECG (Fig. 9-1). Using this trigger, scanning is performed over a finite portion of the R-R interval, usually in diastole, during the period of least cardiac motion. This technique is used in electron beam tomography (EBT) and also can be used in multidetector computed tomography (MDCT) acquisition of images for calcium scoring. Disadvantages are that this type of gating is very sensitive to cardiac motion artifacts and image misregistration. This is especially true in patients with arrhythmias. With retrospective ECG-gating, raw data are acquired using the spiral mode at a very low pitch. At the same time the patient’s ECG is recorded. Using the ECG tracing, images can be reconstructed to create image stacks at any desired
phase of the cardiac cycle (Fig. 9-2). Because of the low pitch and data oversampling, data are available along the entire R-R interval (89). Thus, images can be reconstructed at 5% to 10% intervals to be used to create cine loops. This is sometimes termed “four-dimensional imaging” of the heart. In addition, as left and right coronary artery motion is not synchronous, images can be inspected to determine the point in the data acquisition over the R-R interval where motion is the least for each vessel. As a rule of thumb, image reconstruction for coronary images is usually performed at 60% to 65% of the cardiac cycle. However, it may be that for the left coronary system the least motion occurs in diastole, while the right coronary artery may have the least motion during end systole, especially in heart rates above 70 beats per minute (bpm) (13).
phase of the cardiac cycle (Fig. 9-2). Because of the low pitch and data oversampling, data are available along the entire R-R interval (89). Thus, images can be reconstructed at 5% to 10% intervals to be used to create cine loops. This is sometimes termed “four-dimensional imaging” of the heart. In addition, as left and right coronary artery motion is not synchronous, images can be inspected to determine the point in the data acquisition over the R-R interval where motion is the least for each vessel. As a rule of thumb, image reconstruction for coronary images is usually performed at 60% to 65% of the cardiac cycle. However, it may be that for the left coronary system the least motion occurs in diastole, while the right coronary artery may have the least motion during end systole, especially in heart rates above 70 beats per minute (bpm) (13).
To decrease cardiac motion, imaging at a heart rate of less than 65 bpm is preferable. As a result, intravenous (5 to 10 mg, metoprolol IV at the time of the examination) or oral (50 to 100 mg, metoprolol tartrate by mouth 30 minutes before imaging) beta-blockers are routinely administered if the patient’s heart rate is greater than 65 bpm. It is important to check the patient’s blood pressure prior to beta-blocker administration and again after the examination, before the patient leaves the department, to ensure that the patient is not hypotensive. Other contraindications to the administration of beta-blockers include severe aortic stenosis, Mobitz type II or third-degree heart block, and active asthma (12).
Temporal Resolution
Temporal resolution of ECG-gated cardiac CT studies varies with both heart rate and gantry rotation time. Gantry rotation speeds of 330 msec rotation are now possible on 64-detector systems, an improvement from the 500 msec/rotation speeds of 4-detector scanners. These higher gantry rotation speeds permit temporal resolution of 80 to 100 ms (43). While EBT still has better temporal resolution (50 to 100 ms), MDCT maintains better image quality with respect to spatial resolution and image noise (2,12).
With retrospectively gated MDCT data, if the pitch of the acquired data is low enough, temporal resolution can be improved by reconstructing image data from two to four cardiac segments (40). This technique can be used in patients with faster heart rates to help decrease cardiac motion, and some manufcturers have incorporated this technology into their 64-detector scanners.
Spatial Resolution
Spatial resolution of volumetric MDCT is, in its best case, 0.4 × 0.4 × 0.4 mm3, whereas the resolution of conventional x-ray angiography is on the order of 0.2 × 0.2 mm3 (12,41). Because coronary arteries are 3 to 4 mm in diameter proximally and 1 to 2 mm in diameter distally, some researchers and clinicians have sought to increase the size of the coronary artery diameter transiently during CT scanning via the administration of 0.4 mg sublingual nitroglycerin given 1 minute prior to scanning (114). If this is done, blood pressure should be monitored carefully, especially if a beta-blocker is administered concomitantly.
Protocols
Protocols for CT cardiac imaging depend on both the type of scanner used and the indication for imaging (Table 9-1).
TABLE 9-1 CARDIAC MDCT SCAN PROTOCOLS (E.G. SIEMENS SENSATION 16/64, FORCHHEIM, GERMANY) | |||||||||||||||||||||||||||||||||||||||||||||||||||||||||||||||||||||||||||||||||||||||||||||||||||||||||||||||||||||
|---|---|---|---|---|---|---|---|---|---|---|---|---|---|---|---|---|---|---|---|---|---|---|---|---|---|---|---|---|---|---|---|---|---|---|---|---|---|---|---|---|---|---|---|---|---|---|---|---|---|---|---|---|---|---|---|---|---|---|---|---|---|---|---|---|---|---|---|---|---|---|---|---|---|---|---|---|---|---|---|---|---|---|---|---|---|---|---|---|---|---|---|---|---|---|---|---|---|---|---|---|---|---|---|---|---|---|---|---|---|---|---|---|---|---|---|---|---|
| |||||||||||||||||||||||||||||||||||||||||||||||||||||||||||||||||||||||||||||||||||||||||||||||||||||||||||||||||||||
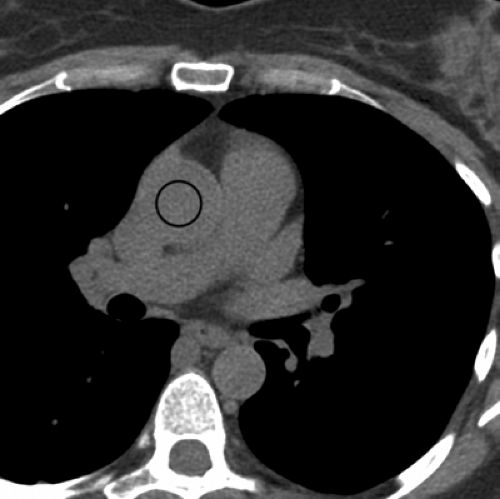
Coronary Computed Tomographic Angiography. For 64-slice systems, images are acquired in spiral mode with 330 to 350 ms rotation time and 64 × 0.6-0.625 mm collimation (either 64 detectors [General Electric] or 32 detectors with double focal spot resulting in 64 slices [Siemens]). The table increment is 3.8 to 9.2 mm/rotation, also varying by vendor. Other parameters include pitch 0.2, tube voltage 120 kVp, 750 to 1,200 effective mAs. Effective mAs will vary in degrees with both the vendor and patient size, with greater mAs selected for heavier patients. Iodinated contrast agent is injected at a rate of 4 to 5 mL per second with the length of administration tailored to the length of the scan. Although some centers inject less contrast agent, at our center an average 80 mL is injected intravenously followed by a 50 mL saline chaser (21). This provides good opacification of the coronary arteries with saline washout of contrast material in the superior vena cava and right ventricle. Patients are instructed in breath holding, with a mean breath-hold duration for this acquisition of 8 to 12 seconds. The start of image acquisition is delayed according to the previously determined contrast agent transit time, which is done using either a test dose or bolus timing software, such as SmartPrep (General Electric) or CareBolus (Siemens). If bolus timing software is used, the region of interest (ROI) for the program is placed in the ascending aorta at the level of the main pulmonary artery (Fig. 9-3). Image construction is usually performed at a “soft” kernel such as B30f; however, if the vessels are heavily calcified or there are coronary artery stents in place, a sharper kernel such as B45f may be appropriate (60).
Calcium Scoring. Calcium scoring routinely has been performed with prospective ECG-gating, that is, data are acquired sequentially over a 100- to 200-millisecond window prescribed with a center at 60% to 65% of the cardiac cycle. Radiation dose is low—less than 1 mSv. Images are usually acquired at 3-mm slice thickness and reconstructed at 1.5-mm increments.
Some authors have recently made an argument for acquiring the data for calcium scoring with retrospective rather than prospective ECG-gating (61). Although the radiation dose is higher (2 mSv) for data acquired in this fashion, it has been shown that there is less interstudy variability for both Agatston calcium scores and calcium volume measurements (61). Although this variability may be important for patients undergoing close follow up over time, the accuracy of sequential MDCT for coronary calcium quantification is considered sufficient in most cases for stratification of patient risk (51).
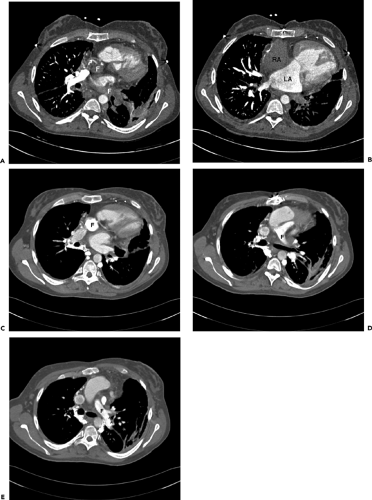
Noncoronary ECG-Gated Cardiac Imaging. Noncoronary ECG-gated cardiac imaging can be used when broader coverage is required, as in assessment of the heart for congenital or pericardial disease or tumor. The feed/rotation is greater (and the pitch not as slow) to allow coverage in a single breath-hold. The acquired slice thickness is 2 mm, with reconstruction increment at 1 mm, permitting adequate visibility of the heart, great vessels, and surrounding structures. At our institution, this essentially is a gated pulmonary embolus (PE) protocol.
Given that congenital heart lesions vary, contrast enhancement may be timed in eitherthe right or left heart. Knowledge of the type of image to be imaged is important, as those with parallel pulmonary circuitry (Fig. 9-4) may require a split injection, with contrast injected via both the antecubital and femoral veins.
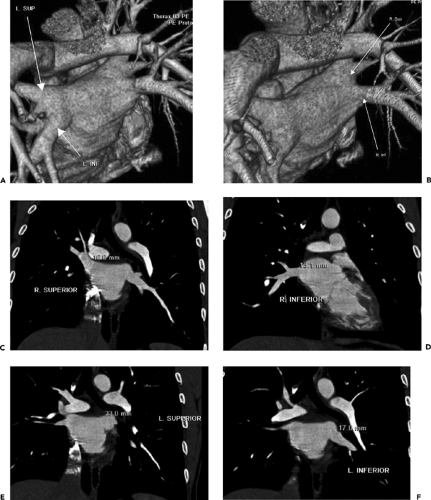
Pulmonary Vein Imaging. Pulmonary vein imaging, for the most part, is performed without ECG-gating, because most of these studies are performed in patients with atrial fibrillation prior to radiofrequency ablation. Contrast enhancement is timed to the left atrium. Images are postprocessed using a shaded surface display of the left atrium to demonstrate anatomy (Fig. 9-5), and multiplanar reconstructions (MPRs) of the pulmonary veins at the ostia are used to provide measurements of ostial diameter and distance from the ostia to the first vein branch.
Radiation Dose and Methods of Reduction
Although the radiation dose for calcium scoring is relatively low, coronary CT angiography methods provide a radiation dose of 8 to 10 mSv on 16-detector systems (130) and 14 to 18 mSv on 64-detector systems. Methods such as prospective tube current modulation can decrease this dose on the 64-detector systems to 7 to 11 mSv (7,107).
Pulsed-Gating or Prospective Tube Current Modulation. During retrospective ECG-gating, the radiation exposure can be significantly reduced by prescribing tube current modulation. Using this technique, the maximum mAs is employed only during a prescribed period, usually a window of time centered at 65% of the cardiac cycle. Tube current is reduced by 80% during the remaining cardiac cycle. This method can reduce the radiation dose by 30% to 50%, depending on the heart rate, but it is most effective in patients whose heart rates are slower (12).
On-Line Tube Current Modulation. Online tube current modulation adapts the mAs delivered during the scan based on patient thickness as determined from the topogram. Radiation dose reduction has been described as between 30% to 50%, depending on the body part imaged (49,62). Although online tube current modulation use with ungated protocols demonstrates good results without compromising image quality (49,62), care should be taken when using this method with ECG-gated protocols, especially in concert with prospective tube current modulation. The vendor should be consulted to determine whether its concurrent use with ECG-gated protocols will create undue image noise.
Image Postprocessing and Interpretation
Coronary CT angiograms performed for the assessment of atherosclerosis should be interpreted using a software package that can create curved MPRs of each coronary artery in two image planes lengthwise, along the course of the coronary artery (89). A number of commercial software packages allow these curved MPRs to be created with relative ease, creating the curved MPRs using either edge detection or seed-growing techniques. In addition, most have functions that permit measurement of percent stenosis diameter. Because of the near-isotropic voxel size in 16- and 64-detector MDCT, these MPRs maintain an image quality that is similar in appearance to the axial images themselves (89).
Three-dimensional volume rendering and shaded surface display may also be useful, more so in the overview of coronary artery course in the assessment of anomalous coronary arteries, or in providing an anatomic overview, however, than in the assessment of atherosclerotic lesions.
Three-dimensional volume rendering and shaded surface display, on the other hand, can play a key role in assessment and preoperative planning for vascular anomalies, such as anomalous pulmonary venous return, aortic coarctation, or pulmonary artery stenoses. They can be useful in demonstrating complex congenital anomalies. As mentioned above, they also play a key role in demonstrating pulmonary venous anatomy precatheter radiofrequency ablation.
Also, as mentioned previously, retrospectively gated 3D data can be reconstructed at 5% to 10% intervals over the cardiac cycle to create cine loops. These loops, although at a lower temporal resolution than MR, can be used to assess wall motion abnormalities, myocardial mass, ejection fraction, and valve motion (Fig. 9-6).
Cardiac MR
Unlike CT imaging of the heart, the cardiac MR protocol performed is highly dependent on the clinical question (110). For instance, the protocol for assessing the extent of myocardial infarction (MI) differs greatly from the protocol for assessing coronary arteries or an intracardiac shunt. Thus, one must determine the specific reason for the performance of the examination.
Next, as is routinely done, the patient should be screened for contraindications to the MR examination, such as the presence of pacemakers, ferromagnetic implants, or intracranial aneurysm clips (110). Unique to the cardiac MR examination, if pharmacologic myocardial stress agents such as adenosine or dobutamine will be included in the protocol, the radiologist should also ask the patient about relative contraindications to these agents. Contraindications to adenosine include active bronchospasm, first-degree heart block, or systolic blood pressure of less than 90 mm Hg (110). Also, patients who are to receive adenosine should not ingest caffeine, chocolate, or theophylline-containing drugs 24 hours before the MR examination, as these may inhibit the effectiveness of the adenosine. Patients should also be instructed that some of the medications given during the examination may make them feel flushed or nauseated.
Image Acquisition and Technique
Cardiac Gating and Physiologic Monitoring
In the acquisition of static images, to avoid image blur, MR image acquisition must be limited to a constant portion of the cardiac cycle, usually end diastole. This is accomplished through cardiac gating. Gating can be triggered to the QRS complex of the ECG or, alternatively, to a peripheral pulse. The former is the most effective (110). The objective of ECG gating is to acquire a solid R wave. This R-wave must be larger than the T or S wave of the ECG. Indeed, if the T-wave is much larger than the R-wave, it is likely that the electrodes have been placed too medially, and the electrodes should be adjusted.
In addition, the electrodes must maintain good contact with the skin. To facilitate this, shaving the skin may be necessary. In addition, the skin can be cleaned with commercially available abrasive agents, and coupling gels can be used (110). Although a strong R-wave may be present while the patient is outside the magnet bore, as the patient enters the magnet or after MRI has started, additional noise caused by the magnetic field and the RF pulse may interfere with the ECG tracing (110). The use of newer fiberoptic leads to reduce interference or vectorcardiography-based (VCG) triggering to improve the detection of the R waves can reduce the number of misinterpreted ECG events (124). Also on the horizon is self-gated cine imaging, which uses the varying degrees of signal in the blood pool throughout the cardiac cycle as a leadless gating mechanism (79).
Physiologic monitoring of patient heart rate, blood pressure, and oxygenation is necessary during many types of cardiac MR examinations. This is especially true if the examination is being performed for assessment of cardiac ischemia or when adenosine or dobutamine is administered. MR-compatible hemodynamic monitoring systems are now available for this purpose.
Pulse Sequences
In general, pulse sequences currently used for cardiac imaging can be divided into dark blood and bright blood techniques (110). In dark blood or black blood techniques, fast-flowing blood is black or of low signal intensity. These techniques are most often used for anatomic delineation including, more recently, the assessment of vessel walls and plaque (38,52). Examples of this technique include conventional spin echo (SE), breath-hold turbo or fast-spin echo (TSE, FSE), and half-Fourier turbo-spin echo sequences with double-inversion recovery (IR) pulses to suppress blood signal (HASTE, double-IR TSE/FSE) (122).
In general, dark blood sequences are prospectively gated; thus, the effective (or total) TR should be approximately 85% to 90% of (or 100 msec less than) the patient’s R-R interval (time between R waves), placing data acquisition in end-diastole. For instance, the actual TR plus any trigger delay (TD), if necessary, will be approximately 85% to 90% of the R-R interval. Note that for T1-weighting, TR should be less than 900 ms. For double IR sequences, which are dark blood but T2-weighted, the TR should remain long and the acquisition window should cover two heartbeats (81,136).
In bright blood techniques, flowing blood is white or of high signal intensity. These are routinely gradient-recalled echo sequences (GRE). Cine GRE sequences that produce a motion picture loop throughout the various phases of the cardiac cycle are particularly useful. Currently GRE images can be obtained with segmented k-space technique and cardiac gating. A single-slice multiphase or multislice single cardiac phase mode can be performed in a short breath-hold period. Examples for various vendors include TurboFLASH (fast low-angled shot), fast SPGR (spoiled gradient recalled echo), and TFE/FFE (turbo field echo/fast field echo). The parameters for these sequences are adjusted to the patient’s breath-holding capability and heart rate. For patients with
slower heart rates, sequences that provide a greater number of lines per segment can help to shorten the required breath-hold.
slower heart rates, sequences that provide a greater number of lines per segment can help to shorten the required breath-hold.
Newer fast, short TE GRE sequences with completely refocused gradients provide excellent contrast between the myocardium and blood pool and are commercially known as TrueFISP, balanced FFE, or FIESTA (Fig. 9-7).
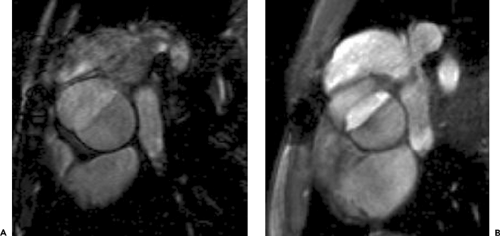
Various types of MR pulse sequences provide different information. Functional abnormalities may not be examined directly by dark blood techniques but only inferred by analysis of resultant morphologic changes (18). For example, aortic regurgitation can be inferred from the findings of an enlarged left ventricle and dilated ascending aorta. However, a cine bright blood technique with high temporal resolution would allow functional analysis, including demonstration of the regurgitant jet and quantification of aortic regurgitation. On the other hand, most cine acquisitions have lower contrast resolution resulting from the short flip angle and short TR employed. The exceptions are the completely refocused GRE sequences, which provide excellent CNR. As a result, these TrueFISP-type sequences are very useful for segmenting the myocardium from the blood pool and are excellent for functional assessment of the myocardium. Nevertheless, remember that because the TE is so short in these sequences, less dephasing occurs, decreasing the visibility of stenotic or regurgitant jets. In addition, these sequences are less useful than standard GRE cine sequences for the imaging of valve leaflets (Fig. 9-8) (106). Thus, standard GRE sequences should be used in the assessment of cardiac valve leaflets or when attempting to assess difficult-to-identify intracardiac shunts, including atrial septal or ventricular septal defects.
Cine sequences are now more commonly retrospectively ECG-gated, with the R-wave used principally as a triggering device. With these sequences the acquisition window is set to the R-R interval or to 100 ms greater than the R-R interval, depending on the technique and the vendor. Retrospective gating now applied to these sequences provides the benefit of imaging the entirety of the cardiac cycle, including the last 100 milliseconds. This type of ECG-gating is particularly useful in maintaining accuracy of measurements calculated from phase contrast cine sequences.
As a general rule, imaging should begin with dark blood sequences to obtain an overview and basic anatomic information and proceed to bright blood techniques to assess functional abnormalities.
Image Planes
The image planes as described in this section, as they relate to image acquisition, are principally for MR, because MDCT is acquired transaxially. However, given the ability of MDCT to now acquire in “four dimensions” (volumetric data acquisition of the heart throughout the cardiac cycle, permitting the creation of cine images), the information in the following sections can also be used to create MDCT cine images from the volumetric data for the visual assessment of wall and valve motion. Utility of the creation of cine CT images in multiple planes will likely improve as the technology and temporal resolution do.
The planes generally used for imaging the thorax are the three orthogonal planes of the thorax (transverse, sagittal, and coronal) with the patient supine. However, as the cardiac axes are not parallel to the body axes, sections parallel and orthogonal to cardiac axes (short axis and long axis of the heart) are favored for most cardiac imaging (20,30,113). These have the advantage of generally corresponding to the planes used with other noninvasive cardiac imaging modalities. The MR examination usually begins with a general anatomic survey using a dark blood technique in one or more of the three planes: axial, coronal, and sagittal (110).
Scout Images: Transverse or Axial Plane
The axial imaging plane is the imaging plane most familiar to the general radiologist. Most anatomic structures are easy to identify on this plane, and the overview permits assessment of adjacent thoracic pathology. Transverse or axial images (Fig. 9-9) display the normal relationships of the great vessels and cardiac chambers. Portions of the proximal coronary arteries near their origin and pericardium can also be displayed. Axial sections are especially useful in evaluating congenital heart lesions and may complement morphologic evaluation of patients with acquired heart disease.
Coronal and Sagittal Planes
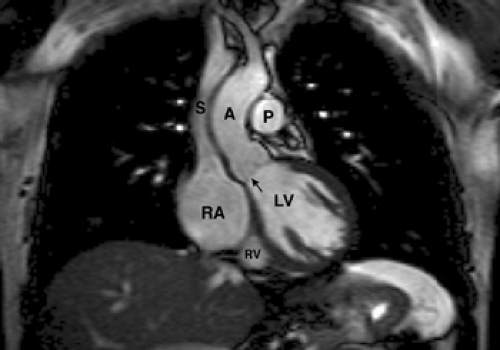
For anatomic imaging, coronal and sagittal planes can also be acquired. The coronal plane (Fig. 9-10) is often effective for demonstrating the aortic valve. More posteriorly, coronal planes show the entrance of the upper lobe pulmonary veins into the left atrium. The coronal plane is also useful for showing the diaphragmatic surface of the left ventricle and the extension of pericardium over the proximal portion of the great arteries.
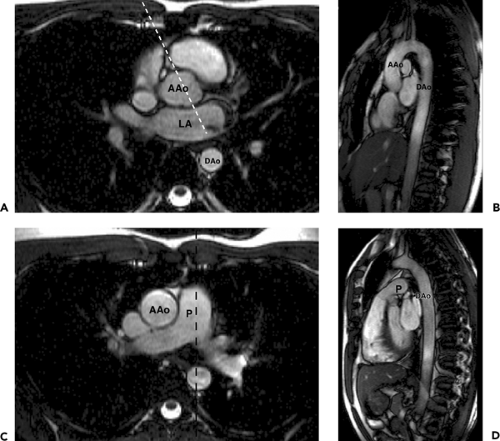
Double-oblique (oblique-sagittal) planes through the pulmonary trunk and aorta (Fig. 9-11) are useful for demonstrating the pulmonic and aortic valves and outflow tracts. Other anatomy well seen on double-oblique images includes the connections of the superior and inferior vena cavae to right atrium and one or more sinuses of Valsalva. The plane parallel to the axis of aortic arch, seen on axial
images, is used to obtain oblique-sagittal images for evaluation of aortic dissection (110).
images, is used to obtain oblique-sagittal images for evaluation of aortic dissection (110).
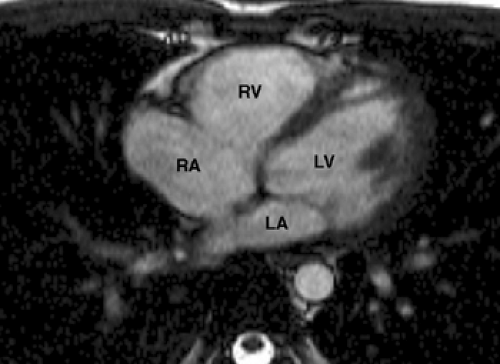 Figure 9-9 Axial TrueFISP image through the heart demonstrates the left ventricle (LV), left atrium (LA), right ventricle (RV), and right atrium (RA). |
After obtaining any desired orthogonal views, many cardiac MR studies require images parallel to the true short and long axes of the heart. Because the heart lies obliquely in the thoracic cavity, the true long axis of the heart is oriented approximately 45 degrees to the midsagittal plane of the thoracic spine. These short and long axis views of the heart are preferred for quantification of ventricular dimensions and regional contractile function (20,113). Because similar views are obtained during the ECG, these planes are often familiar to the cardiologist.
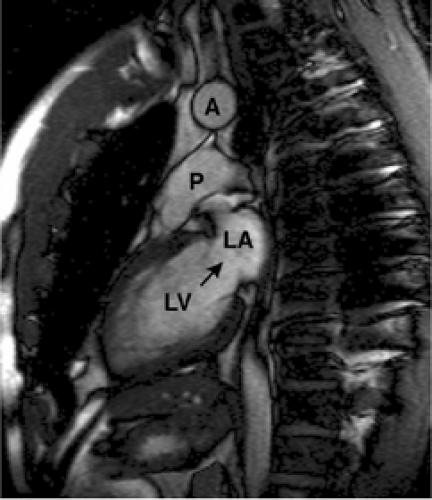
Vertical Long-Axis Plane (Two-Chamber View)
The vertical long axis plane or two-chamber view (Fig. 9-12) is used to evaluate the left heart structures. It reveals information concerning superoinferior and anteroposterior
anatomic relationships and is useful for assessing the mitral valve. This plane is prescribed from an axial image that shows the largest oblique diameter of the left ventricle (110).
anatomic relationships and is useful for assessing the mitral valve. This plane is prescribed from an axial image that shows the largest oblique diameter of the left ventricle (110).
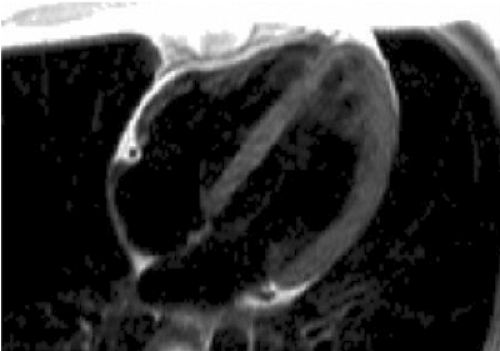
Horizontal Long-Axis Plane (Four-Chamber View)
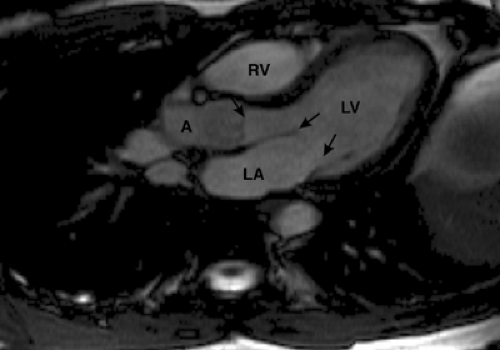
Images prescribed from the left ventricular long axis (two-chamber view), set up through the posterior wall of the left atrium, mitral valve, and left ventricular apex, provide a horizontal long axis or four-chamber view of the heart (Fig. 9-13). The horizontal long axis plane or four-chamber view displays the relationship of the four cardiac chambers to each other on a single image. Cine GRE images obtained in this plane display mitral, tricuspid, and aortic valve function as well as right and left ventricular contraction. This image plane can also be obtained by oblique transverse imaging through a short-axis scout (110).
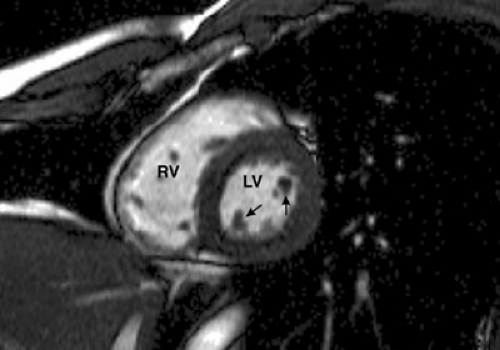
Short-Axis Plane
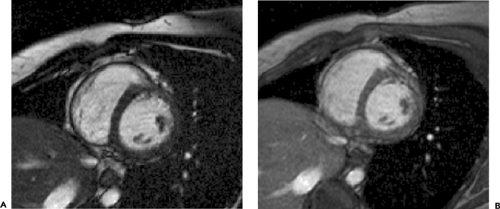
The short axis plane (Fig. 9-14) is obtained when images are prescribed perpendicular to left ventricular long axis seen on a two-chamber view. It shows the true cross-sectional dimensions of cardiac chambers. Initial images in this plane are performed through the papillary muscles, with subsequent images performed toward the heart apex and base. In this plane the left ventricular myocardium is displayed as a doughnut-shaped ring. Cine GRE images allow visualization and quantification of systolic myocardial wall thickening. This plane can also be used for quantifying left and right ventricular volume and mass, as well as ventricular ejection fraction when the appropriate software is available. Differences between right and left ventricular stroke volumes can be used to estimate valvular regurgitation or shunt ratios.
Aortic Outflow Long-Axis View
This view, obtained through the left ventricular apex and aortic outflow tract, is prescribed from a coronal image (Fig. 9-15). This plane demonstrates both the aortic and mitral valves. As it displays portions of the left ventricle, right ventricle, left atrium, right atrium, and ascending aorta, it is sometimes known as the five-chamber view.
PERFORMANCE OF SPECIFIC TYPES OF EXAMINATIONS AND INTERPRETATION
Coronary Arteries and Coronary Atherosclerotic Disease
Coronary CT Angiography
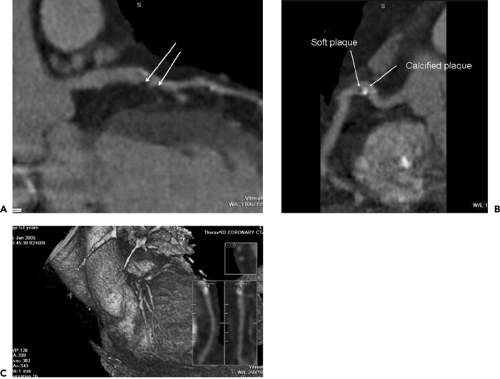
Coronary artery disease represents a significant portion of cardiovascular disease, affecting 13.2 million Americans (6). It is also the principal cause of mortality among Europeans age 65 and older (28). Coronary CT angiography, with its quick, noninvasive assessment, represents an appealing alternative to coronary x-ray angiography, particularly in patients who do not require intervention (Fig. 9-16).
Electron-beam CT was the initial modality used for the detection of stenotic lesions and occlusions in the proximal and middle segments of coronary arteries (4). Sensitivities ranged from 74% to 92% and specificities from 66% to 94% (4). One consistent limitation was that a substantial number of coronary artery segments could not be evaluated for stenosis because of insufficient image quality (4). This was, in most cases, caused either by motion or severe coronary calcifications and affected between 11% and 28% of all coronary segments (4).
Because of its modest temporal resolution, and thus extensive image blur, single-detector spiral CT was not considered an optimal modality for coronary artery assessment. However, MDCT scanners, with the improvement in temporal resolution, volumetric coverage, and their widespread availability, are now the method of choice for coronary CT imaging.
At the time this chapter was written, there were only three studies assessing coronary imaging with 64-slice MDCT (80,82,114). The first (82) studied 67 patients with suspected coronary artery disease (CAD) (47 with significant stenosis, 20 with no significant stenosis). No beta-blockers, other than those the patients were already taking, were administered and thus patients had a heart rate of 48 to 90 (mean 66.3 ± 14.7) bpm. All coronary segments of 1.5 mm or greater in diameter could be evaluated by 64-slice MDCT. Overall sensitivity, using invasive coronary angiography as the reference standard, was 94%, specificity was 97%, positive predictive value was 87%, and negative predictive value was 99%.
The second (114) studied 70 patients undergoing elective invasive coronary angiography. Patients were excluded for atrial fibrillation. Patients with heart rates above 65 bpm received 100 mg of atenolol, which allowed 77% of the patients to have a heart rate below 70 bpm. All coronary arteries, even those 1.5 mm or less in diameter, were assessed. Of 1,065 segments, 935 (88%) could be evaluated. Specificity, sensitivity, and positive and negative predictive values for the presence of significant stenoses were: by segment (n = 935), 86%, 95%, 66%, and 98%, respectively; by artery (n = 279), 91%, 92%, 80%, and 97%, respectively; by patient (n = 70), 95%, 90%, 93%, and 93%, respectively.
The third study (80) assessed 59 patients undergoing x-ray angiography for angina pectoris. Of these patients, 18 also underwent intravascular ultrasound (IVUS). Patients with heart rates greater than 70 bpm were administered 50 mg of metoprolol, resulting in a mean heart rate of 62 ± 13 bpm. Results were slightly less robust, with sensitivity for less than 50% diameter stenosis at 79%; sensitivity for greater than 50% diameter stenoses at 73%; and sensitivity for greater than 75% stenoses at 80%. Specificity for all stenoses was 97%. Compared with IVUS, 46 of 55 (84%) lesions were identified correctly. The mean plaque areas and the percentage of vessel obstruction measured by IVUS and 64-slice CT were 8.1 mm2 versus 7.3 mm2 (p <0.03, r = 0.73) and 50.4% versus 41.1% (p <0.001, r = 0.61), respectively.
A number of investigators have assessed the accuracy of MDCT for detecting coronary artery stenosis with 4-slice and 16-slice systems in comparison to invasive coronary angiography (3,11,46,53,58,70,72,76,83,91,95,96,97,99,100,101,117). Tables 9-2 and 9-3 include data of prospective, blinded studies using 16-slice MDCT. Sensitivities and specificities for the overall detection of CAD with 16-slice MDCT are shown in Table 9-2 and according to named coronary arteries in Table 9-3. Overall, the accuracy of 4- and 16-slice MDCT is excellent in assessable segments but limited if all coronary segments are considered.
TABLE 9-2 OVERALL DETECTION (PER PATIENT BASIS) OF SIGNIFICANT CAD WITH 16-SLICE CT | ||||||||||||||||||||||||||||
|---|---|---|---|---|---|---|---|---|---|---|---|---|---|---|---|---|---|---|---|---|---|---|---|---|---|---|---|---|
| ||||||||||||||||||||||||||||
Calcium Scoring
Calcifications within the coronary arteries, owing to high x-ray attenuation, should be assessed by CT without contrast enhancement. The presence of calcium is usually assumed if pixels above 130 Hounsfield units (HU) are observed within the coronary arteries (1). For quantification of coronary calcium, the Agatston score is most frequently used (5). It takes into account the area and density of the calcified lesions. Of note, however, is that both calcium volume and calcium mass have demonstrated better interscan variability (59) and may be more useful if the patient is to be repeatedly followed. Any number of commercially available workstations can be used for coronary calcium quantification (Fig. 9-17).
The presence of coronary artery calcium detected by ECT in asymptomatic individuals has a high predictive value for cardiac events and overall mortality during the following 3 to 5 years (71,121). By American Heart Association (AHA) guidelines, however, coronary calcium screening of patients with typical anginal symptoms is not recommended (134), as the accuracy of the test for predicting coronary artery stenosis is modest.
Coronary MR Angiography (MRA)
Methods
Coronary MRA methods can be classified by the problems they are designed to address or by type of imaging technique (e.g., bright blood versus black blood) (63). Techniques principally include variations of two-dimensional (2D) and 3D breath-hold or respiratory-gated sequences employing methods of epicardial fat and soft tissue suppression. A cardiac coil or a phased-array body surface coil
should be used to increase signal. In our experience, when a phased-array body surface coil is used, turning off the posterior elements permits a small field-of-view (FOV) without phase wrap. This smaller FOV often yields an increase in in-plane spatial resolution (138).
should be used to increase signal. In our experience, when a phased-array body surface coil is used, turning off the posterior elements permits a small field-of-view (FOV) without phase wrap. This smaller FOV often yields an increase in in-plane spatial resolution (138).
TABLE 9-3 SENSITIVITY AND SPECIFICITY OF 16-SLICE CT CORONARY ANGIOGRAPHY BY CORONARY ARTERY | |||||||||||||||||||||||||||||||||||||||||||||||||||||||||||||||||||||||||||||||||||||||||||||||||||||||||||||||
|---|---|---|---|---|---|---|---|---|---|---|---|---|---|---|---|---|---|---|---|---|---|---|---|---|---|---|---|---|---|---|---|---|---|---|---|---|---|---|---|---|---|---|---|---|---|---|---|---|---|---|---|---|---|---|---|---|---|---|---|---|---|---|---|---|---|---|---|---|---|---|---|---|---|---|---|---|---|---|---|---|---|---|---|---|---|---|---|---|---|---|---|---|---|---|---|---|---|---|---|---|---|---|---|---|---|---|---|---|---|---|---|
| |||||||||||||||||||||||||||||||||||||||||||||||||||||||||||||||||||||||||||||||||||||||||||||||||||||||||||||||
Stay updated, free articles. Join our Telegram channel

Full access? Get Clinical Tree


