Fig. 1.1
An example of one of Wild and Reid’s original echographs, pictured above, was used to measure skin thickness as compared to breast cancer tissue thickness to determine a diagnosis of breast cancer [22]. Reproduced with permission from Hill CR, Early days of scanning: Pioneers and Sleepwalkers, in Radiography. 2009 (15): p. 15–22, courtesy of Elsevier
Following the post-World War II resurgence of interest in cardiac surgery, Inge Edler and Hellmuth Hertz began to investigate noninvasive methods of detecting mitral stenosis, a disease with relatively poor results at the time. Using an ultrasonic reflectoscope with tracings recorded on slowly moving photographic film designed by Hertz (see Fig. 1.2), they were able to capture moving structures within the heart. Dubbed “Ultrasound Cardiography,” this represented the first echocardiogram, which was capable of differentiating mitral stenosis from mitral regurgitation, and detecting atrial thrombi, myxomas, and pericardial effusions [23, 24].
Fig. 1.2
The first echocardiographic recording is displayed as a “motion-mode,” or M-mode, tracing displaying ultrasonic tracings of the left ventricular posterior wall [24]. Reproduced with permission from Fraser, A.G., Inge Edler and the origins of clinical echocardiography. Eur J Echocardiogr, 2001. 2(1): p. 3–5, courtesy of Oxford University Press
With the support of the Veterans Administration and United States Public Health Service, Holmes et al. described the use of ultrasound to detect soft tissue structures with an ultrasonic “sonascope.” This consisted of a large water bath in which the patient would sit, a sound generator mounted on the tub, and an oscilloscope which would display the images. The sonascope was capable of identifying a cirrhotic liver, renal cyst, and differentiating veins, arteries, and nerves in the neck. Consistent with the results of their predecessors, however.
The use of ultrasound in obstetrics and gynecology began in 1954 when Ian Donald became interested in the use of A-mode, or amplitude-mode , which uses a single transducer to plot echoes on a screen as a function of depth; one of the early uses of this was to differentiate solid from cystic masses. Using a borrowed flaw-detector, he initially found that the patterns of the two masses were sonically unique. Working with the research department of an atomic boilermaker company, he led a team that developed the first contact scanner. Obviating the need for a large water bath, this device was hand-operated and kept in contact with skin and coupled with olive oil. Captured on Polaroid® film with an open shutter, abdominal masses could be reliably and reproducibly differentiated using ultrasound. Three years later, Donald collaborated with his team of engineers to develop a means to measure distances on the output on a cathode ray tube, which was subsequently used to determine fetal head size [13, 25–27].
History of Doppler Ultrasound
In 1842, Christian Johann Doppler theorized that the frequency of light received at a distance from a fixed source is different than the frequency emitted if the source is in motion [28]. More than 100 years later, this principle was applied to sound by Satomura in his study on cardiac valvular motion and peripheral blood vessel pulsation [29]. In 1958, Seattle pediatrician Rushmer and his team of engineers further advanced the technology with their development of transcutaneous continuous-wave flow measurements and spectral analysis in peripheral and extracranial brain vessels [30]. Real-time imaging—developed in 1962 by Homes—was born out of the principal of “compounding,” which allowed the sonographer to sweep the transducer across the target to continuously add information to the scan; the phosphordecay display left residual images from the prior transducer position on the screen, allowing the entire target to be visualized [13]. The first commercially available real-time scanner was produced by Siemens, and its first published use was in the diagnosis of hydrops fetalis [31, 32].
Bernstine and Callagan were the first to report the obstetric utility of Doppler in their 1964 report on ultrasonic detection of fetal heart movement, thus laying the foundation for continuous fetal monitoring [33]. The same year, Buschmann was the first report “carotid echography ” for the diagnosis of carotid artery thrombosis [34], although debate ensued as to whether ultrasound was capable of identifying the carotid bifurcation or its branches into the internal and external carotid arteries [35–37].
In 1966, Kato and Izumi developed directional Doppler that was capable of determining direction of flow [32, 38]. The following year, McLeod reported similar findings using phase shift in the United States [30, 39, 40]. By 1967, the use of Doppler ultrasound had spread to Europe, where continuous-wave ultrasound (which does not allow precise spatial localization) was being used to diagnose occlusive disease of neck and limb arteries, venous thrombosis, and valvular insufficiency with accuracy [41]. Pulsed Doppler soon provided the capability of sampling specific Doppler signals in target tissues, a function that quickly became clinically applicable in the detection of valvular motion and differential flow rates within the heart [42].
The addition of color flow mapping to Doppler ultrasound allowed real-time mapping of blood flow patterns [43]. The limitations of color flow, including angle dependence and difficulty assessing flow in slow-flow states, were soon appreciated. These were overcome with the advent of an alternative form of Doppler, termed “Power Doppler.” This alternative to routine color flow was found to be useful in confirming or excluding difficult cases of testicula r or ovarian torsion and vascular thrombosis [44].
Researchers next turned their attention to techniques to improve the clarity and reduce artifact within ultrasound-guided images. In 1980, real-time compound sonography was developed by using the probe to obtain multiple images from different viewing angles. Computed beam steering technology is then used to combine multi-planar images into one compound image in real time. Summation of these images reduced artifact and improved delineation of surfaces. This technique was expanded from linear array to curved array transducers, making it more accessible for abdominal and pelvic imaging. Now, compound sonography is used for musculoskeletal, vascular, hepatobiliary, and pelvic imaging [45].
In 1989, Baba and colleagues reported on the first production of a three-dimensional ultrasonic image. Using a real-time straight or curved transducer, they were able to obtain positional information with an ultrasound device that was connected to a microcomputer, which reconstructed the data into a three-dimensional output. The authors hypothesized that this system would be ideal for the screening of fetal anomalies and abnormalities in intrauterine growth [44]. Following the development of von Ramm’s three-dimensional ultrasound device, Sheikh et al. published the first use of real-time three-dimensional acquisition and presentation of data in the United States in 1991. This proved to be useful in cardiology for assessment of perfusion and ventricular function [46].
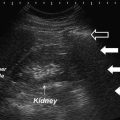
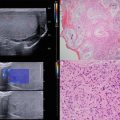
In 1996, several authors including Burns et al. began exploring the realm of tissue harmonic sonography (see Fig. 1.3) as a means to overcome image degradation [45, 47]. During the initial investigation, the authors explored microbubble ultrasound contrast media to improve contrast agent-specific images, with the result that the harmonic signal was stronger from the microbubbles than the signal from tissue. Now, harmonic mode has developed as a gray scale ultrasound mode that employs echoes at twice the transmitted frequency. This technique has resulted in improved image clarity and decreased artifact, and has proven invaluable in diagnosis of pathology in the hepatobiliary tree and genitourinary tract, most importantly in determining distinguishing characteristics of cystic and solid lesions.
Fig. 1.3
Here, a fundamental mode image of the kidney reveals a focal contour of an abnormality seen in the lower pole, while the harmonic mode image, to the right, reveals that the lesion is solid in nature [47]. Reproduced with permission from Desser, T.S., et al., Tissue Harmonic Imaging Techniques: Physical Principles and Clinical Applications. Seminars in Ultrasound, CT, and MRI. 2001. 22 (1): 1–10, courtesy of Elsevier
Electronic steering of the ultrasound beam is the process of using parallel beams oriented along multiple directions from an array transducer along different directions. This is also referred to as multibeam imaging. The arrays obtained from each direction are compounded into a single image, which increases the lateral resolution and reduces the noise levels [48].
History of Ultrasound in Urology
Prostate
In 1963, Japanese Urologists Takahashi and Ouchi became the first to attempt ultrasonic examination of the prostate. However, the image quality that resulted was not interpretable and thus carried little medical utility [49]. Wild and Reid also attempted transrectal ultrasound, but were met with the same result. Progress was not made until Watanabe et al. demonstrated radial scanning that could adequately identify prostate and bladder pathology. Using a purpose-built device modeled after a museum sculpture entitled “Magician’s Chair,” Watanabe seated his patients on a chair with a hole cut in the center such that the transducer tube could be passed through the hole and into the rectum of the seated patient [50]. Images from Watanabe’s seated probe are displayed in Fig. 1.4a; it is evident in Fig. 1.4b (demonstrating an area of circumscribed symmetric echogenicity, representing BPH) and Fig. 1.4c (demonstrating an asymmetric area of hyperechogenicity, representing prostate cancer) that resolution was poor and images displayed extreme contrast. Subsequent development of biplane, high frequency probes has created increased resolution and has allowed for transrectal ultrasound to become the standard for diagnosis of prostatic disease.
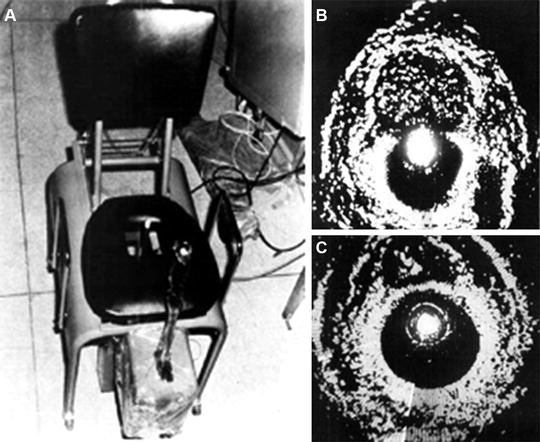
Fig. 1.4
(a) Images from Watanabe’s seated probe are displayed [50], revealing (b) an area of circumscribed symmetric echogenicity, representing BPH, (c) an asymmetric area of hyperechogenicity, representing prostate cancer. In these images, note that resolution was poor, and images displayed extreme contrast. Reproduced with permission from Watanabe, H., et al., Development and application of new equipment for transrectal ultrasonography. J Clin Ultrasound, 1974. 2(2): p. 91–8, courtesy of John Wiley and Sons
In 1974, Holm and Northeved introduced a transurethral ultrasonic device that would be interchangeable with conventional optics during cystoscopy for the purpose of imaging the prostate and bladder. Their other goals for this device included the ability to determine depth of bladder tumor penetration, prostatic volume, evaluation of prostatic tumor progression, and to assist with transurethral resection of prostate [51].
More recently, several other techniques have come to light in the diagnosis of prostate cancer.
The concept of multiparametric MRI , in which MRI images are electronically superimposed in real time on transrectal ultrasound (see Fig. 1.5), has further revolutionized the ability to detect high-risk prostate cancer [52].
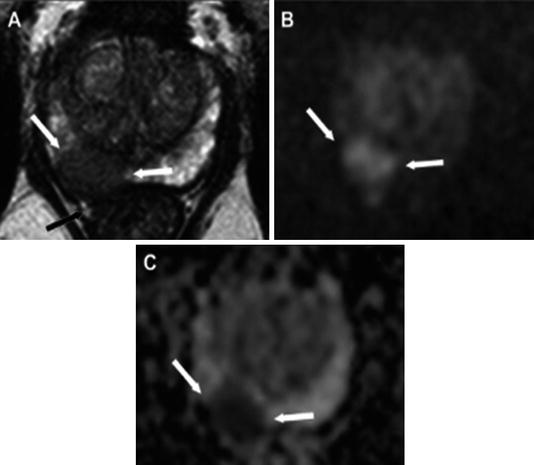
Fig. 1.5
In this example, a multiparametric MRI, T2 weighted, was obtained and outlines a suspicious lesion. (a) A hypointense lesion in the right peripheral zone of the prostate is noted with extracapsular extension. The lesion is hyperintense on DWI imaging. (b) A TRUS-guided biopsy, performed with the ADC map shown here (c), revealed Gleason grade 9 (4 + 5) disease in this patient [53]. Reproduced with permission from Oliveira Neto JA, Parente DB. Multiparametric Magnetic Resonance Imaging of the Prostate. Magnetic Resonance Imaging Clinics of North America. 2013 (21): p. 409–26, courtesy of Elsevier
Histoscanning has also been used to more accurately define prostatic lesions. This involves three steps: a motorized transrectal ultrasound, a software analysis to define the region of concern, and a color-coded analysis of tissue detailing all region suspicion [54].
Finally, sonoelastography , a technique for assessing tissue elasticity to distinguish cancer tissue from prostate parenchyma, has been shown to improve detection rates when ultrasound-guided biopsies alone are insufficient to define the target [55]. A sensitivity of 0.81, specificity of 0.69, and accuracy of 0.74 for detection of prostate cancer were found by Boehm et al. [56], which is similar to that of MRI.
Kidney
In 1971, Goldberg and Pollack, frustrated with the inability of IVP to differentiate benign from malignant lesions, turned to A-mode ultrasound. In their report on “nephrosonography,” they demonstrated in a series of 150 patients the capability of ultrasound to discern solid, cystic, and complex masses with an accuracy of 96 %. The diagrammatic representation of the three ultrasound patterns they found is depicted in Fig. 1.6 [57]. In cystic lesions, the first spike represents the striking of the front wall of the cyst and the second spike represents the striking of the back wall. More complex lesions therefore have return of more spikes.
Fig. 1.6
This is a diagrammatic representation of the three types of ultrasound patterns obtained from masses. In this way, ultrasound has been able to distinguish the differences between the solid, cystic, and necrotic masses (a mixture of solid and cystic masses) [57]. Reproduced with permission from Goldberg, B.B. and H.M. Pollack, Differentiation of renal masses using A-mode ultrasound. J Urol, 1971. 105(6): p. 765–71, courtesy of Elsevier
Scrotum
Perri et al. were the first to use Doppler as a sonic “stethoscope” in their workup of patients with an acute scrotum. While they were able to identify patients with epididymitis and torsion of the appendix testis as having increased flow, and patients with spermatic cord torsion as having no blood flow, they also reported that false negatives in cases of torsion could result from increased flow secondary to reactive hyperemia [58, 59].
Related posts:

Stay updated, free articles. Join our Telegram channel

Full access? Get Clinical Tree


