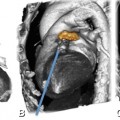
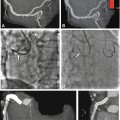
Fig. 20.1
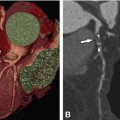
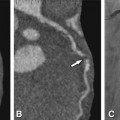
Illustration of the approach to cardiac fusion with software (CardIQ Fusion, Advantage Workstation, GE Healthcare). (Panels A–D) Image coregistration. This first step is crucial and allows the user to align the often times imperfect correlation (Panels A and C) on images in three dimensions in order to obtain optimal matching of structural and functional information (Panels B and D). (Panel E) Definition of left ventricular epicardium. This protocol displays a view containing the segmented CT left ventricular epicardium using conventional volume-rendering technique, allowing addition or removal of structures from the left ventricular epicardium if needed. Every voxel of the volume has an opacity value and a color. The opacity ramp is based on the Hounsfield units of the CT data. The color of the surface is generated based on the perfusion information. In each point of the surface of the volume-rendered image the color is computed as being the maximum perfusion intensity on a ray going from the particular point to the centre of the heart on CT. (Panels F and G) 3D volume-rendered fusion images. As the final step, the hybrid display protocol renders a volume containing the left ventricular epicardial volume, the volume-rendered coronary tree, and the left and right heart chambers acquired by an automatic segmentation algorithm (With permission of Springer from Gaemperli et al. Eur J Nucl Med Mol Imaging (2007)
20.2.3 Software
Dedicated software packages are available from different manufacturers that allow fusion of CTA and radionuclide images (CardIQ Fusion, Advantage Workstation, GE Healthcare; HeartFusion application, Emory University, Atlanta, Georgia; Fig. 20.1). A crucial element is a user interface that permits to correct misalignment between datasets. The remaining fusion steps include tracking of the coronary arteries (by methods similar to standard CTA software) and modeling of the perfusion data into a 3D volume-rendering of the left ventricle. Current software packages allow fusion of images from different modalities and even different manufacturers. In experienced hands and with image datasets of reasonable quality, the image fusion process takes no longer than 5 min per patient.
20.2.4 Hybrid Versus Stand-Alone Scanners
The increasing global interest in hybrid imaging from a variety of medical specialties has prompted manufacturers to launch a number of hybrid imaging devices. The best example is the increasing use of hybrid PET/CT scanners for staging of neoplastic disease. The success of PET/CT in oncology has set the stage for a wide dissemination of such hybrid devices and has extended onto other domains. As a result, similar hybrid devices combining SPECT cameras with high-end CT devices and recently also first experimental hybrid PET/MR have been released (Fig. 20.2).


Fig. 20.2
Patient with an acute myocardial infarction after successful revascularization of the right coronary artery undergoing integrated PET/MRI. Fasting 18FDG PET shows focal accumulation in the inferior wall (arrow in Panel A) with matching diffuse late enhancement on MRI (arrow in Panel B) and severely reduced PET perfusion (arrow in Panel C). In addition, there is a chronic infarct of the lateral wall seen by thinning of the myocardium and late enhancement on MRI (arrowhead in Panel B) with corresponding absent perfusion on 13NH3 PET (arrowhead in Panel C). Although the diagnostic and prognostic impact of hybrid PET/MRI needs to be defined in larger cohorts, this example demonstrates its clinical feasibility (Courtesy of S. Nekolla and C. Rischpler, Munich)
Nonetheless, it should be emphasized, that in the setting of cardiac hybrid imaging the use of hybrid scanners is not necessarily required, and less crucial than for oncology rectilinear PET/CT. In the latter case, image fusion is accomplished through rapid automated fusion of sequential PET and CT images as the patient is lying still and moved from the PET to the CT gantry. However, in cardiac hybrid imaging, manual superimposition and individual correction of dataset misalignment is crucial to ensure adequate quality for several reasons: cardiac and respiratory motion, intrinsic disagreement in the size and shape of the left ventricle between nongated SPECT images and diastole-gated CTA, 3D instead of cross-sectional display of fused datasets. Therefore, cardiac hybrid imaging can easily be performed by acquiring datasets on standalone scanners with subsequent software-based fusion, and in fact this set-up may allow exploiting the full capacity of the respective scanners for all kinds of medical purposes rather than having a highly dedicated hybrid device.
20.2.5 Tips
A number of recommendations that should be considered for successful hybrid imaging are summarized in List 20.1.
List 20.1. Recommendations for hybrid imaging
2.
Fusion of image datasets with a dedicated cardiac fusion software allowing for manual coregistration and correction of dataset misalignment (Fig. 20.1)
3.
Perform the perfusion SPECT or PET first as the administration of pre-scan beta-blockers for CTA may otherwise mask small perfusion defects
4.
If CTA is performed first with pre-scan administration of intravenous beta blockers, postpone the SPECT study to the following day
5.
A hybrid scanner equipped with a high-end CT is desirable as it improves patient comfort and speeds up the total examination
6.
Image acquisition is perfectly feasible on standalone scanners, and this approach may be preferable if the scanners are run for other (non-cardiac) examinations
20.3 Clinical Data
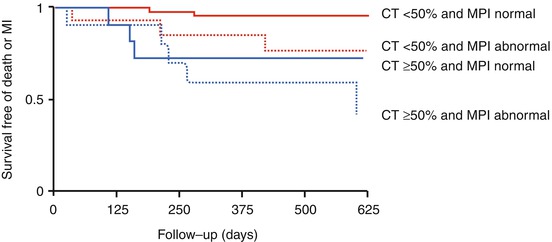
A number of small single-center trials assessing the diagnostic accuracy of cardiac hybrid imaging are available and are summarized in Table 20.1. Overall, the diagnostic accuracy of hybrid imaging is very high with a sensitivity, specificity, positive and negative predictive value of 88–96%, 92–100%, 77–97%, and 97–99%, respectively. However, a number of limitations apply to these early pilot studies such as the small sample sizes, the heterogeneity of hybrid systems, the varying gold-standard (invasive coronary angiography alone or in combination with SPECT or FFR, and the single-center design. There is also evidence of an incremental prognostic value from combining functional and anatomic information by SPECT and CTA (Fig. 20.3). Larger multi-center trials such as the prospective multimodality European EVINCI study are awaited to confirm these preliminary results.
Table 20.1
Added diagnostic accuracy of cardiac hybrid imaging (SPECT/CTA and PET/CTA) (Vessel-based analysis)
Author | Hybrid system | N | Gold standard (definition of significant CAD) | Sens | Spec | PPV | NPV |
|---|---|---|---|---|---|---|---|
Namdar et al. (2005) | 13N-NH3 PET/4-slice CTA | 25 | Flow-limiting coronary stenosesrequiring revascularization(ICA + PET) | 90 | 98 | 82 | 99 |
Rispler et al. (2007) | SPECT/16-slice CTA | 56 | Flow-limiting coronary stenoses(>50% stenosis on ICA + SPECT pos.) | 96 | 95 | 77 | 99 |
Groves et al. (2009) | 82Rb PET/64-slice CTA | 33 | >50% stenosis on ICA | 88 | 100 | 97 | 99 |
Sato et al. (2010) | SPECT/64-slice CTAa | 130 | >50% stenosis on ICA | 94 | 92 | 85 | 97 |
Kajander et al. (2010) | 15O-H2O PET/64-slice CTA | 107 | Flow-limiting coronary stenosis(>50% stenosis of ICA + FFR) | 93 | 99 | 96 | 99 |

