CHAPTER 8 Identifying Bone Metastases
The most common site of distant metastasis from breast cancer is bone. In a study of almost 600 patients dying of breast cancer, Coleman and Rubens found that 69% had radiologic evidence of bone metastases before death.1 These results antedated use of fluorodeoxyglucose (FDG) positron emission tomography (PET), suggesting the true incidence might be even higher. Bone metastases in breast cancer may be osteolytic, osteoblastic, or mixed blastic and lytic. This feature accounts for the variable sensitivity and specificity of different imaging modalities.2 Of interest is that patients with blastic (versus osteolytic) bone metastases have been reported to have prolonged survival.3
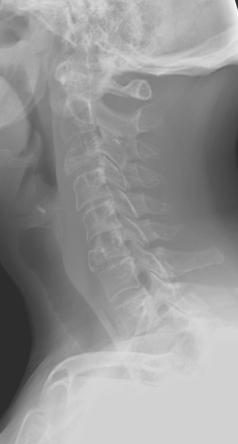
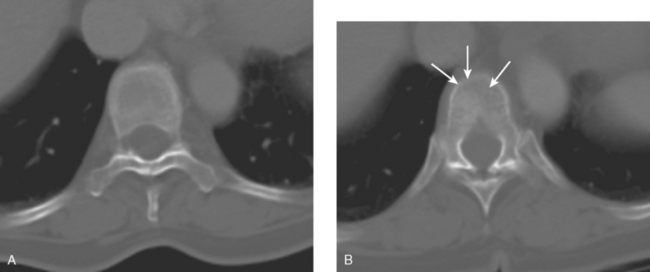
Plain radiographs require 30% to 50% loss of bone mineral to visualize a metastasis.4 Most breast cancer bone metastases demonstrate areas of lysis and sclerosis. Lesions can be permeative, moth-eaten, or geographic (Figure 1). Permeative and moth-eaten lesions predominate, whereas geographic lesions, exhibiting a sharp delineation between normal and abnormal bone, typically reflect a less aggressive metastasis.5 Advantages of plain radiography include widespread availability, minimal imaging time, absence of patient preparation, favorable radiation dosimetry, and relatively low cost. Based on the higher sensitivity of nuclear medicine bone scintigraphy, as well as its ability to survey the whole body, plain radiographs are now typically used to add specificity or to clarify bone scan findings.
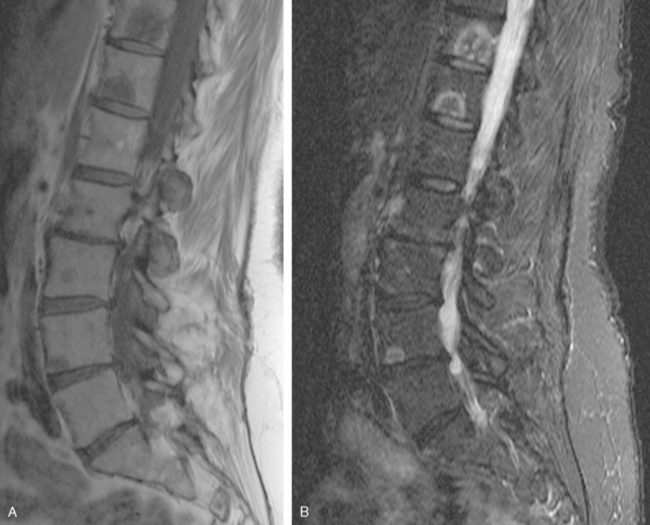
CT and MRI offer superb spatial resolution combined with excellent specificity. Nearly 50% of patients who are identified as having bony metastases on scintigraphy with negative plain radiographs will have detectable lesions on CT.6 Additionally, CT and MRI may be quite helpful in determining the etiology of bone pain (e.g., concomitant fracture, arthritis, soft tissue pathology). These modalities are preferred to answer questions related to a specific area (e.g., CT for ribs, MRI for vertebral column) (Figure 2). However, the nuclear medicine bone scan remains the procedure of choice for whole-body screening.7,8
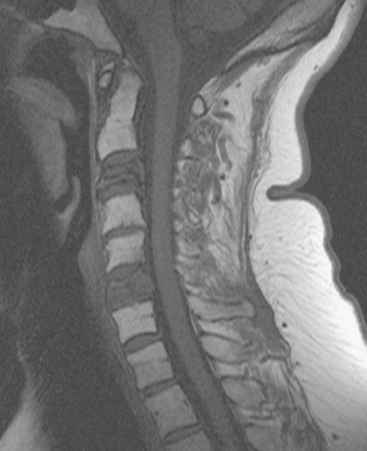
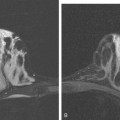
FIGURE 2 Same patient as in Figure 1. Sagittal T1-weighted, cervical spine MRI shows replacement of normal bright, fatty marrow signal in the C3 and C6 vertebral bodies, which show loss of height and end-plate invagination. The uniformly bright marrow signal elsewhere in the spine reflects prior radiation therapy.
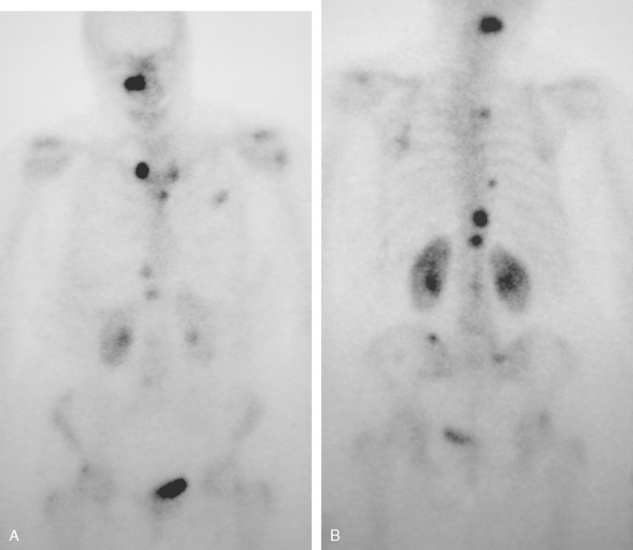
Bone scintigraphy has withstood the test of time and is very sensitive in identifying areas of osteoblastic change. Findings on scintiscan may antedate findings on plain radiographs by many months. The bone scan is widely available, requires minimal patient preparation (increased fluid intake is recommended), delivers low radiation, and is cost effective. Disadvantages include reduced sensitivity in the vertebral column (improved with the use of single-photon emission computed tomography, or SPECT), significantly reduced sensitivity for purely osteolytic lesions, and suboptimal specificity. Routine bone scanning in patients with early-stage breast cancer, in the absence of symptoms, is not recommended.9
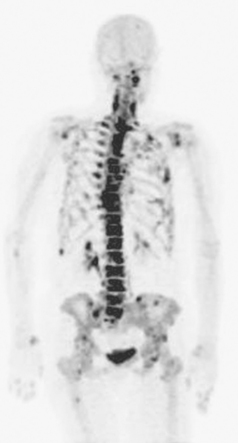
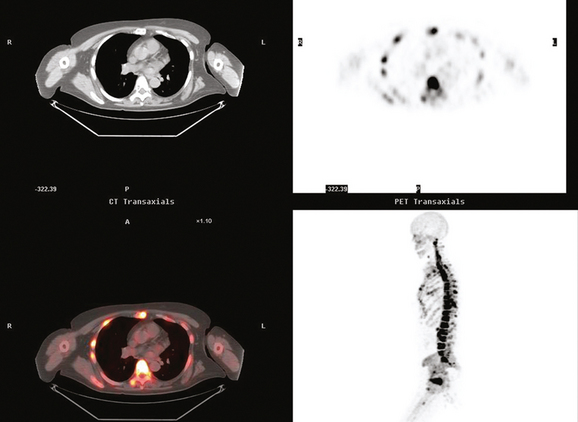
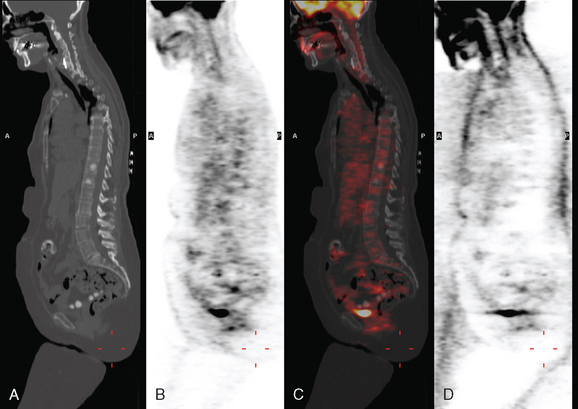
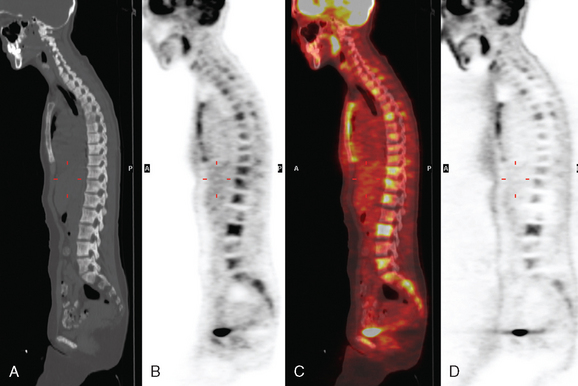
Bone scanning can also be performed with the positron emitter 18F sodium fluoride (NaF). Schirrmeister has published extensively on the use of 18F sodium fluoride and has shown high sensitivity and specificity in multiple tumor types, including breast.10–14 Compared with 99mTc-labeled polyphosphonates, 18F sodium fluoride shows about twice the uptake as well as a significantly improved target-to-background ratio. Current PET and PET/CT scanners provide improved sensitivity, higher spatial resolution, and tomographic capability (Figures 3 and 4).
Uptake of NaF is not tumor specific. Therefore, both benign and malignant lesions will demonstrate NaF uptake. Current PET/CT scanners, with improved spatial resolution and precise anatomic localization of lesions, result in better differentiation of benign from malignant lesions.14
There does not appear to be enough scientific data or clinical experience to recommend the routine use of NaF bone scintigraphy over FDG PET or bone scintigraphy. NaF may be helpful in selected patients; however, FDG PET is an accepted modality for use as a whole-body screen, can reliably detect primary tumors, and allows accurate assessment of soft tissue metastases.15–17
18F fluorodeoxyglucose (FDG) is the current radiopharmaceutical of choice for PET imaging in cancer. FDG enters tumor cells via glucose transporter proteins on the cell membrane and, once intracellular, is trapped. Uptake of FDG in bone metastases is incompletely understood; however, it has been shown that uptake in osteolytic metastases may be up to 7 times higher than osteoblastic metastases.18 Blastic metastases may not be demonstrated on FDG PET (Figure 5). Most studies comparing bone scintigraphy and FDG PET suggest an advantage for FDG PET with respect to osteolytic metastases and specificity. Bone scintigraphy appears to be more sensitive for osteoblastic lesions, and the two studies are best viewed as complementary.
An important area of bone metastases is the spinal column. A patient’s quality of life can be dramatically affected by metastases to the spine.19 Available imaging modalities include plain radiography, MRI, and CT. PET/CT has gained popularity because of its ability to combine metabolic and anatomic data. Frontal, lateral, and dynamic plain films (e.g., flexion and extension views) are helpful in identifying instability. Neural compression is best evaluated with MRI. The presence and extent of metastases are well delineated by altered signal within bone. Bony anatomy is best defined by thin-section axial CT. Contrast enhancement is helpful in enhancing tumor visualization and more clearly defining neural compression.
1 Coleman RE, Reubens RO. The clinical course of bone metastases from breast cancer. Br J Cancer. 1987;55:61-66.
2 Even-Sapir E. Imaging of malignant bone involvement by morphologic, scintigraphic, and hybrid modalities. J Nucl Med. 2005;46:1356-1367.
3 Yamashita K, Koyama H, Inaji H. Prognostic significance of bone metastasis from breast cancer. Clin Orthop. 1995;312:89-94.
4 Edelstyn GA, Gillespie PJ, Grebell FS. The radio-logical demonstration of osseous metastases: experimental observations. Clin Radiol. 1967;18:158-162.
5 Wittig JC, Lamont JG. Bone metastases from breast cancer. In: Roses DF, editor. Breast Cancer. Phil-adelphia: Elsevier Churchill Livingstone; 2005:666-675.
6 Muindi J, Coombes RC, Golding S, et al. The role of computed tomography in the detection of bone metastases in breast cancer patients. Br J Radiol. 1983;56:233-239.
7 Hamaoka T, Madewell JE, Podoloff DA, et al. Bone Imaging in metastatic breast cancer. J Clin Oncol. 2004;22:2942-2953.
8 Love C, Din AS, Tomas MB, et al. Radionuclide bone imaging: an illustrative review. RadioGraphics. 2003;23:341-358.
9 Yeh KA, Fortunato L, Ridge JA, et al. Routine bone scanning in patients with T1 and T2 breast cancer: a waste of money. Ann Surg Oncol. 1995;2:319-324.
10 Schirrmeister H, Guhlmann CA, Elsner K, et al. Planar bone imaging vs 18 F-PET in patients with cancer of the prostate, thyroid and lung. J Nucl Med. 1999;40(10):1623-1629.
11 Schirrmeister H, Guhlmann CA, Kotzerke J, et al. Early detection and accurate description of extent of metastatic bone disease in breast cancer with 18F-fluoride ion and positron emission tomography. J Clin Oncol. 1999;17(8):2381-2389.
12 Schirrmeister H, Glatting G, Hetzel J, et al. Prospective evaluation of the clinical value of planar bone scans, SPECT and F-18 labeled NaF PET in newly diagnosed lung cancer. J Nucl Med. 2001;42(12):1800-1804.
13 Schirrmeister H. Detection of bone metastases in breast cancer by positron emission tomography. PET Clinics: Breast Cancer. 2006;1(1):25-32.
14 Schirrmeister H, Diedrichs CG, Rentschler M, et al. Positron-emission tomography of the skeletal sys-tem using 18-F Na: the incidence, pattern of the findings and distribution of benign changes. Fortschr Rontgenstr. 1998;169(3):310-314. (in German)
15 Crippa F, Agresti R, Seregni E, et al. Prospective evaluation of fluorine–18-FDG PET in presurgical staging of the axilla in breast cancer. J Nucl Med. 1998;39(1):4-8.
16 Moon DH, Maddahi J, Silverman DHS, et al. Accuracy of whole body fluorinie-18 FDG PET for the detection of recurrent or metastatic breast carcinoma. J Nucl Med. 1998;39(3):431-435.
17 Even-Sapir E, Mester U, Flusser G, et al. Assessment of malignant skeletal disease: initial experience with 18F-fluoride PET/CT and comparison between 18F-fluoride PET and 18F-fluoride PET/CT. J Nucl Med. 2004;45(2):272-278.
18 Cook GJ, Houston S, Rubens R, et al. Detection of bone metastases in breast cancer by 18 FDG PET: differing metabolic activity in osteoblastic and osteolytic lesions. J Clin Oncol. 1998;16(10):3375-3379.
19 Douglas AF, Cooper PR. Spinal column metastases from breast cancer. In: Roses DF, editor. Breast Cancer. Philadelphia: Elsevier Churchill Livingstone; 2005:644-652.
CASE 1 Stage IV presentation of breast cancer with bone metastases
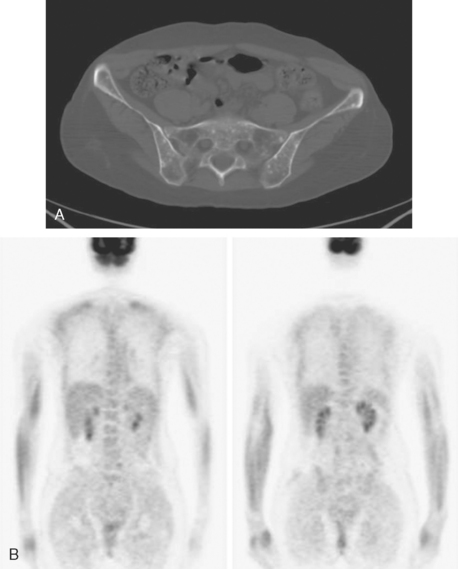
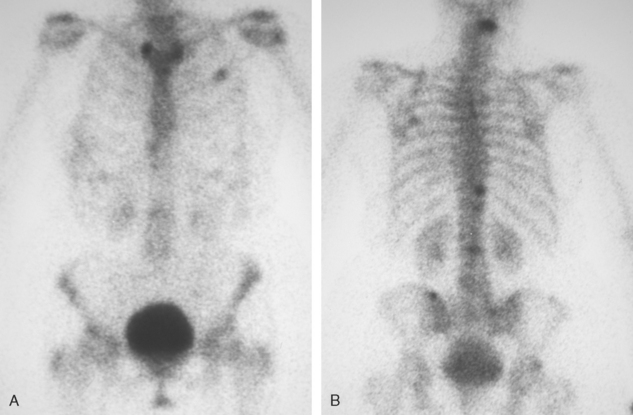
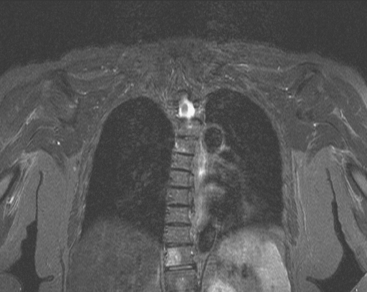
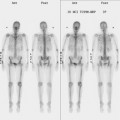
A 60-year-old woman presented with a large, palpable right breast mass (same patient as in Case 19 in Chapter 4). Imaging workup, including mammography, ultrasound, breast MRI, and ultrasound-guided core needle biopsy and axillary lymph node aspiration, confirmed node-positive multifocal infiltrating ductal carcinoma (IDC). Based on physical examination, the patient was thought to have an advanced breast cancer, at least T3 by size, and she was started on neoadjuvant chemotherapy while her staging workup was completed. The staging evaluation included a bone scan and positron emission tomography (PET)/CT. The bone scan, obtained before starting chemotherapy, showed several foci of increased activity, including in the left anterior third rib, one focus each in the cervical and thoracic spine, and a focus at the left upper sacroiliac joint region (Figure 1). A breast MRI, obtained a few days after the first round of chemotherapy, included a coronal short tau inversion recovery (STIR) series of the thorax, obtained with the body coil. This showed evidence of widespread bone metastases, with hyperintense foci in the right medial clavicle and in a lower thoracic vertebral body (Figure 2). A PET/CT scan was performed about 1 week after the first cycle of chemotherapy. In addition to showing hypermetabolism of the multifocal breast carcinoma, hypermetabolic foci were identified in multiple bony sites, including the right clavicular head, right upper cervical spine, two adjacent lower thoracic vertebrae, the left medial iliac crest, and a left anterior rib (Figure 3). These sites of abnormal activity overlapped in distribution with the abnormalities noted previously on limited chest MRI and the prechemotherapy bone scan. No definite correlates were found at these sites on CT. Thus, as the staging was completed in this patient, it became apparent that what was initially thought to be T3N1 disease (stage IIIA) was actually stage IV disease.
After one cycle of chemotherapy, CT scanning was repeated. The large breast mass and axillary adenopathy showed improvement, and new sclerosis was now evident at several levels in the spine (Figure 4).
Before undergoing repeat bone scanning and spine MRI, a second cycle of chemotherapy was given. The repeat bone scan, obtained 1 month after the prechemotherapy study, showed an increase in number of foci of increased activity (Figure 5). Several preexisting foci of activity appeared larger and more intensely active. MRI of the lumbar spine showed multiple areas of abnormal signal intensity, at levels corresponding to the prior bone and PET scans (Figure 6).
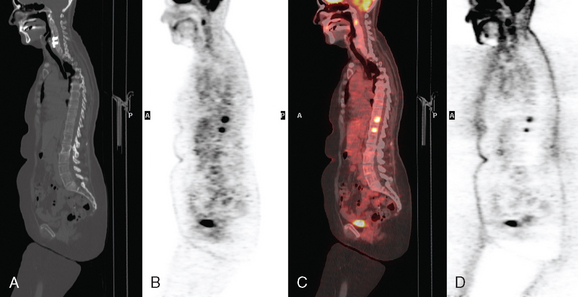
Two weeks after surgery, CT-guided sampling of the sclerotic T11 lesion was performed and did not confirm metastatic disease. The needle biopsy was repeated 2 months later, confirming metastasis. A nearly concurrent repeat PET/CT for restaging had normalized (Figure 7).
TEACHING POINTS
The initial bone scan, obtained before starting chemotherapy, was abnormal, although not definitively diagnostic of bone involvement. Without imaging correlation, provided subsequently by a limited chest MRI, a number of the bone scan findings could have been accounted for by other explanations. The rib lesion, for example, could have been post-traumatic, and a possible trauma history was elicited from the patient. The activity is less punctate than generally seen with fractures, but a long segment of involvement, which would more compellingly suggest neoplasia, is not seen either. The patient had had prior cervical spine surgery, raising the possibility of accelerated de-generative change at an adjacent level. At the same time, the activity in both the cervical and thoracic levels is disturbingly focal and relatively intense. Degenerative findings frequently involve multiple adjacent levels and, unless actively degenerating, are often less intense in activity than the findings seen here.
What is the significance of the apparent increase in disease seen on the second bone scan, performed 1 month later, after two cycles of chemotherapy? Does this mean the metastases are progressing? Not necessarily. In fact, the changes we see between these two bone scans are an excellent example of the flare phenomenon, whereby a patient responding to hormonal therapy or chemotherapy may actually appear worse on bone scanning. Increased activity of previously identified lesions and even new lesions may be seen (as in this case). Recall that it is the osteoblastic response to a bone abnormality (neoplastic, infectious, or traumatic) that we see as an increase in activity on a bone scan. Metastases that are initially lytic may become sclerotic in response to treatment, and this is demonstrated in this case on the PET/CT. The hypermetabolic bone foci that were seen on the initial PET/CT were without a clear CT correlate (indicating they were lytic) but became sclerotic (within 3 weeks, after one cycle of chemotherapy!) and readily visible on the CT portion of the follow-up PET/CT, at which time the PET activity had resolved. This does not mean the patient is cured or that the disease is not active. This patient had biopsy confirmation of metastatic involvement of T11, concurrent with normalization of PET scan activity. This constellation of findings reflects the reality that initially lytic bone metastases, best seen on PET imaging, responded to treatment by developing sclerosis. In the process, the bone metastases became increasingly visible on CT and bone scan, and inactive on PET.
CASE 2 Stage IV presentation with bone metastases (breast cancer presenting with back pain)
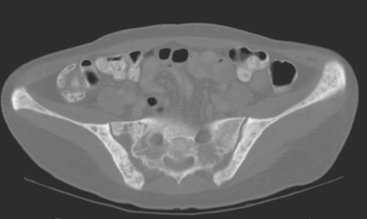
A 35-year-old obese woman presented with severe low back, knee, and hip pain and 5 days of intermittent fever up to 102 degrees. She was evaluated with abdominal, pelvic, and lumbar spine CT scans for suspicion of a spinal infection. These studies showed multiple lytic lesions in bone, including the L5 vertebral body, and left sacrum, ilium, and proximal femur (Figures 1, 2, 3, and 4). Bony metastatic disease was suspected, and a lung primary was sought with a chest CT. This showed a 2-cm spiculated right breast mass, suspicious for a breast cancer primary (Figure 5).
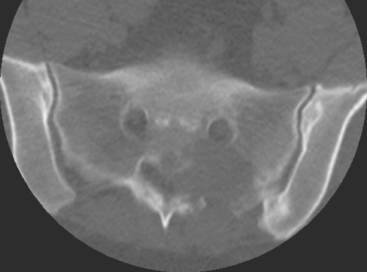
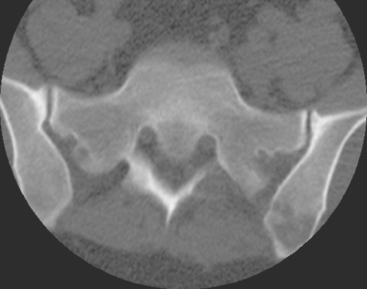
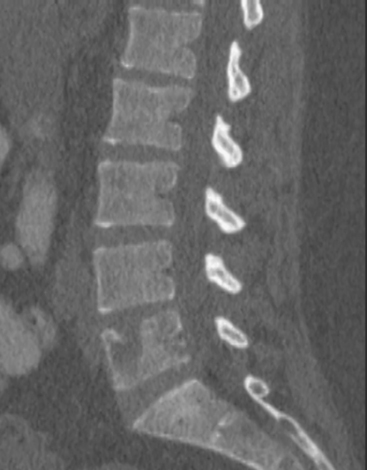
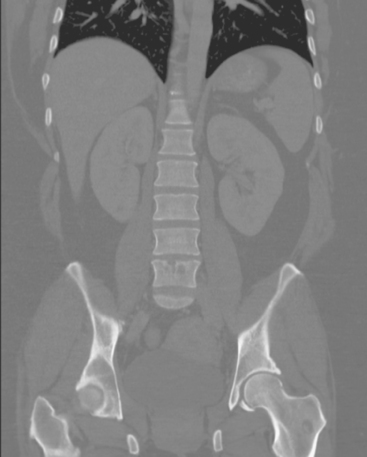
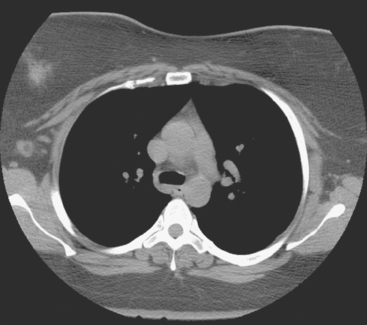
FIGURE 5 Axial unenhanced chest CT image shows a central right breast mass in largely fatty breasts.
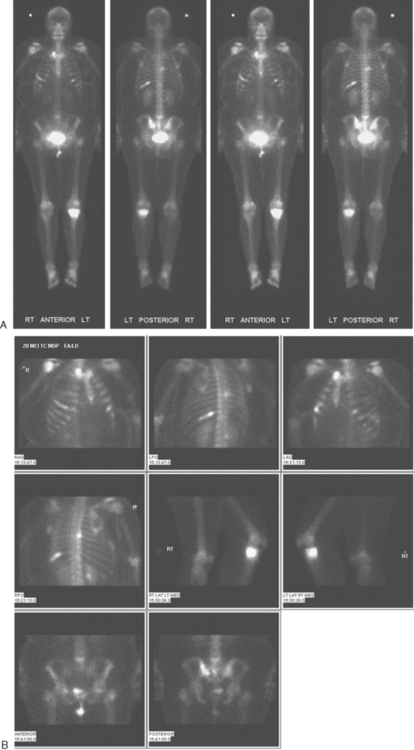
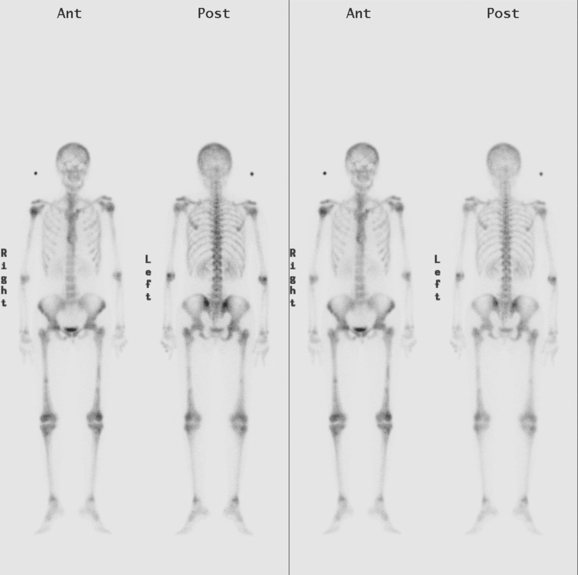
Bone scan showed corresponding, highly suspicious, multifocal findings suggesting bone metastases (Figure 6).
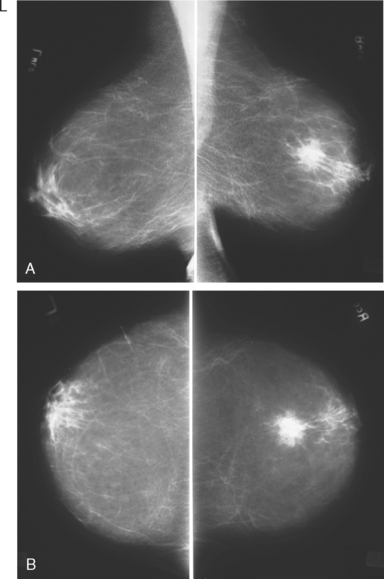
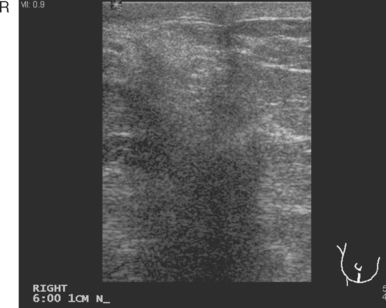
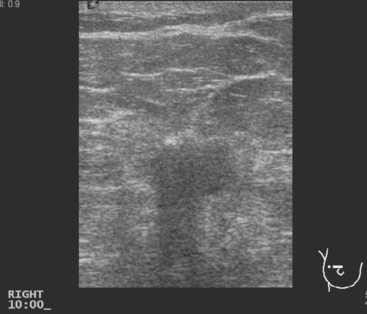
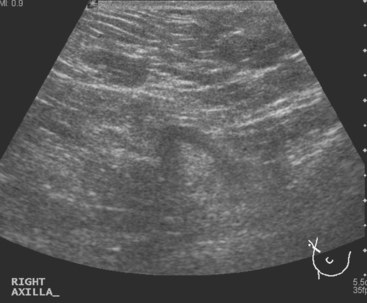
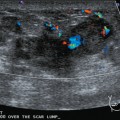
Breast imaging workup with diagnostic mammography, breast ultrasound, and ultrasound-guided core needle biopsy confirmed right breast cancer. The mammogram showed a dominant, central, 5-cm spiculated mass (Figure 7). Ultrasound showed a corresponding irregular hypoechoic mass in the retroareolar region, with a separate 1.7-cm suspicious shadowing focus in the upper outer quadrant (UOQ) (Figures 8 and 9). A suspicious axillary lymph node was also noted, with mild cortical mantle thickening (Figure 10).
Histologic sampling of the breast masses confirmed infiltrating ductal carcinoma (IDC) from both sites, estrogen receptor and progesterone receptor positive, and HER-2/neu positive. Fine-needle aspiration of the axillary lymph node demonstrated metastatic carcinoma.
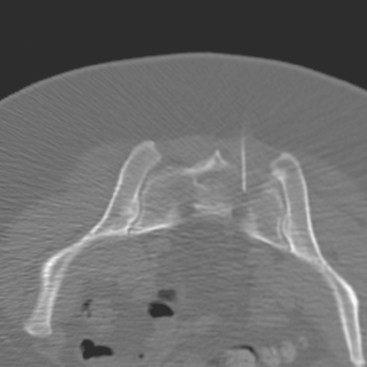
CT-guided sampling of a lucent sacral lesion showed metastatic adenocarcinoma, consistent with breast primary (Figure 11).
Palliative radiation therapy to the lumbar spine (L5 and sacroiliac region) and left knee were given for pain relief, and the patient was started on tamoxifen and zoledronic acid (Zometa). Repeat CT images, 7 months later, show a variety of bone responses to these interventions (Figure 12).
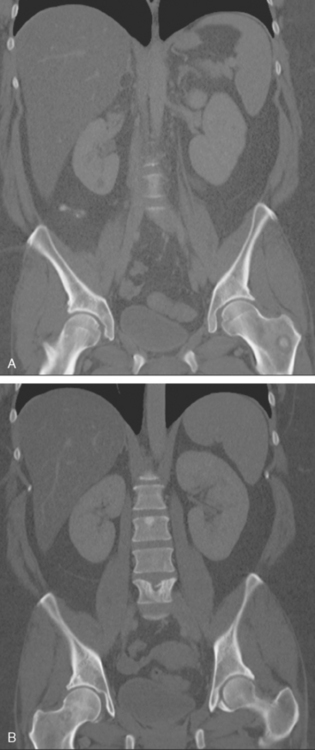
FIGURE 12 Coronal CT reconstructions (A anterior to B), 7 months after initial CT in Figure 4, after lumbar spine radiation, and treatment with tamoxifen and Zometa. In A, the left intertrochanteric metastasis has grown. It now displays a dominant central sclerotic component, with a lucent rim. In B, the lytic focus at the superior end plate of L5 remains visible, but now shows a thick surrounding blastic response. At the superior end plate of L3, a blastic lesion is now seen. This may reflect healing of a subradiographic lytic metastasis.
TEACHING POINTS
This is a distinctly unusual presentation of breast cancer, with symptomatic bone metastases bringing this pre-screening-age patient with no notable family history to attention. Less than 10% of breast cancer patients present with stage IV disease. This patient’s primary tumor was also identified through an unusual route, being first seen on a chest CT. Breast cancers can certainly be picked up initially on chest CT, which usually is performed for other reasons. (See Case 15 in Chapter 1 for another example.) For this reason, CT interpreters should always scrutinize chest wall soft tissues and breasts as part of their routine search pattern.
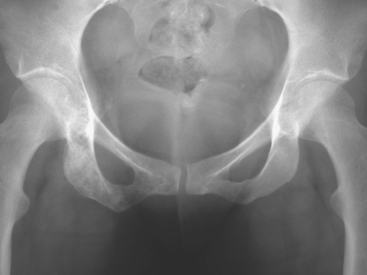
CASE 3 Relapse with bone metastases
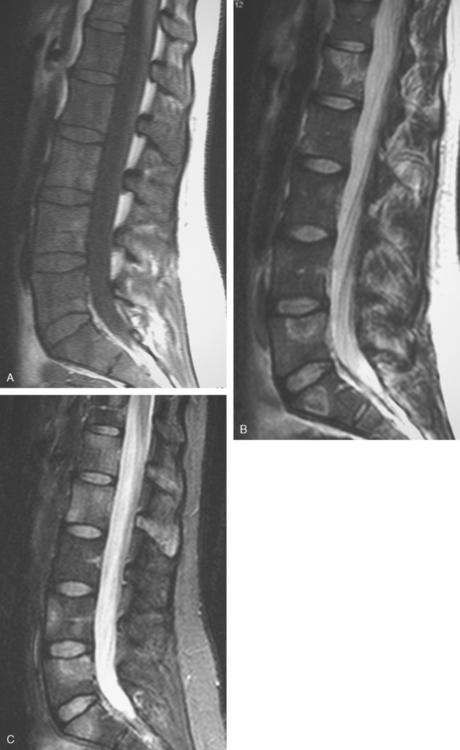
A pelvis x-ray was abnormal, with a moth-eaten appearance of the right ischium (Figure 1). Subsequent evaluations with pelvis and lumbar spine MRI, body CT scans, positron emission tomography (PET), and bone scan suggested extensive bony metastases (Figures 2, 3, 4, and 5). A bone marrow aspirate confirmed metastatic breast cancer. The patient was placed on goserelin acetate (Zoladex), zoledronic acid (Zometa), and anastrozole (Arimidex).
A year later, while on Zoladex, Zometa, and exemestane (Aromasin), the patient was restaged with PET/CT for symptoms of increased aching, weight loss, depressed appetite, and rising tumor markers. PET/CT showed new liver metastases. Chemotherapy was recommended, but declined. The patient was started on fulvestrant (Faslodex). Restaging after 2 months, at which time the patient had fatigue, shortness of breath, and rising tumor markers, showed progression of liver metastases as well as evidence of lung involvement (see Case 13 in Chapter 10
Related posts:

Stay updated, free articles. Join our Telegram channel

Full access? Get Clinical Tree


