Nonneoplastic entities may closely resemble the imaging findings of primary or metastatic intracranial neoplasia, posing diagnostic challenges for the referring provider and radiologist. Prospective identification of brain tumor mimics is an opportunity for the radiologist to add value to patient care by decreasing time to diagnosis and avoiding unnecessary surgical procedures and medical therapies, but requires familiarity with mimic entities and a high degree of suspicion on the part of the interpreting radiologist. This article provides a framework for the radiologist to identify “brain tumor mimics,” highlighting imaging and laboratory pearls and pitfalls, and illustrating unique and frequently encountered lesions.
Key points
- •
Tumor mimics may account for 4% to 13% of referrals to a neuro-oncology service, so consideration of nonneoplastic processes is critical during initial evaluation of CNS neoplasia.
- •
Leveraging specific imaging signs and advanced imaging techniques detailed herein may add diagnostic confidence when considering various autoimmune, infectious, and vascular tumor mimics.
- •
Variability in ancillary laboratory diagnostics, including serologic and various immunohistochemical tests, may confer sufficiently low negative predictive values such that tumor mimics may still be considered on a clinical and imaging basis despite an unrevealing laboratory evaluation.
Introduction
Although most patients referred to neuro-oncology with the suspicion of brain tumor by imaging harbor a neoplasm, in some cases the abnormality has a nonneoplastic cause. A wide variety of nonneoplastic entities may closely resemble the imaging findings of primary or metastatic intracranial neoplasia, posing diagnostic challenges for the referring provider and the radiologist. Autoimmune, infectious, and vascular diseases have particular potential for misdiagnosis as brain tumors given the often nonspecific neurologic symptoms and ambiguous imaging features. These “tumor mimics” may account for 4% to 13% of patient referrals to neuro-oncology; and when imaging is ordered by neuro-oncologists with the presumptive diagnosis of “brain tumor,” it may foster a framing bias that leads the radiologist to misinterpretation of the examination. , Advances in neuroimaging quality and availability, which have increased the detection of “incidentalomas” (approximately 3% of MR imaging brain scans), potentiates the possibility for such referrals to neuro-oncologists or neurosurgeons. The consequences of an incorrect imaging diagnosis of intracranial neoplasia are obvious, with unnecessary surgical procedures and misdirected medical therapies yielding a likelihood of patient harm and legal liability.
In this article, we provide a framework for the radiologist to identify “brain tumor mimics” by highlighting imaging and laboratory pearls and pitfalls, and illustrating unique and frequently encountered lesions. Because the initial imaging in most patients with these lesions follows a generic brain MR imaging protocol dictated by institutional practice, we describe features of the various tumor mimics on common MR imaging brain sequences that are applicable to routine clinical imaging studies.
Imaging findings
Demyelinating and Inflammatory Disorders
Although multiple sclerosis typically displays small multifocal perivenular demyelinating plaques with a propensity for the callososeptal interface that disseminate in space and time, larger tumefactive lesions may occasionally constitute the imaging presentation. In such cases, almost one-third of the larger tumefactive lesions can be the only lesion, potentially leading to misdiagnosis as neoplasia. Solitary and/or tumefactive lesions are more likely to occur in the uncommon multiple sclerosis variants of Marburg and Schilder diseases.
The tumefactive demyelinating lesions can have local mass effect and edema (although disproportionally less when compared with tumors of the same size), centered within the deep white matter in the supratentorial cortex. Other imaging features include computed tomography (CT) hypoattenuation and T2 hypointense rim. When these demonstrate enhancement, it is classically in the form of an incomplete ring, with the incomplete segment of the ring facing the cortex. The enhancing segment represents the leading edge of demyelination, facing the white matter side of the lesion. Dilated veins have been seen within the central part of these lesions, and may be well demonstrated on susceptibility-weighted imagining (SWI). Usually these lesions demonstrate increased diffusivity, with decreased perfusion and nonspecific MR spectroscopy findings (with elevated choline, decreased N-acetylaspartate (NAA), and high lactate) when compared with lymphomas. A rapid response to steroid helps in narrowing the diagnosis.
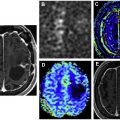
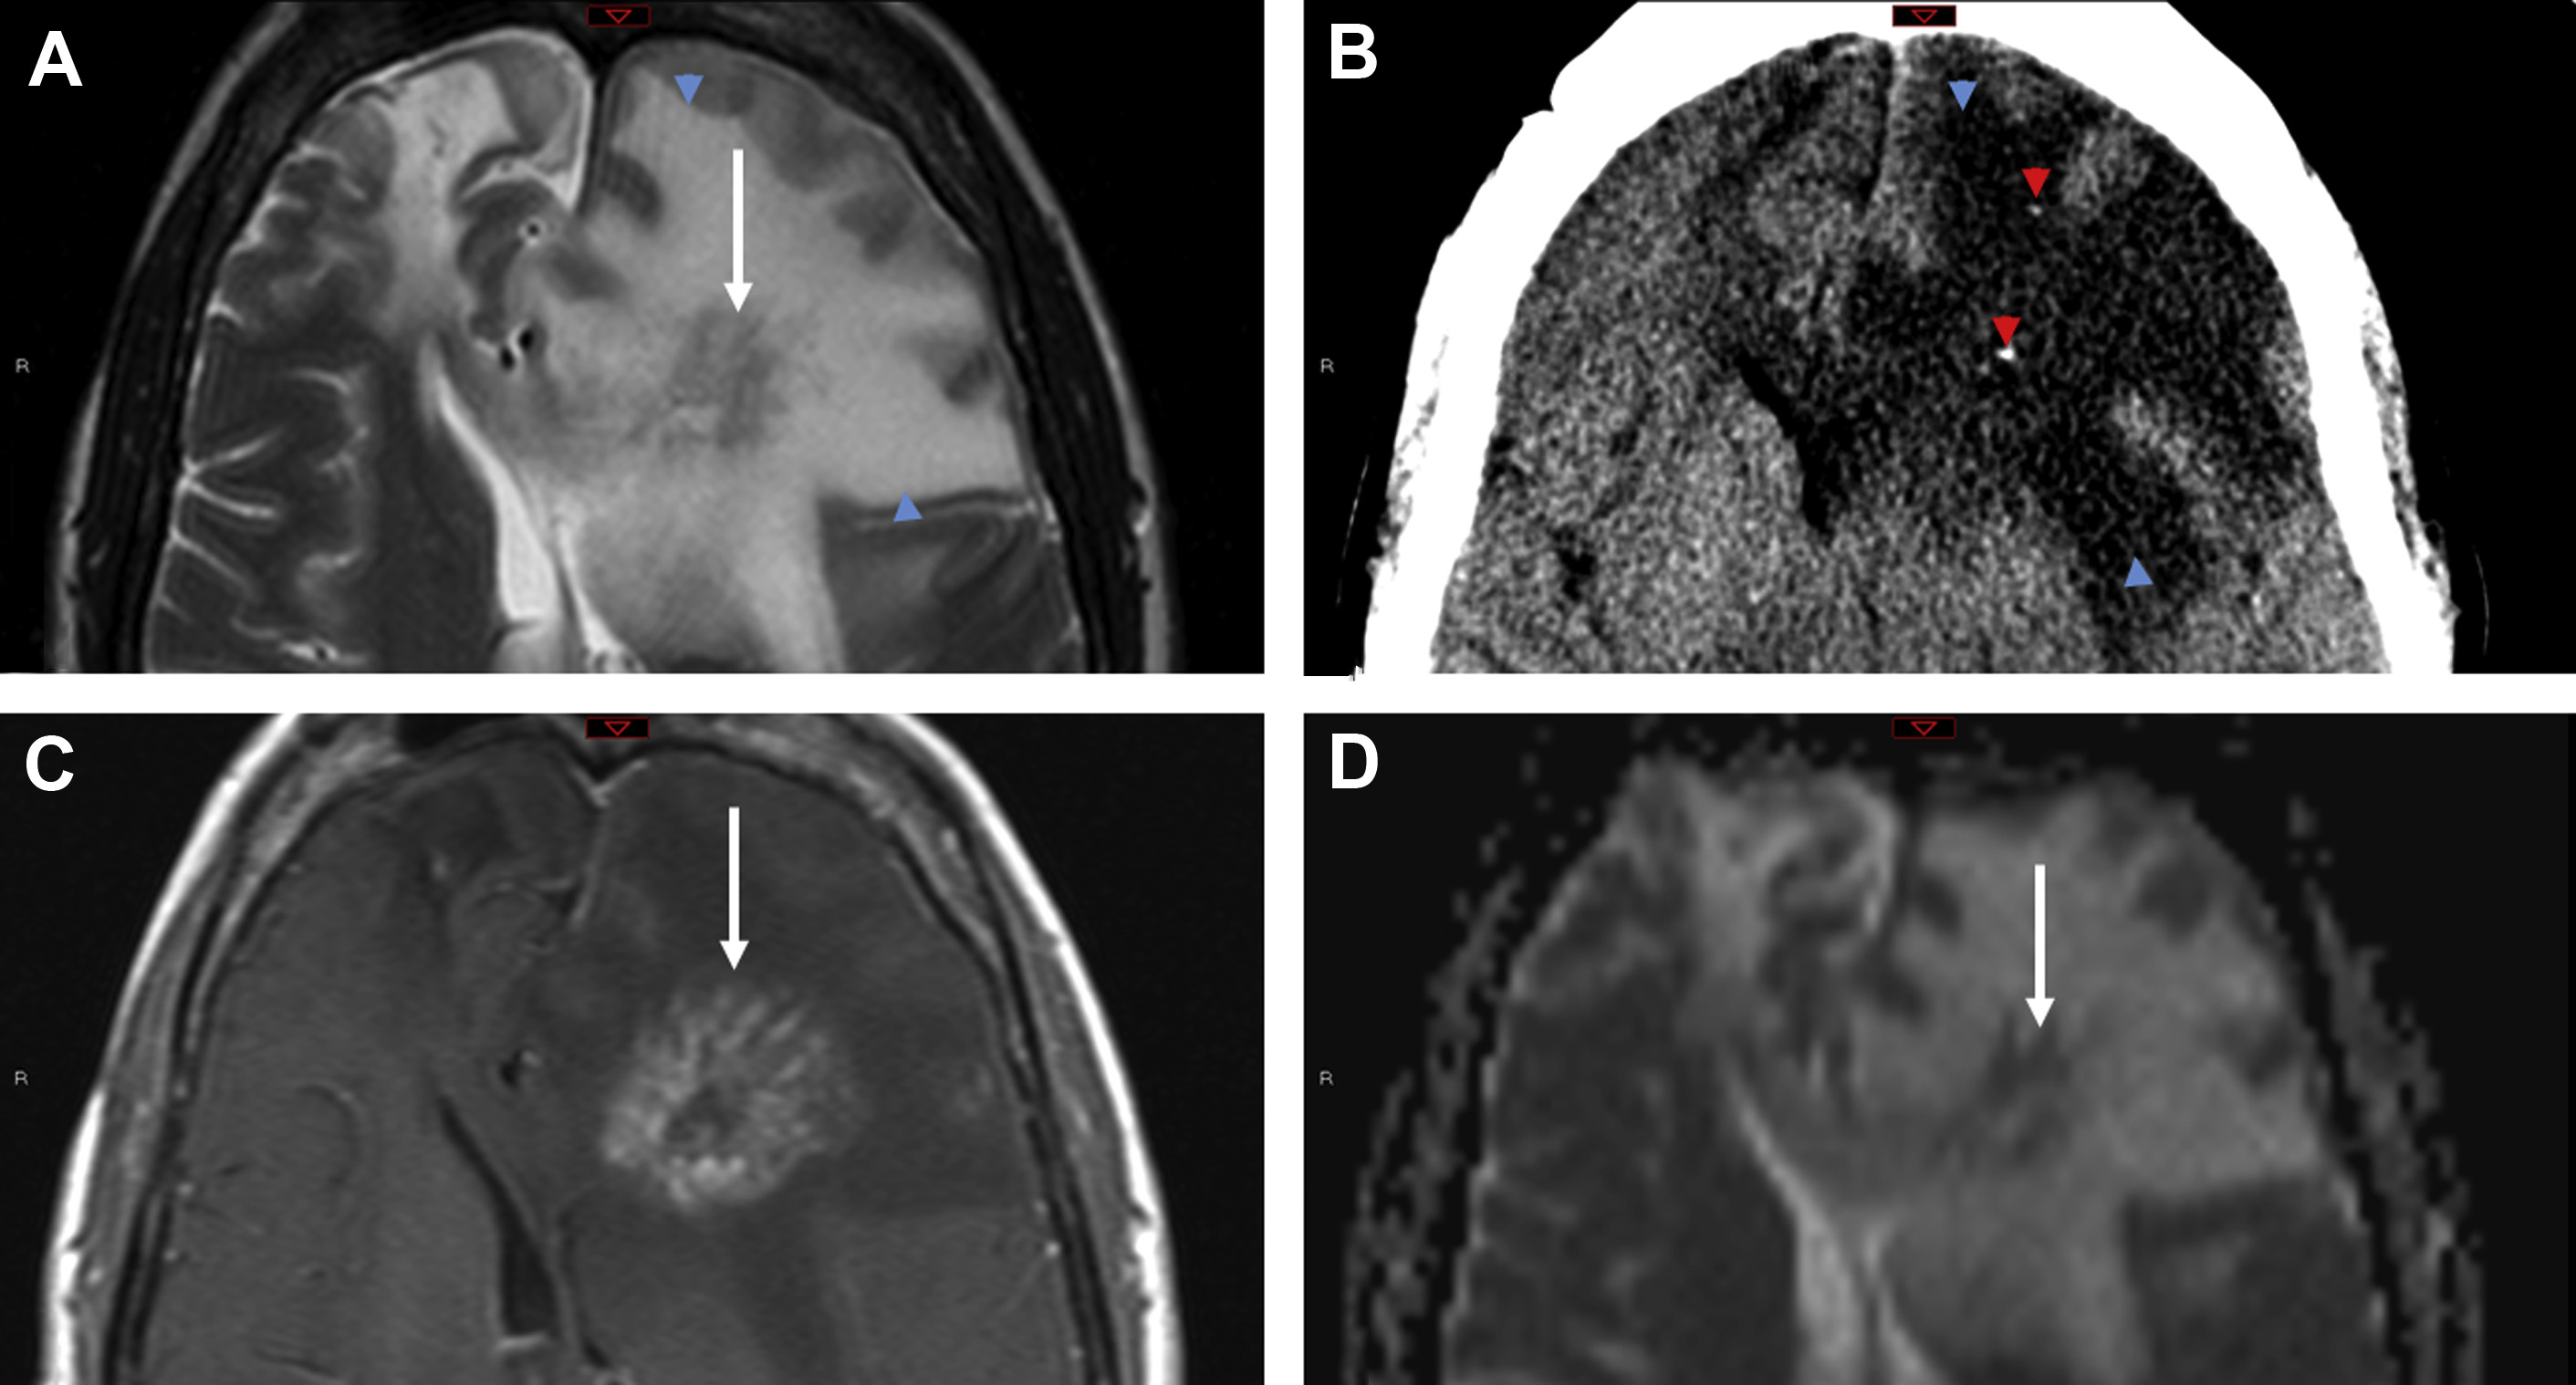
Acute disseminated encephalomyelitis (ADEM) is a unique autoimmune-mediated demyelinating disease, initiated by an infection (or immunization), which leads to myelin antibodies. Imaging usually reveals multifocal subcortical and periventricular lesions, with involvement of the basal ganglia, posterior fossa, and cranial nerves. Many of the white matter lesions have ill-defined “cotton-ball” like appearance on T2 and FLAIR series with a varied enhancing appearance ranging from linear, punctate, to partial/incomplete ring like enhancement for some of the larger lesions. Larger “tumefactive” lesions when present appear similar to those seen in multiple sclerosis ( Fig. 1 ). In cases of acute hemorrhagic leukoencephalitis, microhemorrhages or macrohemorrhages are most evident on SWI sequences, occasionally resembling hemorrhagic neoplasms.
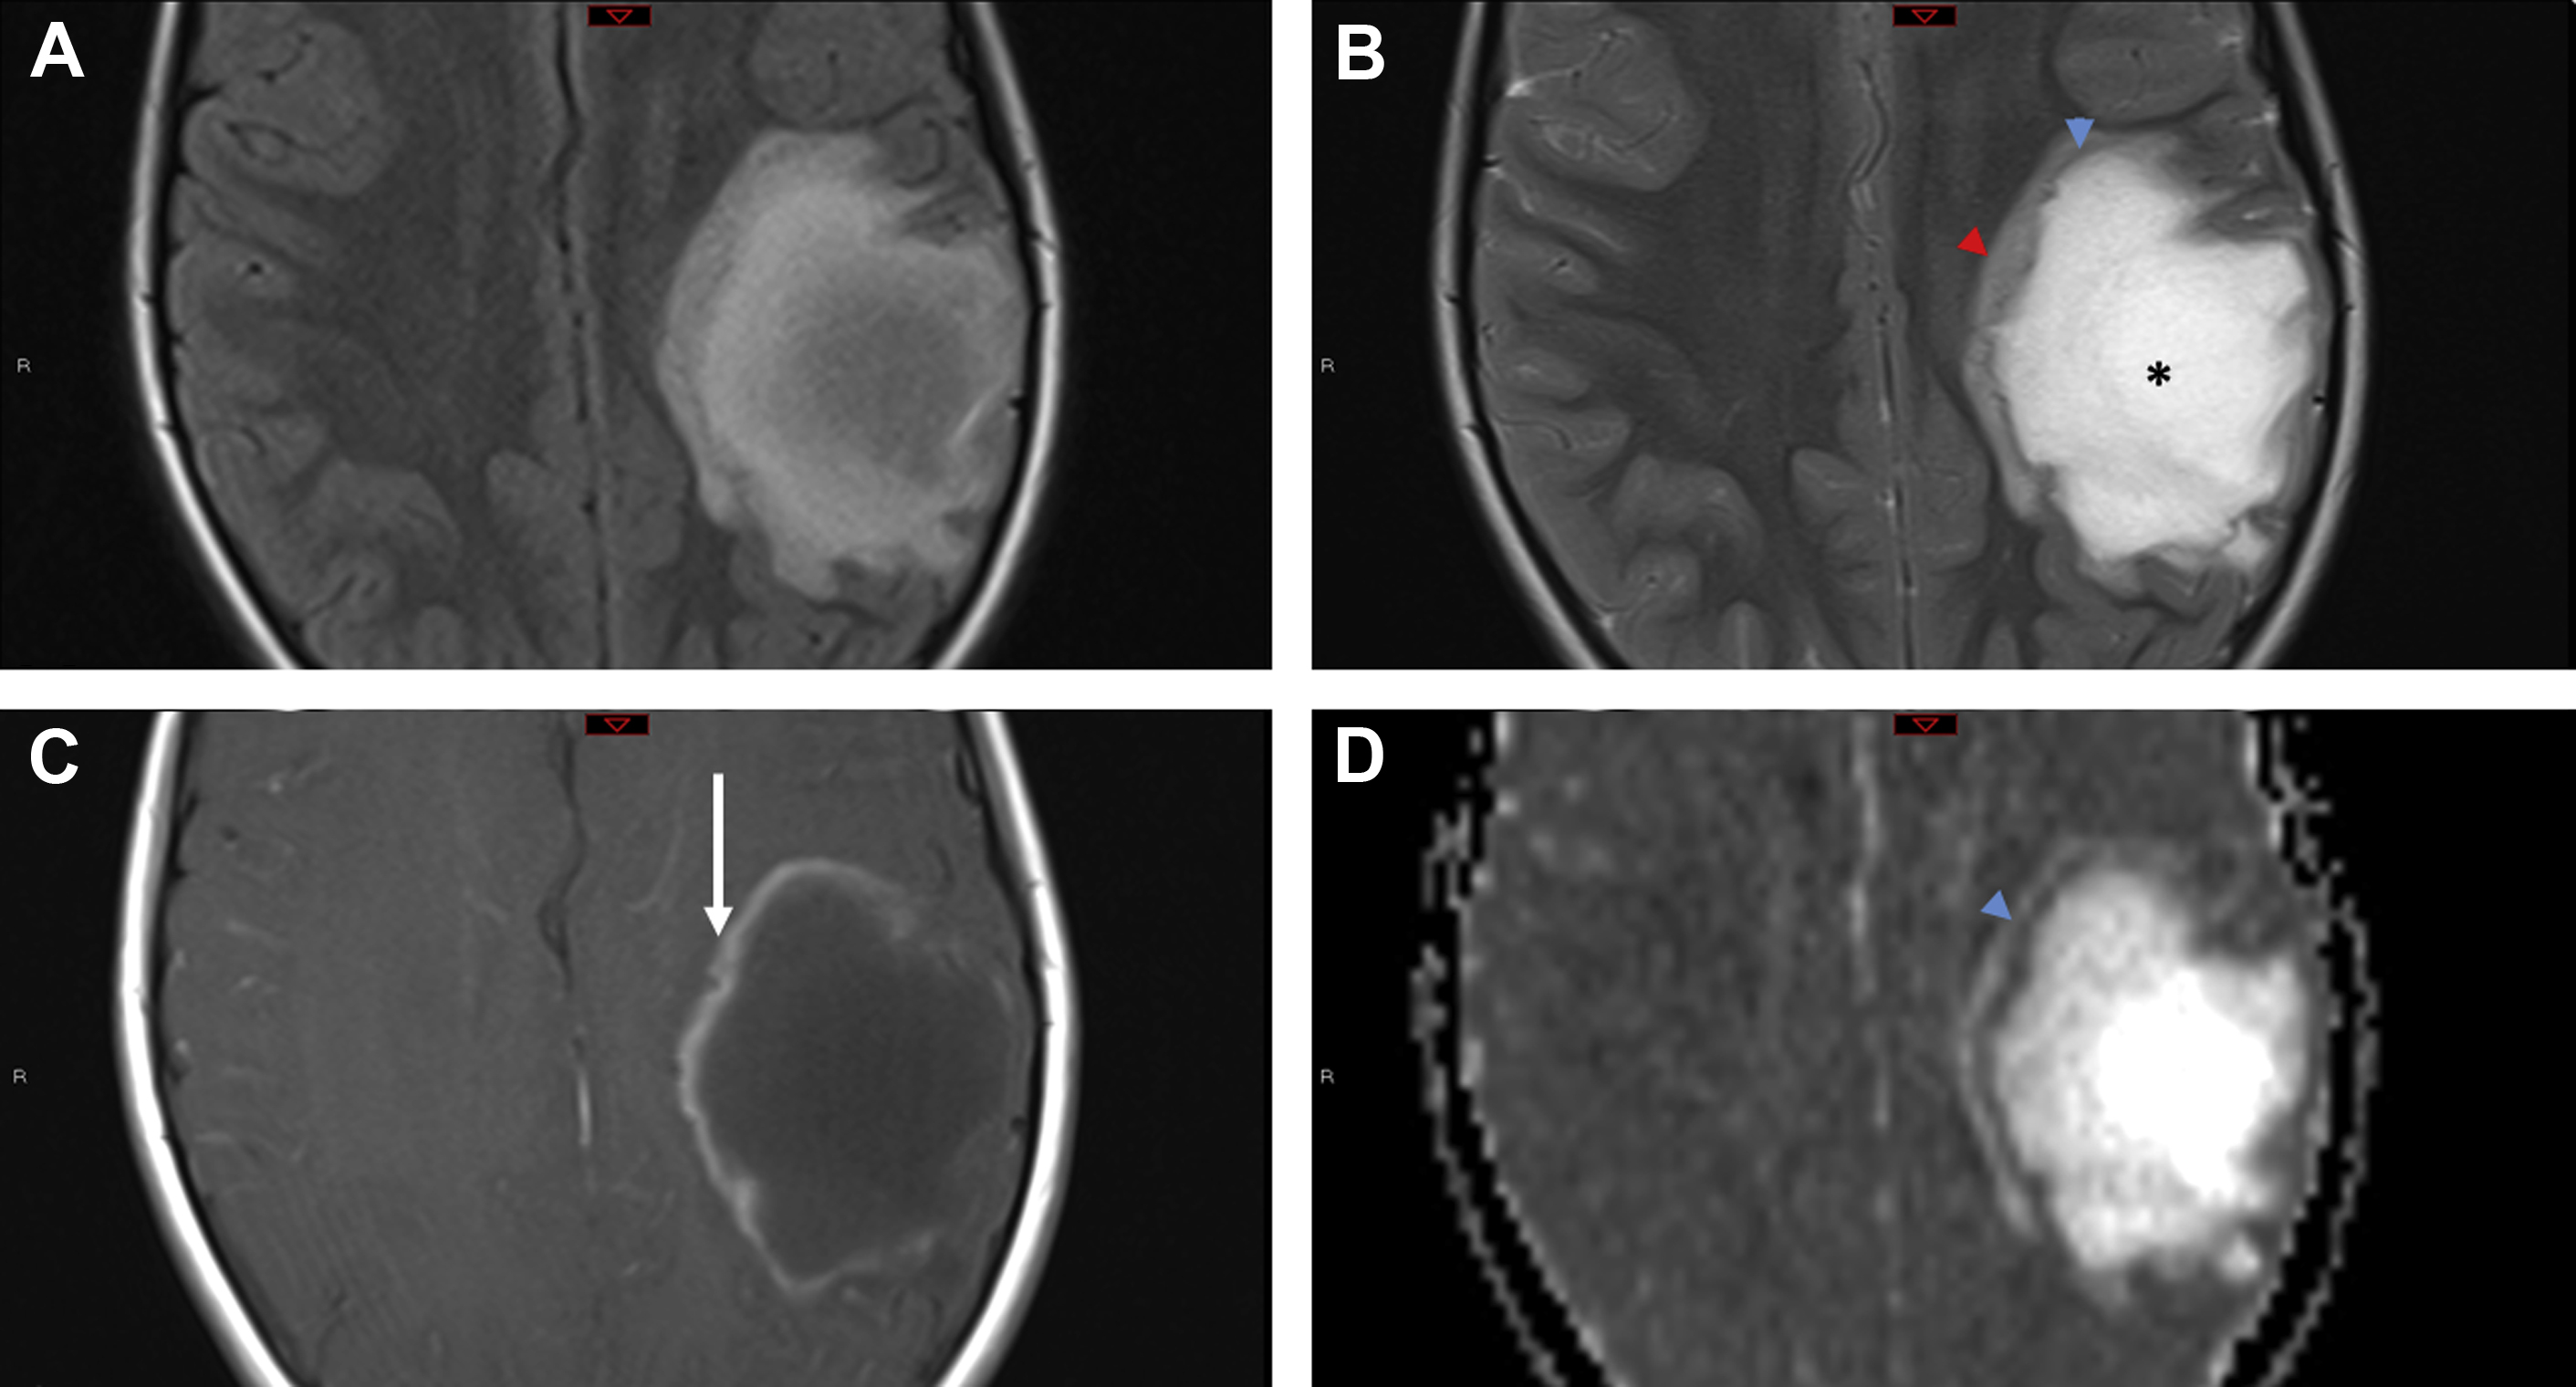
Neuromyelitis optica and neuromyelitis optica spectrum disorder (NMOSD) are autoimmune-mediated demyelinating disorders because of antibodies against aquaporin-4. Neuromyelitis optica–IgG is a specific biomarker that is present in most of these patients. The brain lesions in NMOSD involve the brainstem, hypothalamus, and other periventricular areas, and unlike tumefactive demyelinating lesions, it is unlikely for them to be mistaken for tumors. In rare cases, tumefactive demyelinating lesions is seen in neuromyelitis optica or NMOSD, with similar imaging features as discussed previously. It is more likely for the long segment cord lesions to be mistaken for a spinal cord tumor if there is lack of intracranial or optic nerve involvement.
Myelin oligodendrocyte glycoprotein (MOG) is a cellular adhesion molecule expressed on the cell surface of oligodendrocytes and myelin sheaths within the central nervous system (CNS). Clinical presentation is strongly influenced by age and correlates generally with imaging phenotypes. The usual imaging patterns of presentation include a leukodystrophy-like pattern, an ADEM-like pattern, and an NMOSD-like pattern. However, they can rarely present on imaging as a demyelinating pseudotumor with imaging findings similar to a tumefactive demyelinating lesion detailed previously.
Neurosarcoid
Sarcoidosis is a complex multisystem granulomatous disease that is believed to have an autoimmune origin. Although the most commonly involved organ is the lung, extrapulmonary sarcoidosis frequently occurs, with CNS involvement present in 10% to 20% of patients. Many patients with neurosarcoidosis remain asymptomatic, with only 5% demonstrating significant imaging findings, including possible involvement of the brain, blood vessels, spinal cord, dura, optic nerves, bones, and the adjacent soft tissues in the head and neck.
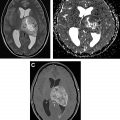
Neurosarcoidosis can mimic brain tumors in multiple different ways. Large dural-based masses can mimic meningiomas, whereas nodular enhancing lesions along cranial nerves is characterized as schwannomas or neurofibromas. Involvement of choroid plexuses can mimic enhancing intraventricular tumors. Although the parenchymal involvement in neurosarcoidosis is frequently along perivascular spaces, causing a vasculitic-like picture, larger coalescing granulomas within the brain can present as expansile tumefactive lesions with local mass effect and edema ( Fig. 2 ). Unless the neuroradiologist is cognizant of this entity, these lesions are misdiagnosed as lymphoma or idiopathic inflammatory pseudotumor. Rarely, there is need for a biopsy to demonstrate the noncaseating granulomas, multinucleated giant cells, epithelioid histiocytes, and benign lymphocytes and plasma cells characteristic of this entity.
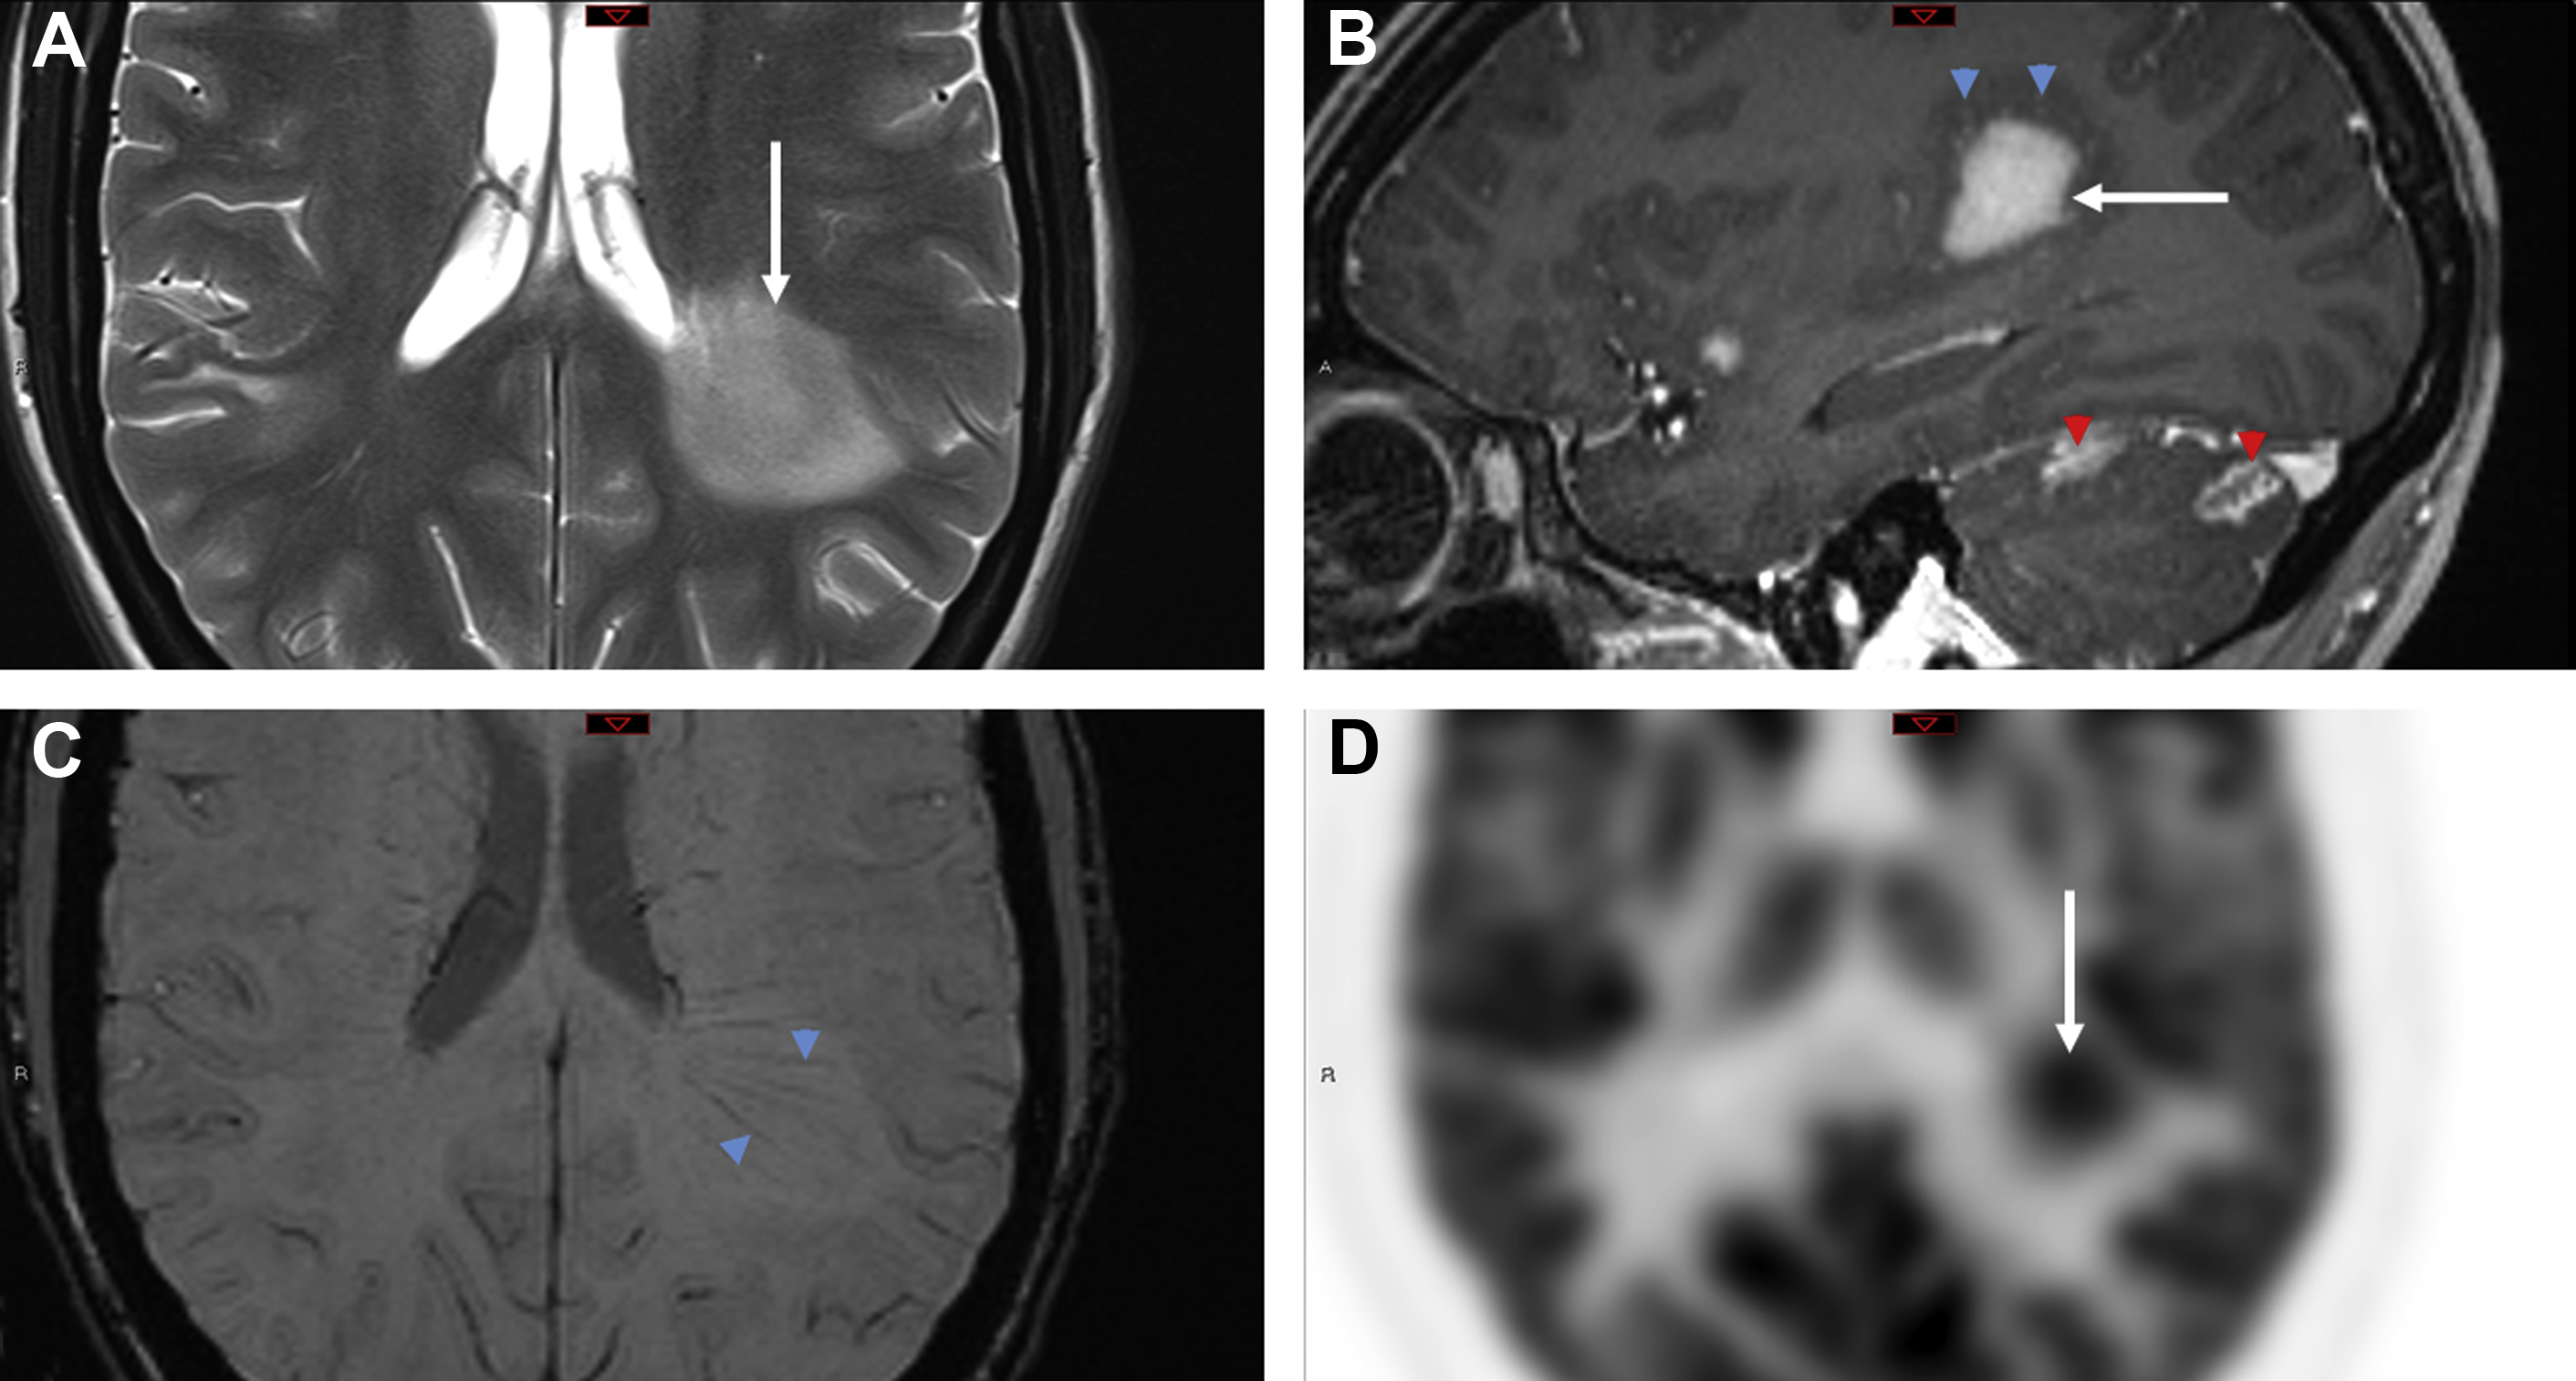
Autoimmune Encephalitis
Autoimmune encephalitis represents a challenging set of diagnoses with varied clinical presentations. In most cases, specific antibodies directed against CNS cells are found in peripheral blood or cerebrospinal fluid (CSF). Although autoimmune encephalitis has been grouped according to the antibodies recognized epitope (intracellular vs cellular surface) and if the antibodies are mechanistically responsible for the disease or an epiphenomenon, the MR imaging findings are indistinguishable between these two groups. The most common imaging appearance is the involvement of the limbic system, which manifests as either unilateral or bilateral involvement of mesial temporal lobes and thalami/basal ganglia with patchy enhancement. Nevertheless, the imaging abnormalities may occur in other cerebral lobes. Rarely, these lesions exhibit swelling and edema that can mimic infiltrative gliomas.
TREX1-Associated Retinal Vasculopathy with Cerebral Leukodystrophy
TREX1 gene–related mutations causing retinal vasculopathy and cerebral leukodystrophy are rare autosomal-dominant disorders secondary to underlying frameshift mutations that encode for major DNA exonucleases. The mutations result in accumulation of abnormal DNA and RNA within cells, which are then mistakenly targeted by the host immune cells with devastating consequences. Most of these patients are middle aged, present with vision and neurologic symptoms, and have a positive family history.
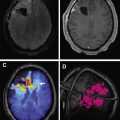
The most common imaging findings include hyperintense white matter lesions on T2/FLAIR with near complete sparing of the gray matter. Lesions, which are usually supratentorial, may demonstrate nodular enhancement with restricted diffusion or larger mass-like lesions with irregular rim enhancement and extensive surrounding edema ( Fig. 3 ). After immunosuppressive treatment, the lesions can transiently decrease in size with newer lesions appearing at different sites, giving the appearance of a migratory tumefactive process.
Central Nervous System Infection Tumor Mimics
Pyogenic infections
Cerebral abscesses are occasionally difficult to distinguish from neoplasm, particularly metastatic disease, because both may appear as disseminated ring-enhancing lesions localizing to the gray-white matter interface. In a series of 221 ring-enhancing lesions, Schwartz and colleagues found that although neoplasia (primary and metastatic) accounted for 72% of cases, pyogenic abscess and atypical infections accounted for 8% and 4%, respectively. In a similar investigation by Kim and colleagues, concordant findings were reported, with 4% pyogenic abscess and 2.6% atypical infections.
Although metastasis are the more common underlying cause of ring-enhancing lesions, some imaging features should prompt consideration of an infectious tumor mimic. The SWI dual rim sign displays a hypointense outer rim posited to represent the fibrocollagenous abscess capsule surrounding a hyperintense inner rim thought to correspond to a zone of granulation tissue between the necrotic core and the capsule. In a study of 32 brain masses, the dual rim sign was present in 9 of 12 abscesses and 0 of 20 glioblastomas, conferring a sensitivity of 75% and a specificity of 100%.
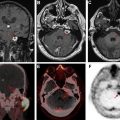
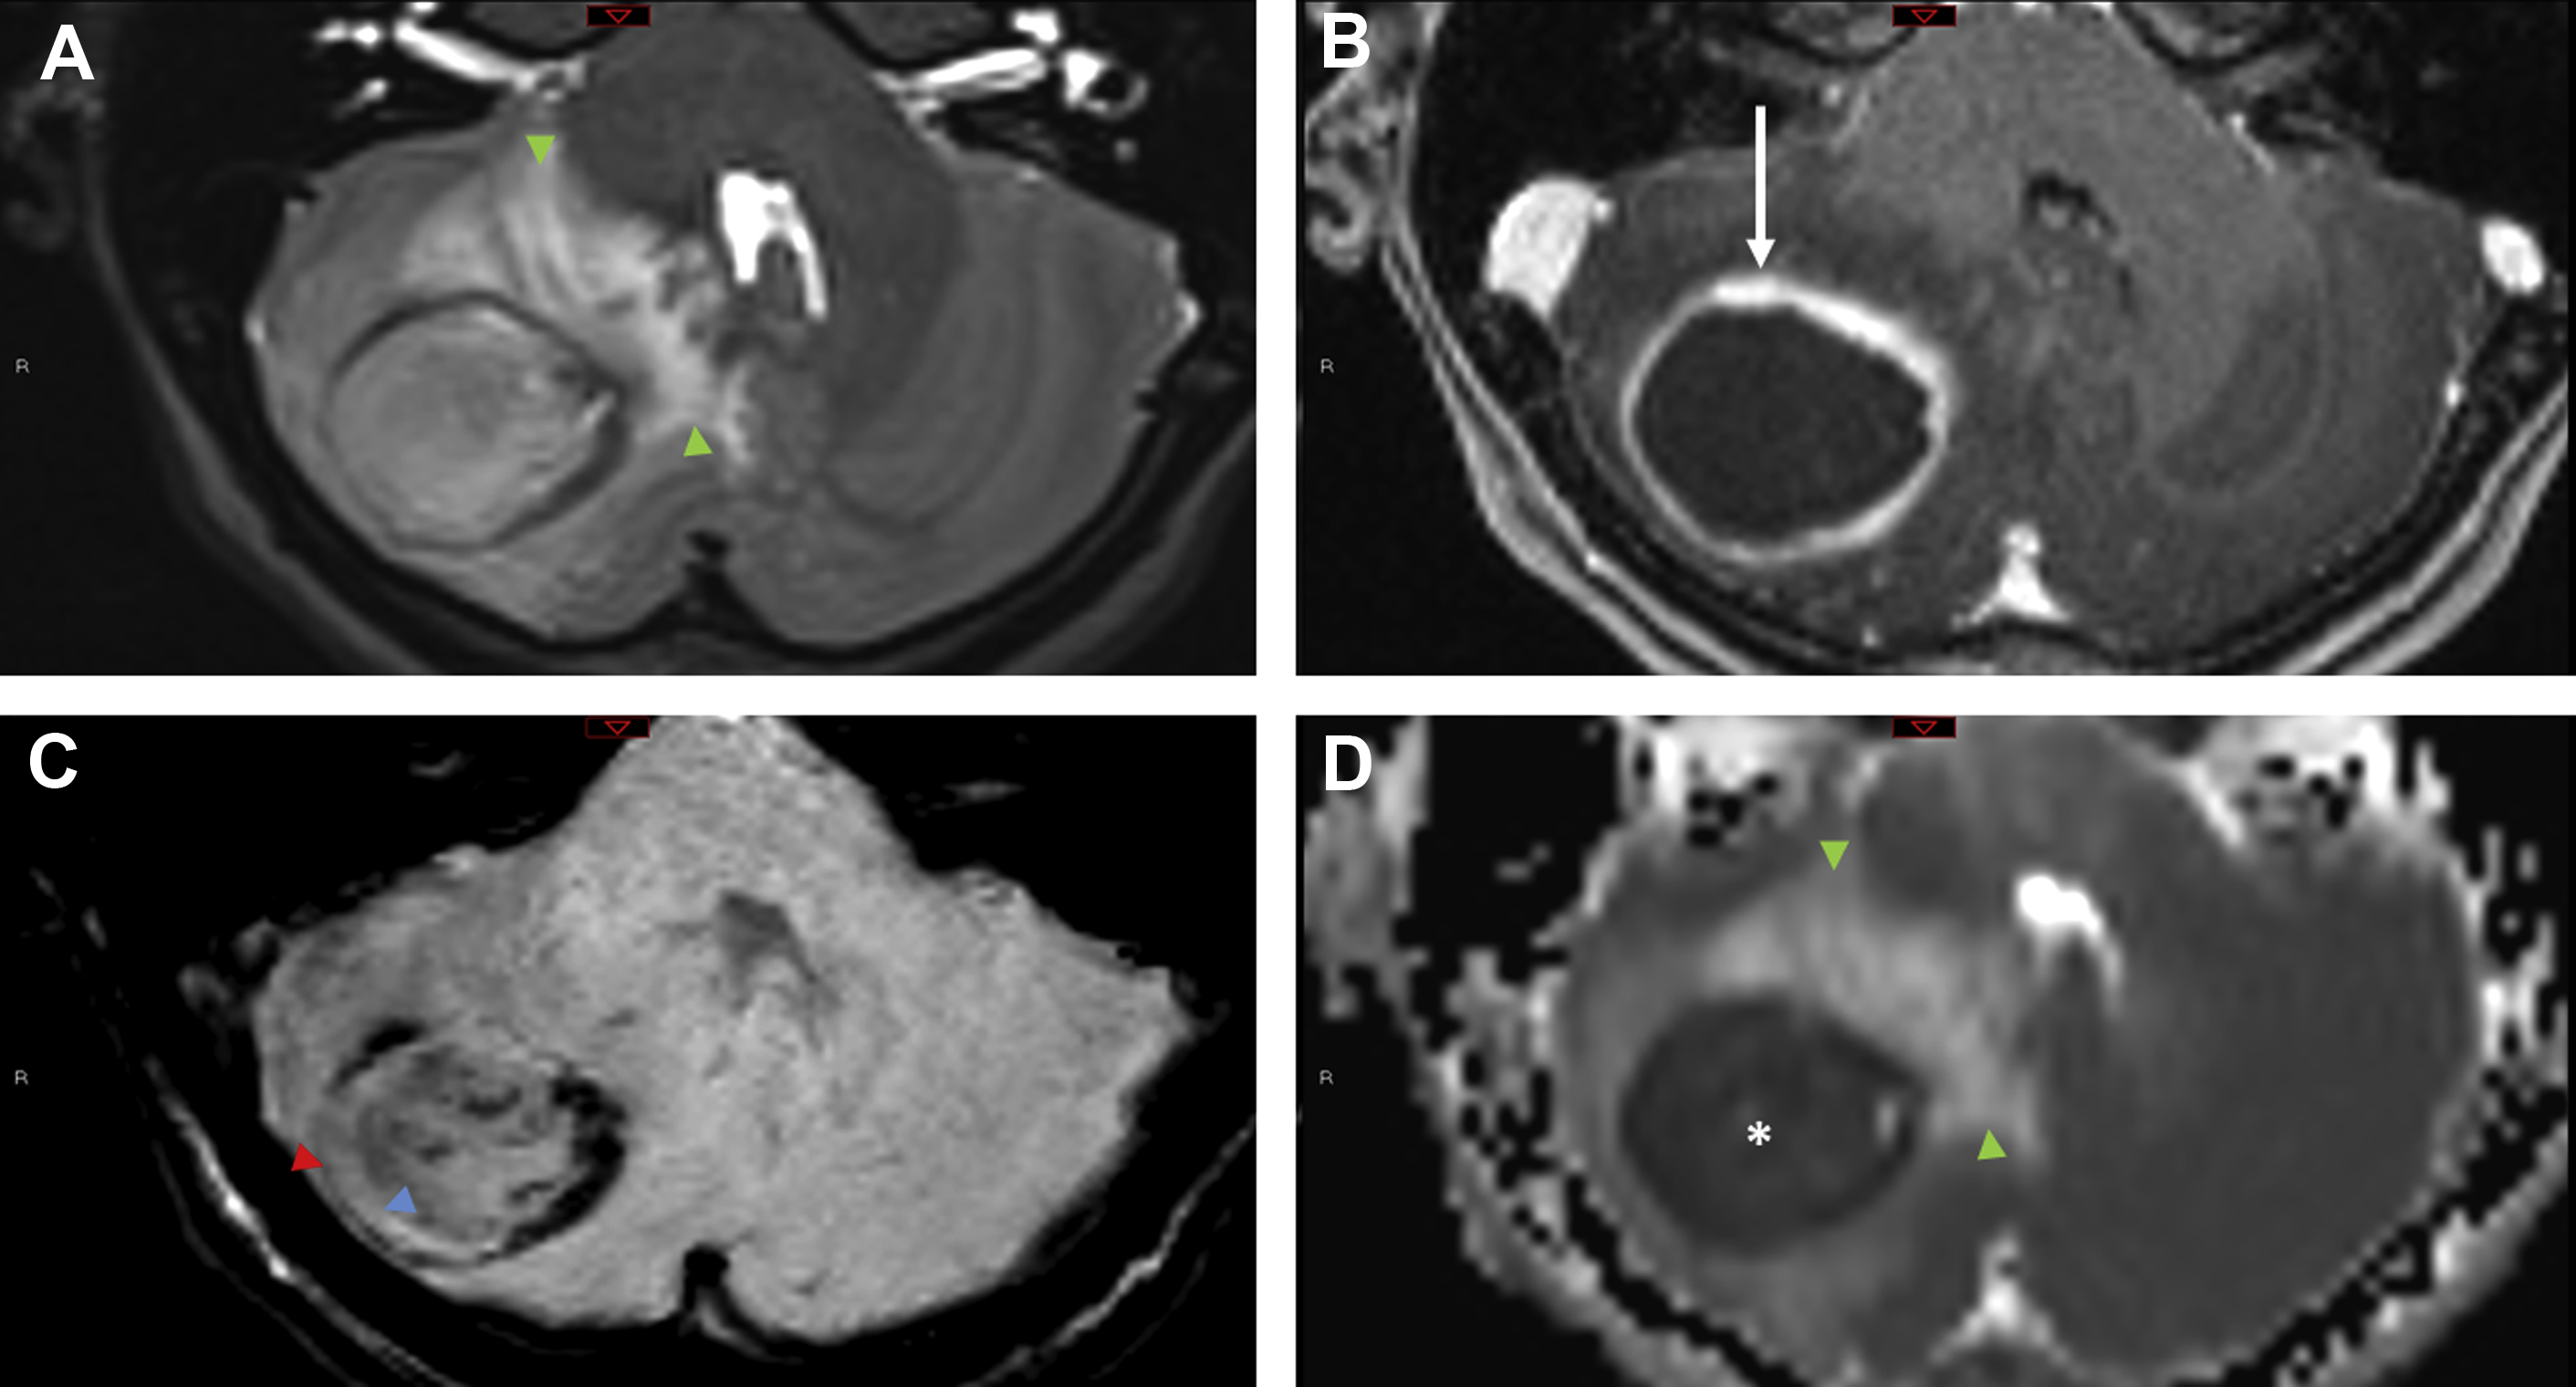
Restricted diffusion of cavity contents, one of the best known imaging features of pyogenic abscesses, is caused by the highly viscous nature of the proteinaceous exudate admixed with viable bacteria, inflammatory cells, and debris ( Fig. 4 ). A meta-analysis of 11 studies found a pooled sensitivity and specificity of 95% and 94%, respectively, for the use of diffusion-weighted images (DWI) to distinguish abscess from other cerebral ring-enhancing lesions. However, some pyogenic abscesses (∼4%), atypical infections, or pyogenic abscesses imaged after initiation of antibiotic therapy or in an immunocompromised host may not show diffusion restriction. ,
Atypical Infections
Toxoplasmosis
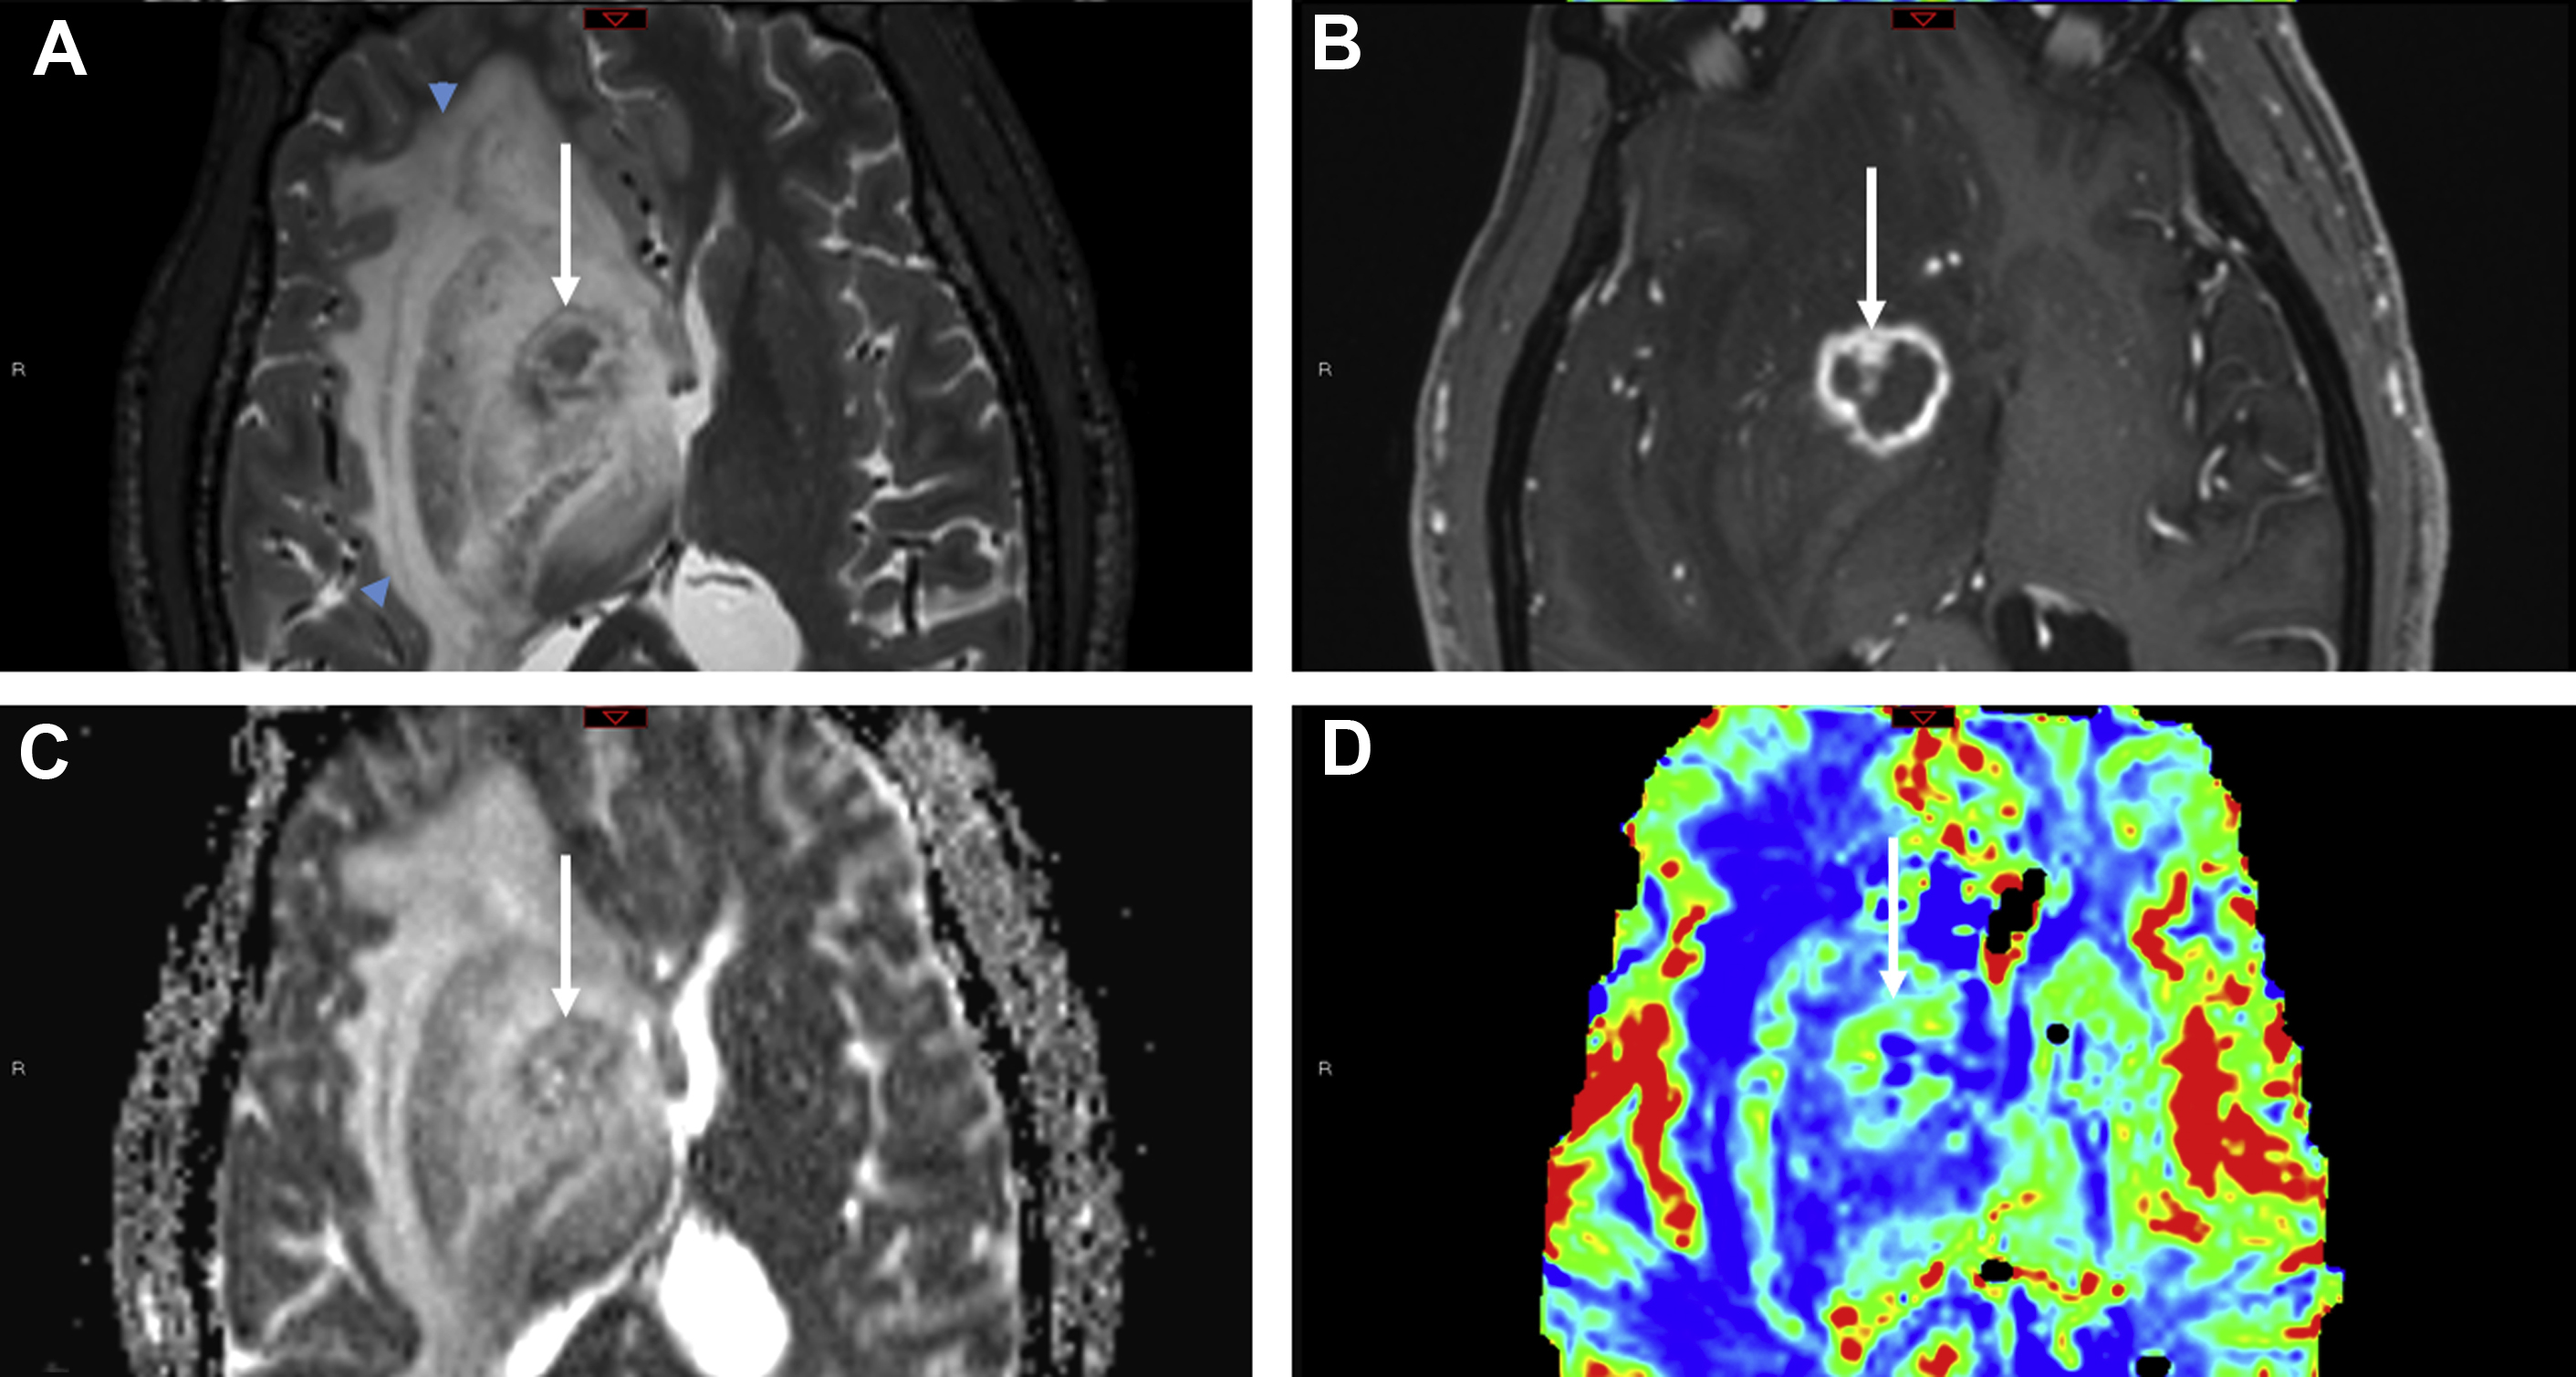
Toxoplasma gondii is a ubiquitous protozoan parasite prone to cause opportunistic cerebral infection, typically reactivation of latent infection, in the setting of severe immunosuppression (CD4 <100 cells/μL). Differentiating cerebral toxoplasmosis from primary CNS lymphoma (PCNSL) is often challenging on a clinical, laboratory, and imaging basis. Although there is considerable overlap of imaging, PCNSL is statistically the more likely cause in immunocompromised patients with a solitary parenchymal mass, particularly one demonstrating subependymal spread of disease, whereas toxoplasmosis is more likely multifocal with basal ganglia predilection. Both “eccentric” and “concentric” target signs favor toxoplasmosis. The eccentric target sign, present in less than 30% of cases, is recognized on postcontrast MR imaging series as a ring-enhancing lesion with a small nodular focus of enhancement along the lesion wall. The concentric target sign is shown on T2-weighted images as alternating zones of hypointensity/hyperintensity and is believed to be a more specific imaging feature ( Fig. 5 ).

Stay updated, free articles. Join our Telegram channel

Full access? Get Clinical Tree


