Abdominal imaging is essential to clinical decision making in emergency medicine. According to the National Hospital Ambulatory Medical Care Survey, about 8% of emergency department visits are for complaints potentially relating to the abdomen, including vomiting and abdominal pain. By 2005, 8% of adult patients visiting one tertiary care emergency department underwent abdominal computed tomography (CT). Abdominal imaging must identify immediate life-threats such as leaking abdominal aortic aneurysm, conditions requiring urgent surgical intervention such as appendicitis, and conditions requiring antibiotic therapy such as diverticulitis without abscess. Ideally, imaging should also reliably identify patients who do not require any urgent or emergent therapy and can safely be managed as outpatients. In this chapter, we discuss the strengths, limitations, and indications for common emergency abdominal imaging modalities. We describe a systematic approach to interpretation of abdominal x-ray and CT and a focused approach to abdominal ultrasound interpretation. We conclude with a comprehensive survey of important abdominal pathology, describing the diagnostic accuracy and imaging findings for each of the commonly employed modalities for each condition.
Chapter 10, Chapter 11, Chapter 12 review the imaging of abdominal trauma, abdominal vascular conditions, and genitourinary conditions, respectively. Chapter 16 delves into interventional radiologic procedures, including many for abdominal conditions. We refer to these chapters rather than repeating their content, recognizing that the clinical presentations of abdominal conditions can be quite nonspecific and that abdominal imaging sometimes must be selected to include an array of possible pathology, including traumatic, vascular, and genitourinary abnormalities.
Figures in this chapter are organized in general by type of pathology. In some cases, multiple modalities from the same patient are displayed together, because they depict a clinical story that can reveal strengths and weaknesses of various imaging modalities. For quick reference, Table 9-1 lists the content of figures in this chapter.
| Content | Figure Number |
|---|---|
| Abdominal x-ray, normal | 9-1 |
| Hounsfield CT density scale | 9-2 |
| Tissue densities on CT and fat as a contrast agent | 9-3, 9-4 |
| Fat stranding | 9-5 |
| Tissue enhancement with IV contrast, CT | 9-6 |
| Free air, x-ray | 9-7, 9-8 |
| Free air, CT | 9-9, 9-10 |
| Bowel perforation, CT | 9-11 |
| Pyloric stenosis, x-ray | 9-12 |
| Pyloric stenosis, ultrasound | 9-13 |
| Small-bowel obstruction, x-ray | 9-14, 9-15, 9-18 |
| Small-bowel obstruction, CT | 9-16, 9-17, 9-19 |
| Hernia, CT | 9-20, 9-21, 9-34 to 9-36 |
| Malrotation and midgut volvulus | 9-22 |
| Intussusception, CT | 9-23, 9-24 |
| Intussusception, x-ray | 9-25 |
| Intussusception, ultrasound | 9-26, 9-28, 9-30 |
| Intussusception, air-contrast enema | 9-27, 9-29, 9-31 |
| Large-bowel obstruction, x-ray | 9-32, 9-37, 9-38, 9-42, 9-44, 9-45, 9-46 |
| Large-bowel obstruction, CT | 9-33 ; see also sigmoid and cecal volvulus CT |
| Sigmoid volvulus, x-ray | 9-37, 9-38, 9-42 |
| Sigmoid volvulus, CT | 9-39 to 9-41 |
| Sigmoid volvulus, barium enema | 9-43 |
| Cecal volvulus, x-ray | 9-44 to 9-46 |
| Cecal volvulus, CT | 9-47 to 9-49 |
| Pseudo-obstruction of bowel, x-ray | 9-50 |
| Appendicitis, CT | 9-51 to 9-56 |
| Appendicitis, ultrasound | 9-57 |
| Epiploic appendagitis | 9-58 |
| Mesenteric adenitis | 9-59 |
| Diverticulosis, CT | 9-60 to 9-62 |
| Diverticulitis, CT | 9-62 to 9-66 |
| Inflammatory bowel disease and colitis, CT | 9-67 to 9-70 |
| Necrotizing enterocolitis | 9-71 |
| Cholelithiasis, x-ray | 9-72 |
| Cholelithiasis, cholecystitis, and gallbladder polyps, ultrasound | 9-73 to 9-87, 9-91, 9-111 |
| HIDA nuclear scintigraphy | 9-88 to 9-90, 9-101 |
| Cholelithiasis, CT | 9-92 to 9-94 |
| Cholecystitis, CT | 9-95 to 9-98 |
| Biliary ductal dilatation, ultrasound | 9-99, 9-100 |
| Bile leak, CT | 9-102 |
| Cholangiography | 9-103 |
| Biliary tract obstruction and choledocholithiasis, CT | 9-104 to 9-108 |
| Pneumobilia, CT | 9-109 |
| Ascending cholangitis, CT | 9-107, 9-110 |
| Pancreatitis and complications including pseudocyst, CT | 9-112 to 9-116, 9-119 |
| Pancreatic mass, CT | 9-117, 9-118 |
| Perirectal abscess, CT | 9-120, 9-121 |
| Liver abscess, CT | 9-122 to 9-124 |
| Postoperative abdominal abscess, CT | 9-125, 9-126 |
| Metastatic disease and splenomegaly, CT | 9-127, 9-128 |
| Ascites, x-ray | 9-129 |
| Ascites, ultrasound | 9-130, 9-131 |
| Ascites, CT | 9-132 |
| Hemoperitoneum, CT | 9-133 |
| Ingested foreign body, x-ray | 9-134 to 9-137 |
| Ingested foreign body, CT | 9-138 |
| Intestinal foreign body, macroparasite, CT | 9-139 |
| Adrenal imaging, CT | 9-140 to 9-143 |
| Gastrointestinal bleeding, tagged red cell study | 9-144, 9-145 |
| Mesenteric angiography for gastrointestinal bleeding | 9-146 |
Abdominal Imaging Modalities
The most commonly used emergency department abdominal imaging modalities include plain x-ray, CT, and ultrasound. Nuclear scintigraphy and MRI are more rarely employed for selected conditions. Fluoroscopy for gastrointestinal (GI) studies and abdominal angiography have seen a decline in use with the increasing availability and diagnostic utility of CT scan for the same applications. We review each of these modalities here, pointing out some general principles about their diagnostic capabilities and limitations. These are elaborated upon in later sections on individual forms of abdominal pathology.
X-ray
Abdominal x-ray was the first abdominal imaging modality, used shortly after Roentgen’s discovery of x-ray in 1895. Unfortunately, x-ray has limited utility in abdominal imaging. The abdomen contains four principal densities: air, fat, water (soft tissues and fluids such as blood), and calcified structures (e. g., bone, vascular calcifications, and ureteral calcifications). Although x-ray can distinguish among these according to principles discussed in more detail in Chapter 5 , most pathologic processes are not well differentiated from normal findings by x-ray. Exceptions to this rule include radiopaque foreign bodies and gross bowel obstruction, as well as moderate to large amounts of pneumoperitoneum. Other inflammatory, infectious, vascular, and neoplastic abnormalities in the abdomen sometimes produce plain x-ray abnormalities, but these are inconsistently present and generally have poor sensitivity and specificity. Although early radiologists were ingenious at recognizing associations between pathology and subtle imaging abnormalities, today better imaging solutions are generally found through CT and ultrasound. Studies of abdominal x-ray generally find them to be diagnostically useful in a small minority of cases. Lack of sensitivity means that a normal x-ray does not exclude most disease processes, requiring either additional imaging or clinical observation to be performed. Similarly, lack of specificity means that many x-ray abnormalities require additional imaging confirmation before treatment can be initiated. The information required from imaging for clinical management of many abdominal conditions has grown over time, because more conditions are managed nonoperatively or with operative approaches that are tailored to specific disease features. As a consequence, abdominal x-rays should be ordered rarely. In unstable patients or patients with extremely high pretest probability of disease, portable x-rays can provide rapid information that may be adequate to determine treatment, such as laparotomy for perforated viscus. In patients with an extremely low pretest probability of disease, negative x-rays may provide adequate reassurance to allow discharge or observation without further imaging, although the emergency physician must always remember that negative x-rays do not rule out virtually any important disease process. As we discuss later, the frequently used terms rule out free air and rule out obstruction should be discarded, because they provide false reassurance based on the poor sensitivity of x-ray.
In the past, abdominal x-ray was considered a prerequisite for advanced imaging. However, for most conditions, the poor sensitivity and specificity of x-ray mean that x-rays should be avoided in patients with a moderate pretest probability of disease, because additional imaging is required in most cases, regardless of the x-ray findings. Advanced imaging should be performed without preceding x-ray in these cases.
Standard abdominal x-ray views include upright and supine anterior–posterior (AP) views ( Figure 9-1 ). The upright view is sometimes called a KUB, for kidneys, ureters, and bladder—a misnomer because none of these structures are well seen on plain x-ray, though all are included in the field of view. A “three view of the abdomen” typically adds an upright chest x-ray to this series. A left lateral decubitus AP abdominal x-ray is sometimes used as well.

The upright abdominal x-ray (AP or PA) is performed to identify air–fluid levels, suggesting bowel obstruction. Air–fluid levels also rarely may be seen with intraabdominal abscesses, though the sensitivity of x-ray for this indication is likely so low that x-ray should not performed when abscess is suspected. The upright x-ray also may demonstrate dilated loops of bowel, again suggesting bowel obstruction. X-ray findings of bowel obstruction are discussed in more detail later in this chapter. Radiopaque foreign bodies (ingested, inserted rectally, or traumatically introduced into the abdomen) can be seen on this view as well. The upright abdominal x-ray is not generally useful for detection of pneumoperitoneum, because the image is relatively overexposed and small to moderate amounts of subdiaphragmatic air are not usually visible.
The supine AP abdominal x-ray is generally less useful than the upright x-ray. On this view, dilated loops of bowel suggesting obstruction may be seen. However, air–fluid levels are not seen on the supine view, because air rises to the less dependent regions of the abdomen, layers in the plane of the x-ray film or detector, and does not form a visible interface with dependent fluids. Similarly, pneumoperitoneum rises to the anterior abdominal wall rather than the subdiaphragmatic region, layers in the plane of the x-ray detector, and is not generally visible. Radiopaque foreign bodies can be seen on this view.
The upright chest x-ray (AP or PA) is the most useful x-ray view for detection of free air (pneumoperitoneum). In the upright position, free air rises to the uppermost regions of the abdomen and collects beneath the diaphragm, forming a black silhouette between the denser liver on the right and sometimes the spleen or gastric wall on the left. The gastric air bubble on the left can be mistaken for pneumoperitoneum, a potential pitfall. Occasionally, colonic interposition (the presence of the air-filled transverse colon between the diaphragm and the liver) can also simulate free air. The sensitivity of upright chest x-ray is relatively low when the quantity of free air is small, as discussed later in this chapter. In addition, loculated free air, such as may be seen with an abscess or with a small perforation of bowel, may not rise to the subdiaphragmatic region and may therefore be invisible on x-ray.
The left lateral decubitus abdominal x-ray is occasionally used in patients who are unable to stand or to assume an upright position. The patient is placed on the left side, with the right side of the abdomen upright. An AP or PA x-ray image is then acquired. In this position, the lateral margin of the liver is the most superior abdominal organ, and free air may collect between the superior margin of the liver and the parietal peritoneal surface. The lateral decubitus x-ray can therefore substitute for an upright chest x-ray in particularly sick patients in a search for pneumoperitoneum. However, the same limitations to the sensitivity of upright chest x-ray described earlier apply to lateral decubitus x-ray. The lateral decubitus x-ray can also be used to visualize air–fluid levels, suggesting bowel obstruction. However, in most cases today, if the patient is unable to undergo a standard three-view abdominal series, CT is a more sensible emergency department imaging test, for reasons outlined later.
Systematic Interpretation of Abdominal X-ray
Later in this chapter, we review x-ray findings of specific pathology. But as we stated previously, x-ray is both insensitive and nonspecific for many important conditions. For many conditions, our purpose in reviewing x-rays and comparing them with CT and ultrasound findings is to emphasize the poor diagnostic performance of x-ray, even when findings are quite overt with other imaging modalities. Nonetheless, abdominal x-rays remain important in some practice settings where CT and ultrasound may be unavailable. Here, we review a structured approach to abdominal x-ray interpretation, intended to glean as much information as possible from the image ( Box 9-1 ).
- •
Free air
- •
Inspect subdiaphragmatic regions of upright x-ray for lucency
- •
Avoid confusion with gastric air bubble on left
- •
Free air is seen best on upright chest x-ray
- •
- •
Bowel obstruction
- •
Dilated loops of small bowel (>3 cm diameter)
- •
Dilated loops of large bowel (>8 cm diameter)
- •
Air–fluid levels
- •
Sentinel loops
- •
- •
Other pathologic air
- •
Pneumobilia (consider ascending cholangitis)
- •
Mural pneumatosis (mesenteric ischemia)
- •
Gallbladder air (emphysematous cholecystitis)
- •
Intrarenal air (emphysematous pyelonephritis)
- •
Retroperitoneal air (abscess)
- •
Peritoneal loculated air with air–fluid level (abscess)
- •
- •
Foreign bodies
- •
Surgical clips and stents (may provide clues to prior procedures in patients with unknown history)
- •
Ingested foreign bodies
- •
Shrapnel
- •
- •
Calcifications
- •
Gallbladder (calcified gallstones may be visible, though they do not confirm cholecystitis do not confirm cholecystitis; porcelain gallbladder of carcinoma has calcified rim)
- •
Appendix (appendicolith suggesting appendicitis)
- •
Vascular calcifications (abdominal aortic aneurysm and other advanced atherosclerotic disease)
- •
Renal (nephro- or ureterolithiasis)
- •
Pheloboliths (usually have a central lucency that differentiates them from ureteral stones; no pathologic significance)
- •
Pancreatic calcifications (chronic pancreatitis)
- •
Ovarian calcifications (dermoid cyst also known as teratoma may contain calcifications resembling teeth)
- •
Hepatic (neoplasm or echinococcal infection)
- •
Bladder (schistosomiasis infection)
- •
- •
Hepatosplenomegaly
- •
Enlarged silhouettes of liver and spleen
- •
- •
Ascites
- •
Diffuse ground-glass appearance, often with small bowel located centrally
- •
- •
Inflammation or hemorrhage in retroperitoneum
- •
Psoas fat stripe lost
- •
Properitoneal line lost
- •
- •
Bones (pelvis, spine, or ribs)
- •
Lytic lesions
- •
Fractures
- •
- •
Chest pathology causing abdominal symptoms
- •
Pneumonia
- •
Pneumothorax
- •
Pleural effusion
- •
Pericardial effusion
- •
As described earlier, a typical abdominal series consists of an upright chest x-ray (PA or AP), a single upright frontal projection (AP or PA) abdominal x-ray, and a supine AP abdominal x-ray. Review each of these in turn, seeking specific findings. X-rays of the chest and abdomen are typically displayed with the patient’s right side on the left side of the viewing screen.
Begin by reviewing the upright chest x-ray for pneumoperitoneum (free air). This finding is reviewed in detail in Chapter 5 . Pneumoperitoneum is visible as a black collection between the liver and the diaphragm on the right, the diaphragm and the inferior heart border medially, and the diaphragm and the stomach or spleen on the left. Air within the stomach may be mistaken for pneumoperitoneum on the left, although usually gastric air is distinguished by a thicker superior soft-tissue stripe, composed of the combination of the gastric wall and diaphragm. In contrast, when air is truly subdiaphragmatic, the diaphragm generally appears 2 to 4mm thick, depending on phase of respiration and diaphragm contraction. Free air can be minute in quantity, perhaps visible only as a thin black line, or massive, sometimes confusing novice x-ray readers by its sheer volume. Although CT is considered far more sensitive (as discussed later in this chapter), suspected free air is one of the primary remaining legitimate indications for abdominal x-rays (or more accurately, for upright chest x-ray) and thus deserves careful attention.
Next, examine the series for evidence of small- or large-bowel obstruction. Bowel obstruction is a second rational indication for abdominal x-ray, although the sensitivity of x-ray is believed to be significantly less than that of CT, as discussed later. Two key findings suggest small-bowel obstruction: dilated loops of bowel and air–fluid levels. Although normal bowel does contain both air and fluid, in the setting of obstruction, the small bowel becomes dilated to 3 cm or greater, and multiple stair-step air–fluid levels may be seen. Remember that air–fluid levels are expected only on the upright abdominal and chest x-rays; on the supine abdominal x-ray, air and fluid layer in the image plane and may not be seen. On both the upright and the supine images, small-bowel loops can be inspected for dilatation. Dilated loops of small bowel are usually recognizable by the plicae circularis (also called valvulae conniventes), which completely cross the diameter of the bowel lumen. In contrast, the haustra of the large intestine do not cross the complete width of the bowel. Large-bowel obstruction can be recognized by a dilated large bowel, measuring greater than 8 cm in diameter. Large-bowel air–fluid levels may also be seen on the upright x-ray. The distribution of gas in the bowel should also be noted. In a complete bowel obstruction, peristalsis distal to the point of obstruction may force air out of the bowel, leading to a gasless abdomen beyond the obstruction, including the rectum. If gas is present in the bowel through to the rectum, an obstruction is not ruled out, because it may be early in its course or may be incomplete. Bowel obstruction is discussed in more detail later in the chapter. Older texts describe multiple other bowel gas patterns that radiologists have attempted to correlate with other disease states, but unfortunately, these are quite nonspecific. Described gas patterns include adynamic ileus, “nonspecific bowel gas pattern,” and incomplete obstruction—but these may be present in patients with normal abdomen, true mechanical bowel obstruction, or other pathologic processes, including surgical conditions such as appendicitis and mesenteric ischemia.
Next, a series of other findings should be sought, though each is individually relatively rare and may lack sensitivity and specificity for the acute cause of the patient’s symptoms. Other pathologic air should be sought within the liver (pneumobilia), intestinal wall (mural pneumatosis intestinalis), gallbladder fossa (emphysematous cholecystitis), kidneys (emphysematous pyelonephritis), retroperitoneum, or loculated collections (abscess). Air in branching patterns particularly suggests air within abdominal ducts or vascular structures. Amorphous collections of gas can be impossible to localize, because they may represent bowel gas or extraluminal gas. Air which appears to outline both the internal and external surfaces of a loop of bowel suggests bowel perforation with extraluminal gas.
Calcifications can provide clues to disease, though again caution should be used, because calcified organs are not necessarily the acute cause of symptoms, and acutely diseased organs may lack calcifications. Calcifications may occur within the gallbladder (gallstones), kidneys or ureters (ureterolithiasis or nephrolithiasis), appendix (appendicoliths), pancreas (chronic pancreatitis), vascular structures (aortic aneurysm or other advanced atherosclerotic disease), pelvic structures (e.g., phleboliths or calcified partially formed teeth within a dermoid), liver (malignancy or echinococcal infection), and bladder (schistosomiasis). Pelvic vein calcifications (phleboliths) have no known pathologic significance but may be confused for appendicolith or ureteral calcifications. Phleboliths are usually recognizable by a tiny central lucency, not found in most other calcifications. Foreign bodies including surgical clips and stents, shrapnel, and ingested foreign bodies should be noted, because they can provide information not available from the patient history.
Sentinel bowel loops, isolated loops of bowel with localized ileus induced by adjacent inflammatory processes (e.g., pancreatitis) may hint at pathology but are neither sensitive nor specific. The silhouette of the liver and spleen may be visible and can suggest hepatomegaly or splenomegaly. Ascites may be recognized as a diffuse hazy or “ground glass” appearance, often associated with centralization of small bowel, resulting from bowel floating suspended in surrounding ascites. CT and ultrasound are extremely sensitive and specific for abdominal free fluid in comparison with x-ray, which has poor sensitivity and specificity. The psoas fat stripe can be obscured by inflammation or retroperitoneal hemorrhage, but x-ray should never be used to rule out these findings. The bones of the ribs, spine, and pelvis are visible within the field of view of an abdominal x-ray and should be assessed for lytic lesions or fractures. The chest x-ray should be scrutinized for chest pathology that may be the cause of abdominal pain, such as a lower lobe pneumonia, pneumothorax, or pleural or pericardial effusion. Interpretation of chest x-ray is reviewed in Chapter 5 .
Computed Tomography
Abdominal CT scan is one of the most diagnostically useful abdominal imaging modalities. Despite its apparent high diagnostic accuracy for many conditions, questions remain about the clinical benefit to patient outcomes from increasing CT use. We explore some controversies surrounding CT throughout this chapter, including studies of outcomes in appendicitis diagnosed with CT and risks for radiation exposure from CT. Additional controversies include indications for oral, intravenous (IV), and rectal contrast, which we elaborate upon for specific indications. Here, we consider some general features of abdominal CT, which we refine as we review specific forms of pathology.
CT of the abdomen generally includes two separately ordered radiologic studies: CT of the abdomen and CT of the pelvis. For simplicity, we refer to these as abdominal CT. Abdominal–pelvic CT usually includes a cephalad–caudad range from the top of the diaphragm to the bottom of the bony pelvis so that it includes the entire peritoneal cavity and retroperitoneum. Occasionally, a more restricted or more extended CT is indicated; we specify this in the text.
Computed Tomography Technique
CT scan is a modality that uses ionizing radiation to expose detectors mounted on the opposite side of a circular gantry through which the patient passes. A complex computer algorithm constructs an image based on the relative attenuation of the x-ray beam by body tissues. We briefly compare early and modern CT technology, because this affects the diagnostic capabilities of modern scanners and means that older research on the diagnostic utility of CT is often outdated. Early CT scanners relied on single-detector, axial data acquisition. Modern scanners rely on multidetector, helical data acquisition.
The first CT scanners used a single x-ray emitter and detector, which rotated in a single circular path around the patient to construct each axial image slice. The table upon which the patient was positioned moved in steps through the gantry, with one axial image slice acquired following each step. The final CT image was composed of a “stack” of axial CT images, like slices of a loaf of bread. The thickness of the slices could be selected, with a typical slice thickness of 5 mm for abdominal CT. Early scanners were quite slow, so choosing a slice thickness represented a necessary trade-off between the resolution required for diagnosis and the amount of time required to perform the CT scan. If one slice were acquired per second, a 1-m (1000 mm) abdomen and pelvis divided into contiguous 5-mm slices would require 200 seconds to scan. Slice thickness is one determinant of image resolution. Consider the difference between a 1-mm and a 5-mm slice. For each pixel making up the image, a 5-mm slice gathers anatomic data from pixels in 5 mm of cephalad–caudad territory and then projects the average density values into a single pixel in the final image. This results in “volume averaging,” meaning that if the 5-mm slice consists of multiple densities, the final image represents the average of those densities, rather than reflecting the true range of densities. In comparison, a 1-mm-thick slice averages the density values across only a 1-mm cephalad–caudad distance to generate the final image pixel. Thus relatively thick slices result in more volume averaging and can miss small pathology. For most abdominal pathology, a 3- to 5-mm slice thickness is adequate; very small abnormalities such as 1-mm renal stones might be missed by thick slices, although the clinical significance of such minute abnormalities is uncertain.
Because the patient table was stepped incrementally through the CT gantry with early CT technology, gaps existed between axial images using this technique, creating the possibility of missing small pathology lying between axial slices. Moreover, if an image in a plane other than the axial plane was desired, the gaps between the axial slices and the thickness of the axial data resulted in pixelated sagittal and coronal reconstructions marked by stair-step artifacts, with limited diagnostic utility.
Modern scanners rely on two major innovations to resolve these issues. First, modern scanners employ helical scanning, in which the patient table moves continuously through the CT scanner gantry. Although the gantry rotates in a simple circular pattern, the motion of the table through the gantry creates a helical (or spiral) pattern relative to the patient. As a consequence, a three-dimensional volume of image data is acquired across the entire cephalad–caudad extent of the abdomen, rather than the data consisting of a discontinuous stack of discrete axial slices. We explore the importance of this in a moment. The second innovation was an increase in the number of detectors; 16 and 64 detectors are common today, and even higher detector numbers are available (256 in some scanners). More detectors means that image data can be collected as thinner slices, while maintaining or improving the speed of the image acquisition. For example, if 64 detectors each collect 5 mm of cephalad–caudad anatomic data per gantry rotation, only three gantry rotations are required to cover 1 m of cephalad–caudad anatomy. Even if each detector is configured to acquire only 1 mm of anatomic data, because 64 detectors are at play, each gantry rotation can acquire 64 mm of anatomic data. Compare this with a single-detector CT scanner, which would acquire only 1 mm of cephalad–caudad anatomic data per rotation. Therefore modern multidetector, helical CT scanners can rapidly acquire “thin slice” three-dimensional volumes of anatomic data, free of data gaps and less subject to volume averaging. These three-dimensional volumes can be “resliced” in any plane, readily allowing axial, sagittal, and coronal planar reconstructions or true three-dimensional image reconstruction. Although axial images remain the primary images used diagnostically, some studies have examined the value of other imaging planes to detect pathology such as appendicitis.
One more feature of helical thin-slice CT technology bears mention. Although data can be acquired at very thin “slice thickness” (really, the width of anatomy projected onto each detector), it would be impractical to display all acquired data. For example, if each detector is set to capture 1 mm of anatomy thickness, and if the resulting data were displayed as 1-mm “thick” axial images, a single CT of a 1-m-long abdomen and pelvis would be composed of 1000 slices. Radiologists typically make compromises between the pragmatic need to have fewer images for review and the need to diagnose subtle pathology. Usually data is captured at a detector width compatible with the expected pathology and then displayed as thicker slices to reduce the number of resulting images. For example, if aortic dissection is suspected, data may be acquired at 1-mm detector width and then displayed as a series of 3- to 5-mm “thick” axial images. If more image detail is required at a particular anatomic area, the original 1-mm-thick data can be reconstructed selectively as thinner slices spanning that location.
Patient Positioning for Computed Tomography
During a CT scan, the patient is usually positioned supine on the scanner table. Some protocols use prone positioning—a common example is a “renal stone” protocol CT. The patient’s position during the CT has important effects, for example, changing the expected locations of free air when compared with a conventional x-ray obtained with the patient in an upright position. These effects are discussed in more detail in sections that follow on specific pathologic conditions.
The Hounsfield Computed Tomography Density Scale and Tissues
In other chapters, we discussed the Hounsfield scale of CT densities, but it is particularly important in the abdomen. We review the general principles here, because they can assist you in problem-solving for both common and unusual pathology addressed later in this chapter.
The Hounsfield scale (named for one of the Nobel Prize–winning inventors of CT, the British physicist Godfrey N. Hounsfield) arbitrarily assigns water a density of 0 Hounsfield units (HU) and air a value of −1000 HU. Dense materials such as bone have density values approaching +1000 HU. The Hounsfield density of tissues reflects their attenuation of x-ray and is proportional to their physical density. To illustrate the relative density of common body tissues encountered in the abdomen and their CT appearance, imagine a glass of water into which various materials are placed. Air is less dense than water and remains suspended above the column of water. Oil (fat) floats on water, because it is less dense. A piece of meat (soft tissue) dropped into the water would sink to the bottom of the glass, because it is slightly denser than the water. Soft tissues are surprisingly similar in density to water—surprising until we consider that tissues are composed of cells, which are composed largely of water. A bone dropped into the water would sink readily to the bottom, because it is comparatively quite dense. Liquid blood has a density that is intermediate between simple water and soft tissues. This intermediate density makes perfect sense when we recall that blood is a “liquid tissue,” composed of about 40% red blood cells (the hematocrit of the blood) and about 60% serous liquid (essentially water), with a small contribution from other cell types.
Windows and the Hounsfield Scale
The color scale assigned to tissues of various densities with CT can be varied to accentuate different tissues, a process called “windowing.” The CT color scale is a gray-shade scale, from black to white. Less dense tissues appear blacker, denser tissues appear whiter, and tissues with intermediate densities occupy intermediate gray shades. Because the human eye and brain cannot perceive subtle variations in gray shades, it is usually not useful to distribute the available gray shades uniformly across the full range of densities when displaying the image. Instead, the distribution of the gray shades is varied depending on the tissue of greatest interest. In the case of abdominal structures, the most common window setting (a “soft-tissue” window) uses a fairly widely distributed gray scale, because the abdomen contains materials of highly variable density, from the normal air in the bowel (−1000 HU) to the subcutaneous, peritoneal, and retroperitoneal fat (-50 to -100 HU), to the liquid bile and blood (~+20 HU), to muscles and abdominal solid organs (~+40 to +100 HU), to the bones of the vertebral column, pelvis, and ribs (~+200 to +1000 HU) ( Figures 9-2 and 9-3 ).


The lung window shifts the gray scale to accentuate the appearance of tissues of very low density—air and lung tissue (see Figure 9-2 ). Although this window setting is designed to allow inspection of the lung parenchyma and to allow the differentiation of lung from surrounding pneumothorax, it is extremely useful in inspection of the abdomen, pelvis, and retroperitoneum for pathologic air or gas. On a typical soft-tissue window setting, small areas of abnormal air can be difficult to identify, because air (black on this setting) can appear similar to fat (a dark gray shade, depending on the exact window setting). On a lung window setting, all tissues except air or gas appear quite bright (white or nearly white) by comparison, drawing attention to air, which remains black. Even tiny quantities of free peritoneal air can be readily recognized using this setting. Air in other abnormal locations can also be more readily identified.
Throughout this chapter, unless otherwise specified, the appropriate window to evaluate for pathologic findings is the soft-tissue window. A window is defined by a center value and a width. The center value is the Hounsfield density to which the middle gray shade is assigned. The width is the number of Hounsfield units around the center value to which the brightest and darkest shades in the grayscale are assigned. The precise values used for soft-tissue and other window settings may vary from institution to institution, but common values are shown in Table 9-2 .
| Window | Center | Width |
|---|---|---|
| Lung | −498 HU | +1465 HU |
| Bone | +570 HU | +3077 HU |
| Soft-tissue | +56 HU | +342 HU |
| Brain | +40 HU | +200 HU |
Fat and Air as Contrast Agents
We soon discuss extrinsically administered contrast agents, but it is useful first to consider intrinsic contrast provided by normal differences in body tissue density. When we look at a CT image, we cannot distinguish two structures in physical contact with one another that share identical ( or even similar) densities. When a tissue of a different density intervenes, the transition from one tissue to another is clearly demarcated—tissue contrast. Because air or gas is dramatically less dense than other body tissues (−1000 HU, compared with the least dense competing tissue, fat, ~−50 HU), it provides outstanding tissue contrast. As a consequence, air can be recognized without the administration of any exogenous contrast agents. CT is therefore exquisitely sensitive for the detection of abnormal air or gas, as we discuss later in the section on pneumoperitoneum and other conditions in which pathologic gas assists in diagnosis.
A second key intrinsic contrast agent is fat. Again, fat is quite different in density from most other abdominal tissues and can separate other organs of similar density (see Figures 9-2 and 9-3 ). Fat is normally present in subcutaneous tissue, within the peritoneum, and in the retroperitoneum. In these locations, it separates normal organs from one another, allowing us to recognize individual loops of bowel in the abdomen or the demarcation of retroperitoneal organs such as the psoas muscles and kidneys, even without the addition of exogenous contrast agents. In the thinnest patients, a paucity of peritoneal and retroperitoneal fat is a diagnostic disadvantage, potentially increasing the necessity of exogenous contrast agents ( Figure 9-4 ). In patients of average or somewhat above-average body mass index, fat actually provides helpful tissue contrast and may decrease the need for extrinsic contrast. Fat becomes a disadvantage in extremely obese patients, in whom it contributes to excessive image noise ( Figure 9-5 ). Some very obese patients may actually exceed the CT scanner weight, size, and x-ray tube capacity, as described later.


Fat Stranding
Fat provides an additional diagnostic benefit, acting as the substrate for inflammatory fat stranding (see Figure 9-5 ). When inflammation occurs, microscopic lymphatic vessels within fat become relatively leaky, and the water content of adipose tissue increases. Because water is denser than normal fat, increasing the water content of adipose tissue increases its density. As you can anticipate from our earlier discussion of density, increasing the density of a tissue increases the brightness or whiteness of the tissue on the CT image. Normal fat appears dark—nearly black on a standard soft-tissue window setting. Therefore inflamed fat appears whiter, assuming a smoky or hazy gray appearance called fat stranding. In the presence of an infectious or inflammatory process such as appendicitis, diverticulitis, cholecystitis, or colitis, the fat around the affected organ often demonstrates stranding, which can be a key diagnostic finding in these scenarios. In patients with little or no peritoneal fat, there is no substrate for stranding, and the diagnosis of these conditions can be difficult. For these reasons, “fat is our friend” in CT diagnosis. (The origin of this phrase is uncertain— the author’s father is the only source known to him ). Because inflammatory fat stranding accompanies many forms of acute abdominal pathology, where there is “smoke” (fat stranding) there is often “fire” (acute pathology).
Free Fluid
Free fluid deserves special discussion, partly because the familiarity of many emergency physicians with ultrasound might lead to confusion when interpreting CT scan. On ultrasound images, simple fluid appears black. On an abdominal CT image viewed on a typical soft-tissue window, simple fluid appears intermediate gray—a shade usually indicating a solid organ on ultrasound images. On this same CT window setting, air appears black and fat appears dark gray, or nearly black. If you are an emergency physician with extensive ultrasound experience, until you have become accustomed to viewing abdominal CT, you may mistakenly see fat as “fluid” on CT images and see fluid as “solid tissue.”
Free fluid on CT can have several diagnostic meanings, depending on the scenario. Because CT differentiates tissues based on density and x-ray attenuation, CT cannot perfectly distinguish types of simple fluids (new advances in dual-energy CT, discussed later in this chapter, may help to alleviate this shortcoming). For example, blood, bile, purulent fluid, and ascites may differ in density by only a few Hounsfield units, depending on factors such as the hematocrit of the blood. As discussed in Chapter 10 , Chapter 12 , in the setting of trauma, free fluid may be blood from solid-organ injury, fluid from bowel injury, or urine or bile resulting from injury to the relevant organ systems. In the setting of nontraumatic abdominal pain, fluid may be blood, ascites, purulent fluid, bile, or urine—clinical history, as well as other CT abnormalities, may help to narrow the differential diagnosis. Free fluid can be seen in infectious and inflammatory conditions, as well as mesenteric ischemia and bowel perforation. Although nonspecific, it is a potentially important sign of pathology and should be sought carefully. We discuss free fluid in more detail when we cover individual forms of pathology.
Computed Tomography Contrast Agents
As we discuss in more detail later in this chapter, considerable controversy exists about the need for contrast agents for some clinical indications, such as suspected appendicitis. In this section, we describe the core roles of contrast agents. Later we critically examine the need for contrast when evaluating for specific pathology. Contrast agents typically used for abdominal CT include IV contrast, oral contrast, and more rarely, rectal contrast. In rare circumstances, contrast agents may be instilled retrograde into the bladder—this is discussed in detail in Chapter 12 .
IV contrast agents are usually injected through a peripheral IV catheter. These contrast agents “go with the flow”; consequently, they highlight anatomic structures and pathologic processes with high blood flow. These include vascular structures; highly vascular end organs such as the kidneys, liver, and spleen; neoplastic processes; and inflammatory and infectious processes. Iodinated contrast agents are high in density, so organs receiving these agents experience an increase in their tissue density, called enhancement ( Figure 9-6 ). The degree of enhancement depends on blood flow, so organs like the kidneys (receiving approximately 25% of the cardiac output) enhance intensely. Similarly, an infectious or inflammatory process typically receives increased blood flow and shows more enhancement than normal tissues. Sometimes a pathologic failure to enhance is diagnostic; for example, a renal infarction results in decreased blood flow and decreased tissue enhancement, which is readily evident when compared with areas of normal enhancement. IV contrast delineates the lumen of vascular structures, so stenoses or filling defects can be recognized. Without IV contrast, liquid blood within a blood vessel, thrombus adherent to the walls of the blood vessel or lodged within the vessel, and intimal defects such as the intimal flap of aortic dissection all share the same or similar densities and are indistinguishable on CT. When contrast is injected, the liquid-filled lumen of the vessel enhances, and “filling defects” within this channel become visible—including thrombus and dissection flaps. One more role of IV contrast is to identify areas of active hemorrhage or contrast extravasation. Contrast should not be seen outside of the blood vessels or the confines of vascular end organs. An amorphous “blush” of contrast outside of these locations indicates active bleeding at the moment that the CT scan was performed—usually an indication for some emergent intervention. Finally, IV contrast is concentrated and excreted by the kidneys and ultimately fills the ureters and bladder. Sometimes “delayed” CT images are obtained to visualize the excretion of injected contrast, as described in more detail in Chapter 12 .

Intravenous Contrast Timing
Contrast injected into a peripheral vein should not allow immediate visualization of arterial structures or end organs. Depending on the vascular bed, organ, or pathology of interest, the timing of CT image acquisition relative to the moment of contrast injection is adjusted, allowing sufficient time for the injected contrast to traverse the right heart and lungs, enter the left heart and aorta, fill arteries, and reach target organs. For some disease processes, the timing of contrast is relatively unimportant. These include fixed structural abnormalities or inflammatory processes, for which the degree of enhancement may be less crucial. For other disease processes, contrast timing is critical. For example, for evaluation of mesenteric ischemia, contrast is desired first in the mesenteric arterial system and then in the portal venous system, because either may be affected. CT images are typically acquired first during the arterial phase, and then (after a delay of 60-90 seconds) additional images are acquired during a portal venous phase. Some neoplastic processes have characteristic enhancement properties when early, middle, and late phases of enhancement are compared on subsequent CT images, although these are generally not emergency department time-dependent diagnoses. Modern CT scanners use software to assist contrast timing, a process described in more detail in Chapter 7 . As you can see, the timing of CT image acquisition relative to IV contrast administration can have diagnostic importance, so communication of the differential diagnosis to the radiologist is necessary to maximize diagnostic accuracy. A “generic” CT scan of the abdomen typically uses a delay of approximately 25 seconds, resulting in arterial-phase enhancement of organs. Some scanners use automated triggering software, which initiates the CT scan when the enhancement of the aorta or other target organs reaches a specific Hounsfield unit threshold, rather than using a fixed delay. This can provide better enhancement, because the rapidity of enhancement depends on factors such as the caliber and the location of the catheter used to infuse contrast, which vary from patient to patient.
Enteral Contrast (Oral and Rectal)
Enteral contrast has several potential functions. Contrast can be administered into the intestine orally, by nasogastric or orogastric tube, or rectally (as described in more detail later). Enteral contrast agents can be “positive,” “neutral,” or “negative” contrast agents. The most common form of enteral contrast for emergency applications is positive contrast—meaning contrast that is radiographically dense and appears white on typical soft-tissue CT windows. Positive contrast agents include iodinated contrast agents such as Gastrografin (meglumine diatrizoate) and barium sulfate contrast agents, which can be used in patients with allergy to iodinated contrast agents. These have high density, positive on the Hounsfield scale. Neutral contrast agents are similar in density to water (~0 Hounsfield units) and include (not surprisingly) water, and Volumen, a low concentration barium suspension (0.1% barium). Although water is an excellent contrast agent, it is rapidly absorbed from the intestine and therefore is of little use in the jejunum and ileum. Negative contrast agents are actually lower in density than water and include gases such as carbon dioxide, used for applications such as CT colonography, that are not typically employed in the emergency department. We discuss the theoretical benefits of each type of contrast later.
All enteral contrast agents share two common properties: they distend the lumen of small and large bowel, and they distinguish bowel from “nonbowel” abdominal structures that may otherwise appear similar. The normal small bowel is a tubular structure, usually filled with some combination of fluid (near water density, 0 Hounsfield units, or moderately dark gray on soft-tissue CT window) and air (−1000 Hounsfield units or black on all window settings). Depending on the orientation of the bowel and the image plane, the small bowel may appear circular, elliptic, or tubular in cross section. Pathologic processes adjacent to the bowel can sometimes be difficult to distinguish from the normal bowel in the absence of positive enteral contrast, because they may have a similar appearance. For example, an abscess cavity adjacent to the bowel could have a similar appearance, with a circular cross section filled with dark gray fluid (pus) and air (black). Therefore one potentially important role of positive oral contrast agents is to identify the bowel, allowing structures that fail to fill with oral contrast to be identified as nonbowel structures.
A second potential role of positive enteral contrast is to identify a point of obstruction of the bowel. Conceptually, if the bowel is obstructed at a single point, orally administered contrast (or contrast given by nasogastric or orogastric tube) should fill the bowel to the point of obstruction but pass no farther; therefore oral contrast might be valuable in identifying not only the presence of an obstruction but also the exact location of the obstruction. In reality, oral contrast appears to be unnecessary in most cases of obstruction, as described in more detail later in this chapter in the section titled “Oral Contrast Agents and Computed Tomography of Suspected Small-Bowel Obstruction.” The reason is simple: the bowel almost always contains some intrinsic neutral contrast composed of a slurry of swallowed saliva, partially digested food, and GI secretions. If the bowel is obstructed, it will appear distended, with this neutral contrast proximal to the point of obstruction. Distal to the point of obstruction, intestinal peristalsis will move this “contrast” farther along and the bowel will not appear distended.
A third potential role of positive enteral contrast is to reveal intestinal perforation. If enteral contrast is administered and then seen to collect in the peritoneal cavity, outside of the apparent lumen of the bowel, perforation can be diagnosed. As is the case for bowel obstruction, this theoretical advantage appears to be less useful in reality. Most intestinal perforations are likely fairly small, limiting the likelihood that enteral contrast would actually leak out of the bowel lumen. In addition, if a point of perforation is located not in a dependent loop of bowel but rather at a higher point (with the patient in the typical supine position for CT), enteral contrast may fail to leak out of bowel. Studies in the setting of blunt trauma show oral contrast to have limited or no utility in the diagnosis of bowel injury, as described in detail in Chapter 10 . Nonetheless, large perforations of bowel, or fistulas connecting the bowel lumen to other structures or cavities, might be revealed by positive enteral contrast.
Distension of bowel with enteral contrast can be important for determining the thickness of the bowel wall. Bowel wall thickening can suggest inflammation (as in infectious colitis or inflammatory bowel disease), ischemia (as in ischemic colitis or “shock bowel”), or a mass lesion (as in a sessile colonic polyp or small-bowel lymphoma). Without enteral contrast agents, the bowel may be relatively nondistended or even fully collapsed. In these cases, the thickness of the bowel wall can be difficult to estimate, because the wall may be folded upon itself or simply thickened because of lack of distension. Enteral contrast agents distend the bowel, helping to resolve this issue. Positive enteral contrast agents can obscure some details of the bowel wall, because they are extremely dense relative to the bowel and can create image artifacts. Negative or neutral contrast agents may be more useful in depicting the bowel wall structure and the mucosal surface, but these agents are relatively rarely used today in emergency medicine.
Positive enteral contrast agents can obscure diagnostically important abnormalities of bowel wall enhancement with IV contrast. Bowel wall enhancement usually occurs to a limited extent in normally perfused bowel. Increased bowel wall enhancement indicates increased blood flow, which can be seen in infectious and inflammatory states, including appendicitis. Decreased enhancement can indicate hypoperfusion, for example, in a closed-loop bowel obstruction or embolic mesenteric ischemia. When positive enteral contrast is present immediately adjacent to the bowel wall, the degree of bowel wall enhancement with IV contrast can be obscured. As we discuss later in this chapter, positive enteral contrast can be relatively contraindicated for this reason when bowel wall enhancement is predicted to play an important role in the patient’s diagnosis.
Positive enteral contrast agents also obscure extravasation of injected contrast agents into the bowel lumen, because both are quite dense and appear white on an soft-tissue CT window. Some new CT protocols for diagnosis of acute GI bleeding therefore do not use enteral contrast agents. We discuss these in more detail later in this chapter.
Finally, enteral contrast agents can assist in recognition of mass lesions within the bowel—though these are not usually emergency department diagnoses. When a contrast agent is used to distend the bowel and fill its lumen, mass lesions such as polyps are visible as “filling defects” within the bowel lumen. Accurate diagnosis of bowel mass lesions such as polyps requires a cleansing bowel prep to remove stool, which could otherwise have a similar appearance. Some protocols for CT colonography take an additional step, with the patient ingesting a contrast agent to “tag” stool with positive contrast, allowing any residual stool to be recognized. Usually such protocols use carbon dioxide gas as the negative enteral contrast agent to distend the bowel. Gases including atmospheric air and carbon dioxide appear black on CT, providing outstanding contrast against soft tissues. Carbon dioxide is often used, because it is rapidly reabsorbed from the gut lumen and exhaled, limiting discomfort from intestinal distension.
Rectally administered enteral contrast is rarely used for CT in the emergency department, but it has some putative benefits. The same potential advantages of enteral contrast agents described earlier apply to rectal contrast. Rectal administration of contrast can allow rapid opacification of the distal bowel without waiting for the transit of orally administered contrast, which can take hours, depending on factors such as the speed of intestinal peristalsis and the presence of ileus. Some protocols use rectal contrast for detection of appendicitis or diverticulitis for this reason. In cases of penetrating torso trauma, rectal contrast has been advocated by some radiologists to assist in detection of colonic perforation, because leaking contrast into the pelvis, peritoneum, or retroperitoneum might thus be seen. Rectal contrast could be useful in detection of perirectal or sigmoid abscesses by differentiating the bowel lumen from an adjacent fluid- and gas-filled abscess. Whether rectal contrast is necessary in these cases is discussed in more detail for individual conditions later in this chapter. Rectal contrast is usually administered as a retention enema of 400-800 mL of Gastrografin (3% meglumine diatrizoate–saline solution) through a rectal tube. The contrast is infused under gravity pressure only from a height of 3 feet over 2-4 minutes.
Urinary Contrast Agents
Urinary contrast agents can be instilled into the bladder through a catheter for detection of bladder rupture or mass lesions, as discussed in Chapter 12 .
Weight and Size Limits of CT Scanners
Obese patients may be unable to undergo CT scan because of physical constraints of equipment. Three factors can limit CT. First, the table upon which the patient is positioned typically has a weight limit of 450 to 650 pounds (200-295 kg). Second, the CT gantry (the circular opening through which the patient must pass for imaging) is typically 70 cm in diameter, though some manufacturers offer 90-cm models for obese patients. Patients with an abdominal or chest diameter extending this size cannot undergo torso CT. Third, increasing patient size requires increased x-ray energy to penetrate the patient. Occasionally, problems with excessive heating of the x-ray tube may be encountered. Medical mythology suggests that obese patients can be transferred to the local veterinary hospital or zoo for CT imaging. This is not true for several reasons. CT scanners are not manufactured for animal imaging; most zoo and veterinary scanners are human CT scanners modified for veterinary use. Consequently, the gantry size remains a limiting factor, as described earlier. However, some veterinary scanners do have modified tables with higher weight capacities, allowing imaging of equine limbs. Most animal facilities are not licensed for imaging of human patients.
Contrast Injection Rate and Venous Catheter Size
The rate of contrast injection is important in vascular applications of abdominal CT. For CT angiography (CTA), rates of 4 to 5 mL per second are desirable to achieve sufficient opacification of vascular structures and thus allow recognition of filling defects, intimal flaps, and stenotic regions. Standard angiocatheters of a 14- to 20-gauge size are capable of achieving flow rates of 5 mL per second with power injectors using a pressure limit of 325 psi. Catheters that are 22 gauge and smaller do not reach the desired flow rate before exceeding the safe pressure limit and are therefore not adequate for CTA. Flow rates through catheters are inversely proportional to the catheter length and directly proportional to the radius raised to the fourth power, so a short, large-bore catheter is desirable for CTA. For nonangiographic applications, contrast flow rates are less important, and smaller catheters may be sufficient.
Contrast Controversies
We discussed in general terms the potential value of contrast agents in CT. Given the hypothetical advantages of IV and enteral contrast, why would we not administer these agents to all patients before abdominal CT? As we review here, vascular contrast agents have dangers of contrast reaction and nephrotoxicity. Enteral contrast agents are rarely associated with contrast reaction but result in diagnostic delays that can be significant to the individual patient and are problematic for efficient emergency department flow. Increasing evidence suggests that contrast agents may be unnecessary for many diagnoses, as we discuss in the sections on specific pathology.
Reactions to Iodinated Vascular Contrast
Contrast reactions are sometimes called contrast allergies, although the specific mechanism of these reactions is thought to be anaphylactoid, not mediated through true allergy. Nonetheless, from a practical clinical standpoint, they have effects much like those of true allergies and are treated similarly.
Incidence and Severity of Contrast Reactions
The incidence of contrast reactions with modern, low-osmolality, nonionic, contrast agents is very low, with mild reactions (e.g., urticaria or itching) occurring in about 3% to 15% of exposures. More severe reactions such as hypotension or respiratory distress occur in only about 0.04% to 0.004% of exposures. Fatalities are extremely rare (about 1 in 170,000 exposures). Older ionic and high-osmolality agents were more dangerous, with more frequent severe reactions, but are infrequently used today.
Predicting Contrast Reactions: Risk Factors
Reactions to iodinated contrast agents are likely not caused by actual allergy to iodine. Elemental iodine is essential to human life, and allergy to iodine is unlikely. Similarly, seafood allergy is probably not related to iodine allergy and is instead thought to be mediated through protein allergens found in seafood. However, patients with severe prior allergic reactions to any allergen (including peanuts and hymenoptera sting) have an increased risk for contrast reaction. Patients with severe asthma also have an increased risk for contrast reaction. When possible, iodinated injected contrast should be avoided in these patients. Enteral contrast agents are minimally absorbed from the GI tract, and allergy to these agents is thought to be rare. Although enteral contrast agents can likely be used safely in patients with significant allergies to intravenous contrast, if concern exists about possible reaction to iodinated material, barium sulfate contrast agents can be used instead of iodinated contrast, eliminating the concern for a contrast reaction.
Preventing Contrast Reactions: Choice of Contrast Agent and Premedication
When contrast reaction is a concern, because of either prior reaction to a contrast agent or severe allergy to another allergen, contrast should be avoided if possible. If the diagnosis requires injected contrast administration and cannot reasonably be made using noncontrast CT or another imaging modality, such as ultrasound or magnetic resonance imaging (MRI), an attempt at prophylaxis can be made using one of several published medication protocols (reviewed in Box 7-5 ).
The severity of a contrast reaction cannot be predicted based on prior reactions. Some patients with prior mild reactions progress to life-threatening reactions on reexposure.
Treating Contrast Reactions
Contrast reactions should be treated like true allergic reactions. Administration of the contrast agent should be discontinued immediately. Treatment of allergic reactions is beyond the scope of this text, but epinephrine should be given for severe reactions, and IV fluid resuscitation, airway management, corticosteroids, and antihistamines should be used as for other allergic reactions.
Contrast Nephropathy
Contrast nephropathy is a serious potential consequence of exposure to iodinated vascular contrast. It is a leading cause of in-hospital renal failure, occurring in 150,000 cases per year in the United States. Contrast nephropathy is defined by a 25% increase in baseline creatinine or an absolute increase of 0.5 mg/dL within 48 hours after the administration of iodinated contrast. Less than 1% of patients experiencing contrast nephropathy require dialysis. Contrast nephropathy is discussed in detail in Chapter 7 .
Predicting Contrast Nephropathy
Patients with poor glomerular filtration rates (creatinine clearance) below 60 mL per minute are at increased risk for developing contrast nephropathy. The creatinine clearance, not the measured serum creatinine, is a better measure of risk for contrast nephropathy. Creatinine clearance is easily calculated with standard formulas or with online clinical calculators. Creatinine clearance depends on multiple factors, in addition to measured serum creatinine, including age, gender, race, and mass (particularly lean muscle mass, the source of creatinine). In one study, use of the measured serum creatinine as a screen for risk for contrast nephropathy would have missed a significant proportion of at-risk patients: 55% with a creatinine cutoff of 1.8 mg/dL, 40% with a creatinine cutoff of less than 1.5 mg/dL (the most commonly accepted cutoff for contrast administration), 19% with a threshold of 1.2 mg/dL, and 9% with a creatinine cutoff of 1.0 mg/dL.
Other factors predicting risk for contrast nephropathy include diabetes, hypertension, congestive heart failure, diuretic use, and age older than 70 years. The American College of Radiology (ACR) recommends measuring serum creatinine before intravascular administration of iodinated contrast for the indications listed in Box 9-2 .
Patients taking metformin are at risk for lactic acidosis following administration of vascular contrast, though this condition is extremely rare in patients with normal renal function. The risk is mediated through worsened renal clearance of metformin. Patients should be advised to discontinue metformin use for 48 hours after contrast administration. Patients with normal renal function can resume metformin use without having their creatinine rechecked. Patients with known renal dysfunction should be treated more cautiously, with creatinine being reassessed before resuming metformin use.
- •
History of “kidney disease” as an adult, including tumor and transplant
- •
Family history of kidney failure
- •
Diabetes treated with insulin or other medications prescribed by a licensed physician
- •
Paraproteinemia syndromes or diseases (e.g., multiple myeloma
- •
Collagen vascular disease (e.g., scleroderma, systemic lupus erythematosa)
- •
Prior renal surgery
- •
Certain medications:
- •
Metformin or metformin-containing drug combinations
- •
Chronic or high dose use of non-steroidal anti-inflammatory drugs
- •
Regular use of nephrotoxic medications, such as aminoglycosides
- •
All inpatients
- •
Preventing Contrast Nephropathy
In patients with elevated risk for contrast nephropathy, iodinated vascular contrast should be avoided whenever possible. In some cases, the diagnosis can be made using CT without vascular contrast or other modalities, such as ultrasound or MRI. MRI with gadolinium contrast has its own risks in patients with poor renal function, as detailed in Chapter 15. When the severity and acuity of the suspected diagnosis demand IV contrast despite its risks, measures can be taken to mitigate the risk for contrast nephropathy. IV hydration with sodium chloride has been well studied and reduces the risk. The ACR recommends administering normal saline at 100 mL per hour for 6 to 12 hours before and 4 to 12 hours after IV contrast administration. Pretreatment and posttreatment of this duration are not feasible for most emergency department patients; however, efforts should be made to hydrate the patient before and after CT using saline boluses. Saline boluses have been shown to be equivalent to sustained overnight saline infusions when the outcome considered is change in creatinine at 24 and 48 hours, though a higher rate of transient creatinine increase is seen with boluses. An initial study of sodium bicarbonate administration appeared promising, but a methodologically strong randomized controlled trial showed no benefit of sodium bicarbonate compared with saline hydration. Trials of N -acetylcysteine (NAC) have shown a small reduction in the degree of temporary creatinine elevation experienced by patients, although no trials have shown improvements in important patient outcomes such as permanent renal injury, progression to dialysis, or death. Most studies of NAC are in the setting of outpatient cardiac catheterization and allow 24 hours of oral pretreatment, which is not possible in the emergency department. A single trial compared saline prehydration (12 hours pre contrast and postcontrast) with IV NAC (150 mg/kg in 500 mL of normal saline) 30 minutes before contrast administration and 50 mg/kg in 500 mL of normal saline for an additional 4 hours after contrast. This showed a reduction in serum creatinine but no difference in patient-oriented outcomes. Prophylactic measures to prevent contrast nephropathy are summarized in Chapter 7 , Box 7-7.
The risk for contrast nephropathy is related to the type of contrast agent used; low-osmolality, nonionic contrast poses a lower risk than high-osmolality, ionic contrast. The risk is also dose-related. Therefore discussion with the radiologist about measures to reduce the contrast dose should be considered. One such method, the saline-chaser method, reduces the contrast dose from 150 to around 75 or 100 mL while maintaining enhancement quality.
Dialysis Patients and Iodinated Intravenous Contrast
Iodinated IV contrast agents are safe in patients receiving long-term hemodialysis for renal failure. Because these patients already have severe and irreversible renal dysfunction, contrast agents do not pose any additional risk for contrast nephropathy. In addition, the volume of contrast given is usually no more than 120-150 mL and does not generally pose a threat of vascular volume overload and pulmonary edema. Patients should be dialyzed as usual but do not require emergency dialysis following iodinated contrast administration. This should not be confused with the situation for gadolinium contrast agents used for MRI. As discussed in Chapter 15 these agents pose a small but potentially life-threatening risk in patients with end-stage renal disease, including dialysis patients. Gadolinium should be avoided in these patients whenever possible, and dialysis should be performed as soon as possible after any administration of gadolinium.
Intravenous Contrast in Pregnancy
Intravascular iodinated and gadolinium contrast crosses the placenta, is excreted into the urine, enters the amniotic fluid, and is subsequently swallowed by the fetus. A small amount may then be reabsorbed from the fetal intestine and recycled throughout the duration of pregnancy. Animal studies have shown no mutagenic or teratogenic effects, but studies in pregnant women are lacking. The ACR recommends that these contrast agents be avoided when possible during pregnancy and that informed consent from the mother be obtained. A small study found no effect on neonatal thyroid function of in utero exposure to nonionic iodinated vascular contrast for CT.
Other Contraindications to Intravenous Iodinated Contrast
A number of other potential contraindications to intravascular iodinated contrast have been reported, though the evidence supporting these is limited. Intravascular iodinated contrast can exacerbate thyrotoxicosis and may decrease uptake of radioactive iodine used to ablate abnormal thyroid tissue (including carcinomas) by up to 50% 1 week after contrast administration. Increased serum catecholamine levels can occur in patients with pheochromocytoma receiving high-osmolality contrast but not after receiving nonionic contrast. Sickle cell anemia is believed to increase the risk for acute contrast reactions. The ACR Manual on Contrast Media is freely available online and provides summarized guidelines, including contraindications to contrast administration.
Can Administration of Intravenous Contrast Disguise Pathology?
Administration of IV contrast can make recognition of high-density calcified structures more difficult or impossible, because calcium and iodinated contrast have identical CT appearances, with Hounsfield densities in the several hundreds. Some medical centers routinely perform noncontrast CT first, before CT with IV contrast, to allow recognition of preexisting calcifications. Unfortunately, this doubles the radiation exposure for the patient, which may not be justified by the additional information gained in most cases. In the emergency department, a frequent concern on the differential diagnosis is urolithiasis, a diagnosis for which IV contrast is not required. If other concerns such as appendicitis or abscess exist and the decision is made to administer IV contrast for these indications, recognition of isolated ureteral calcifications may be impaired. Depending on the timing of the CT scan (as discussed earlier), IV contrast may be excreted into the ureters and hide small nonobstructing ureteral stones. However, diagnostic findings of hydroureter and hydronephrosis will remain visible. In the event of a large obstructing renal stone, typically contrast will not be excreted into the affected ureter, so the stone will remain visible. CT for urolithiasis is discussed in more detail in Chapter 12 .
Dual-Energy Computed Tomography
A new CT technique called dual-energy or spectral CT may eliminate some of these issues of obscuration of native tissues by exogenous contrast agents of similar density. In dual-energy CT, two x-ray tubes are used to scan the patient simultaneously, using two distinct x-ray voltages and x-ray tube currents. The combination of absorption spectra of a material at different energy levels of incident radiation gives the material a unique signature, allowing differentiation of two materials of similar density that may appear identical with conventional CT. This process could allow digital subtraction of iodinated contrast from an image, revealing calcifications having a different absorption spectrum. Bone structures can also be digitally removed, improving CTA. Although dual-energy scanners are commercially available, research into their applications is limited and they have not yet entered wide clinical use.
Controversies Around Oral Contrast
Oral contrast use for abdominal CT is a topic of significant controversy. Garra et al. noted that the median interval required to consume 2 L of oral contrast was more than 100 minutes, with no significant difference between patients randomized to receive a prophylactic antiemetic and those receiving placebo. Consequently, oral contrast use can substantially increase the length of stay of an emergency department patient. For that individual, oral contrast use may lead to a delay in diagnosis, which could be clinically important for conditions such as appendicitis or, more critically, for vascular pathology such as abdominal aortic aneurysm or mesenteric ischemia. In addition to causing potential harm for the patient receiving contrast, the delay associated with oral contrast use may delay the care of other patients waiting to be seen, a critical issue in crowded modern U.S. emergency departments. The risks for these delays must be weighed against the potential benefit of increased diagnostic accuracy that might result from oral contrast use. Numerous studies have attempted to determine the effect of oral contrast on diagnostic accuracy of CT for a range of conditions. We summarize these studies here, exploring them in more detail in individual sections on specific pathology.
Multiple studies suggest that CT without oral contrast is highly sensitive and specific for important emergency department diagnoses, including appendicitis, diverticulitis, pancreatitis, small-bowel obstruction, pneumoperitoneum, mesenteric ischemia, abdominal aortic aneurysm and dissection, and blunt abdominal injuries.
What Other Risks Might Enteral Contrast Pose, and Do These Constitute Sufficient Grounds to Eliminate Enteral Contrast From Emergency Abdominal CT Protocols?
Some investigators have conjectured about the risk for aspiration of oral contrast in settings such as abdominal trauma. However, low-osmolality, water-soluble, iodinated contrast agents are completely absorbed from the lung and cause little morbidity. Others have raised concerns about peritoneal irritation from enteral contrast in the event of bowel perforation. However, unlike barium sulfate solutions, low-osmolality, iodinated oral contrast agents such as Gastrografin induce little peritoneal reaction, and extraluminal leak of contrast appears rare, even when bowel perforation is present. Most likely, the greatest risk for enteral contrast agents is diagnostic delay resulting from the time required for contrast to be ingested or instilled and then allowed to migrate through the bowel before CT is performed. Although enteral contrast is likely unnecessary for many emergency diagnoses, it may increase sensitivity in some conditions. Approximately 35% of abdominal CT scans in the United States are performed with iodinated enteral contrast.
In the end, the emergency physician must consider the risk and potential benefit of oral contrast case by case. Factors to be weighed include the specific differential diagnosis under consideration, the degree of illness of the individual patient, the time sensitivity of the suspected diagnoses, and the risk for repeated radiation exposure in the individual patient if CT without oral contrast is nondiagnostic and a repeated CT must be performed. If the differential diagnosis is solely conditions for which CT without oral contrast has been shown to be sensitive and specific, oral contrast likely should be omitted. In patients with concerning vital signs or clinical status, delay for oral contrast is most often not warranted. Even in patients with relatively reassuring vital signs and clinical appearance, if the suspected diagnosis is highly time-sensitive, such as mesenteric ischemia or leaking abdominal aortic aneurysm, delay for oral contrast should be avoided. Oral contrast may be reasonable in stable patients with relatively time-insensitive diagnostic concerns (e.g., diverticulitis, inflammatory bowel disease, or abscess) for which oral contrast is thought to have some diagnostic benefit. In young patients, repeated radiation exposures are a particular concern (as described elsewhere in this chapter and others), and it may be reasonable in a stable young patient to administer oral contrast to reduce the likelihood that the initial CT will be nondiagnostic. As discussed earlier in our overview of contrast agents, patients with little peritoneal fat can be difficult to diagnosis by CT because of the absence of fat stranding and intrinsic contrast provided by fat. If such a patient is stable and the differential diagnosis is less time-critical, administration of oral contrast may be wise.
Radiation Exposure From Abdominal and Pelvic Computed Tomography
CT provides a relatively large ionizing radiation exposure, leading to growing controversy about its wide and repeated use, particularly in young patients. Radiation risks for CT are discussed later in this chapter in the sections titled “ Appendicitis Imaging in the Pediatric Patient ” and “ Imaging the Pregnant Patient With Possible Appendicitis. ” Radiation risks are also discussed in Chapter 7 , Chapter 8 .
Systematic Interpretation of Abdominal Computed Tomography
In the final section of this chapter, we discuss the CT findings of specific disease states in detail. Here, let’s review two approaches to interpretation of abdominal CT scan. Many approaches are reasonable, as long as all key structures are reviewed. We first describe a systematic approach to interpretation, which we call the focused abdominal computed tomography (FACT) approach, and then discuss a more limited interpretation, in which the CT is only inspected for a few highly suspected diagnoses.
Focused Abdominal Computed Tomography Interpretation
Although emergency medicine is already overflowing with abbreviations, we introduce one more here to emphasize a similarity to the focused assessment with sonography in trauma (FAST) ultrasound examination familiar to most emergency physicians. When performing a FAST examination (discussed in Chapter 10 ), the emergency physician looks at each of four anatomic regions in turn, answering a single yes-or-no question for each:
- 1.
Right upper quadrant—Is free fluid present in the hepatorenal space?
- 2.
Left upper quadrant—Is free fluid present in the splenorenal or subdiaphragmatic space?
- 3.
Suprapubic region—Is free fluid present in the pelvis?
- 4.
Subxiphoid region—Is fluid present in the pericardial sac?
The examination is thus brief, and the questions are clear and clinically-oriented. Although other structures may be seen in the field of view, the operator is trained to focus on a single question, avoiding distraction. The same approach can be used to interpret abdominal CT, which can otherwise baffle novices because of the number of structures and forms of pathology that can be seen. We call our focused interpretation FACT, because it follows the same principles as FAST.
Let’s establish some simple rules for our discussion. First, we assume that you can only view axial images, because some centers do not yet routinely provide images in other planes. Second, we assume a familiarity with window settings and CT tissue appearances (discussed earlier), as well as with basic anatomy. Third, we assume that you are viewing the images on a digital computer workstation or picture archiving and communication system (PACS). The process is the same for reviewing printed images, although the window settings and other image characteristics cannot be modified. The axial images are conventionally displayed with the right side of the patient’s body on the left side of the viewing monitor and the anterior abdomen facing the top of the screen. The viewpoint is that of an observer standing at the foot of the patient’s bed, looking toward the head.
When interpreting abdominal CT using the FACT approach, you should focus your attention on one organ or structure at a time, with a single or limited number of questions for each organ. Although other structures may be visible in each axial image, you should intentionally ignore other structures to avoid distraction. Our approach requires you to make multiple passes through the stack of axial CT images, but you’ll find that with practice you become extremely fast at this approach.
Our approach requires you to look through the abdominal CT images several times using three window settings: soft-tissue, lung, and bone. Most organs require inspection using the soft-tissue window, with a few exceptions deserving mention here. Free air (pneumoperitoneum) is often more readily recognized on lung window settings, because this setting leaves air or gas black while rendering all other tissues quite bright or white. On a standard soft-tissue window, fat is fairly black, and small quantities of free air may be difficult to recognize against this background. A lung window is also necessary when reviewing the cephalad axial slices for pneumothorax or pulmonary parenchymal opacity. A pneumothorax looks black on this setting, whereas the lung parenchyma is readily visible. On a soft-tissue window, both normal lung parenchyma and a pneumothorax appear black and can be indistinguishable. Perform your inspection of the chest and abdomen for free air and lung pathology using the lung window, and then switch to the soft-tissue window to complete your evaluation of other structures and pathology. A final window setting that may be more selectively used is the bone window. As the name suggests, a bone window allows detailed evaluation of bone for fracture or lytic lesions. The same images viewed with a soft-tissue window can obscure fine structural abnormalities of bone, because the bone appears bright white with “bloom artifact” obscuring cortical fractures or other abnormalities. An unexpected use of a bone window includes evaluation for renal colic. Although ureteral calcifications are visible on a soft-tissue window, you may prefer to search for stones using bone window settings, which tend to render the abdomen in three primary shades: white for calcified structures, dark gray for soft tissues and fluids, and black for air. As a consequence, this window setting is also sometimes used to evaluate for free air.
To illustrate the FACT approach to interpretation, let’s start with the example of evaluating the liver for traumatic injury, a topic examined in detail in Chapter 10 . We won’t belabor the findings of liver trauma here, because they are extensively reviewed in that chapter.
Begin your search by locating the liver, which is visible high in the abdomen, in a subdiaphragmatic position. The first several axial slices typically include chest structures above the diaphragm, but ignore these at the moment, because you are focused on a single question: Does the liver show signs of traumatic hemorrhage or contusion? The axial slices spanning the liver also show the spleen, aorta, stomach, pancreas, kidneys, and spine, but ignore these for now, concentrating on the liver. You will return to each of the other organs during your assessment. On each slice containing the liver, inspect the liver parenchyma and enhancement. Once you have passed through the caudadmost liver slice and are satisfied that you have answered your focused question, stop your evaluation and move to the next organ or disease process on your checklist. For example, in the case of nontraumatic abdominal pain, the aorta is a key organ to assess for abnormalities, particularly aortic aneurysm rupture or dissection. Because the aorta begins in the chest and continues through the pelvis after bifurcating into the iliac arteries, this inspection requires review of the entire stack of CT slices. However, the questions to be answered remain simple:
- 1.
Is an aortic aneurysm (defined by an aortic diameter greater than 3 cm) present?
- 2.
Is a dissection flap visible within the contrast-filled aorta?
- 3.
Is blood or contrast visible outside of the confines of the aorta?
Again, intentionally ignore other chest, abdominal, and pelvic structures during your inspection of the aorta, which should take only seconds. The aorta normally appears as a rounded circular structure in cross section, with a fixed location, just anterior to the thoracic and lumbar spine and slightly left of the midline. Measure the aortic diameter on a single axial CT slice to develop a baseline understanding of its size, and then scroll through the digital stack of images from cephalad to caudad. Don’t evaluate major aortic branches at this stage, though as you become more adept you may choose to incorporate their evaluation here.
This process is repeated for each of the major abdominal, pelvic, and retroperitoneal organs, as well as visible structures of the chest. A systematic approach requires that all structures be evaluated in this manner ( Table 9-3 ). However, emergency physicians may elect to use a limited CT interpretation approach.
| Organ or Disease Process | Clinically Oriented Imaging Questions |
|---|---|
| Abdominal aortic aneurysm or dissection |
|
| Abscess |
|
| Appendicitis |
|
| Ascending cholangitis |
|
| Ascites |
|
| Biliary obstruction |
|
| Blunt abdominal trauma |
|
| Bones |
|
| Chest findings |
|
| Cholecystitis |
|
| Colitis |
|
| Diverticulitis |
|
| Inflammatory bowel disease |
|
| Liver mass lesion or trauma |
|
| Mesenteric ischemia |
|
| Pancreatitis |
|
| Penetrating abdominal trauma |
|
| Pneumoperitoneum (free air) |
|
| Pyelonephritis |
|
| Renal colic |
|
| Renal infarct |
|
| Small-bowel obstruction |
|
| Splenic mass lesion or trauma |
|
| SMA thrombosis |
|
∗ In FACT interpretation, the emergency physician concentrates on answering a single clinical question at a time, rather than attempting to interpret all structures in each image simultaneously. Several “passes” through the abdomen may be required to review all important structures and answer all important clinical questions. For each organ, disease, or injury focus your attention just on that organ while answering the clinical questions. Unless otherwise stated, soft-tissue is the appropriate window setting.
Limited Interpretation of Computed Tomography
Although a systematic approach minimizes the likelihood of missing pathology, in some cases the differential diagnosis is appropriately quite narrow and a more narrowly focused interpretation approach may be reasonable. A 23-year-old male with nontraumatic right lower quadrant tenderness likely has appendicitis, terminal ileitis, a ureteral stone, hernia, or testicular pathology. Abdominal aortic aneurysm and splenic rupture may be far from the differential, and it may be appropriate for the emergency physician to answer only a subset of the imaging questions for this patient, just as a focused history and physical examination may be appropriate. The radiologist bears a heavier burden, with responsibility for identifying even incidental findings of potential significance on the images. As an emergency physician, if you perform a limited initial interpretation of the CT, be sure that some system is in place for a more comprehensive interpretation by a radiologist and for any findings to be communicated to you and your patient.
Ultrasound
Ultrasound is a commonly-used and valuable diagnostic modality in emergency medicine. Advantages of ultrasound include portability and lack of ionizing radiation. The latter means that it can be safely used in pregnancy, can be used without concern in children, and can be repeated as necessary to assess for changes in the patient’s condition. In this section, we briefly review some basic principles of ultrasound physics as they relate to the clinical utility of ultrasound. We then discuss common emergency department applications of ultrasound and review basic ultrasound terminology, which we use throughout the rest of the chapter. We review the ultrasound findings of specific abdominal pathology at the end of this chapter, along with diagnostic findings for these conditions using other imaging modalities. Applications of ultrasound in blunt abdominal trauma are discussed in Chapter 10 . Vascular applications of ultrasound are discussed in more detail in Chapter 11 . Genitourinary applications of ultrasound are reviewed in Chapter 12 . Many excellent dedicated books on bedside ultrasound techniques exist; we do not extensively review these in this text.
Ultrasound Physics
Ultrasound imaging relies on simple physics of sound transmission. An ultrasound probe (also called a transducer) contains piezoelectric crystals. These materials physically vibrate when subjected to an electric current, producing high-frequency sound waves. This supplies the ultrasound signal into the patient. These crystals also produce an electric current when subjected to the physical vibration from sound waves returning from body tissues, providing a signal that can be analyzed using complex computer algorithms to produce the ultrasound image. Various body tissues transmit, reflect, and absorb sound waves differently, allowing the returning sound waves and the electric current from the piezoelectric crystals to be interpreted. Ultrasound, like CT, is a cross-sectional imaging technique. The fanlike signal of ultrasound projecting from the ultrasound probe acts like a sonographic scalpel to provide image data in the plane in which the sound intersects the body.
Using ultrasound, a tissue that produces no echoes (reflected sound waves) produces no signal to the ultrasound probe, thus appears black, and is termed anechoic. A region that reflects sound waves extensively produces a strong returning signal to the ultrasound probe, appears white, and is termed hyperechoic. A region that reflects some sound while absorbing or transmitting a portion of the incident signal results in an intermediate signal returning to the ultrasound probe. These regions appear as an intermediate brightness or gray shade on the ultrasound image and are usually described as hypoechoic —although the terms hyper- and hypo- are relative terms used to compare one tissue to another in context.
Fluids are excellent transmitters of sound, because they propagate the physical sound wave with little attenuation or reflection. Solid abdominal organs also transmit sound relatively well because of their high water content, although significant internal reflection and attenuation of the sound wave occur. Dense materials such as bone reflect and absorb sound waves and prevent through transmission. Consequently, ultrasound cannot provide images deep to these structures. Air or gas is also a poor sound transmission medium, because sound waves are randomly scattered and reflected.
The ultrasound appearance of a tissue mirrors its physical properties. Simple fluids (urine, ascites, blood, and liquid bile) transmit sound without reflection or attenuation and therefore appear black (hypoechoic). Solid organs (the liver and spleen) transmit sound but also reflect and absorb a moderate amount of the signal, appearing an intermediate gray. Dense bone reflects sound strongly and prevents through transmission. Therefore the cortex of bone appears as a bright white (hyperechoic) line or curve. Because no sound is transmitted beyond bone, the bone casts a dark acoustic shadow, just as a substance that is opaque to light casts a visual shadow. Acoustic shadows are seen with other physically dense materials that reflect sound and prevent its through transmission. These include gallstones and ureteral or kidney stones; thus acoustic shadowing has diagnostic importance, as discussed later in this chapter. Air scatters and reflects the sound wave, producing a bright returning signal and preventing visualization of deeper structures. This property can be used to diagnose abnormal gas, such as gas in subcutaneous tissues or the perihepatic space, where gas and its characteristic ultrasound appearance are not normally found. However, normal bowel gas also limits visualization of many deep abdominal organs. Ultrasound would be an even more powerful diagnostic tool if the abdomen contained no gas, because then excellent visualization of deep abdominal structures could be uniformly obtained.
The Doppler effect can also be used diagnostically in ultrasound. You may recall from physics that the Doppler effect describes the shifting frequency of sound waves as their source moves relative to an observer. Consider the example of a train whistle as a train first approaches you, passes, and then recedes into the distance. As the sound source approaches, the sound becomes higher in pitch (increases in frequency). As the train recedes into the distance, the pitch becomes lower (frequency decreases). The same effect is observed as ultrasound waves encounter flowing blood within a blood vessel. Blood flowing toward the ultrasound probe increases the frequency of the reflected sound, whereas blood flowing away decreases the frequency. This is represented visually on an ultrasound image as brighter and darker hues of red and blue. An important problem in diagnostic imaging is lack of standardization of the color scheme used to depict flow. Most ultrasound machines use color (blue or red) to denote the direction of flow relative to the ultrasound probe, not arterial or venous flow as would follow from a common and intuitive assumption, because many medical images depict arteries in red and veins in blue. In other fields of physics, such as astronomy, in which the Doppler effect is encountered, blue is usually assigned to shorter wavelengths, whereas red is assigned to longer wavelengths. However, in most medical applications of Doppler ultrasound, red denotes blood approaching the ultrasound probe and blue indicates blood flowing away from the probe—directly contradicting the wavelength and frequency properties of the Doppler signatures.
The speed of flow is depicted by the brightness of the hue; bright indicates faster flow, whereas dark hues by convention indicate slower flow. Many medical instruments actually measure the phase shift (time of arrival of the sound wave), rather than the frequency shift (Doppler shift), but with similar diagnostic effect. The term Doppler is widely applied to machines using this technique, though this is technically incorrect.
Based on these principles, common emergency department applications of ultrasound can be predicted. Ultrasound is excellent in depicting fluid-filled structures, solid organs, and vascular structures with directional blood flow. It cannot depict structures that lie deep to gas or bone. The bowel can sometimes be seen in great detail when it is pathologic and fluid-filled, as may be the case in bowel obstruction. However, air in normal or diseased bowel makes visualization of deeper structures impossible.
Common emergency department applications of ultrasound include the following:
- •
Blunt solid-organ trauma and hemoperitoneum (discussed in detail in Chapter 10 )
- •
Gallbladder or biliary ductal pathology
- •
Renal disorders, hydronephrosis, or renal stones (discussed in detail in Chapter 12 )
- •
Female pelvic pathology, including ectopic pregnancy, ovarian torsion, tuboovarian abscess, and ovarian cysts ( Chapter 12 )
- •
Bedside evaluation of abdominal aortic aneurysm ( Chapter 11 )
- •
Ascites
- •
Testicular torsion or epididymitis ( Chapter 12 )
Basic Ultrasound Modes and Image Interpretation
Two basic ultrasound modes are commonly used in emergency medicine today: brightness (B) mode and motion (M) mode. The commonly used two-dimensional planar grayscale images of ultrasound are B mode images—pixels in the image vary in brightness according to the reflectivity of the body tissue. M mode ultrasound images display a graph of the motion of tissues toward or away from the ultrasound probe along a line drawn through a point in a B mode image. The y-axis represents motion toward or away from the ultrasound probe, and the x-axis represents time. Pulsatile structures move cyclically toward and away from the ultrasound probe over time, generating a patterned sine wave on the M mode image. M mode is used in measurement of fetal heart rate, as described in detail in Chapter 12 . B mode images are used to assess anatomic structures for nearly all other abdominal applications. Three-dimensional ultrasound is not routinely used in emergency medicine applications today, although it has become popular among patients for obstetric imaging.
Ultrasound Artifacts
Several image artifacts deserve mention here, because we encounter them later in the chapter. Acoustic enhancement is an artifact seen deep to fluid-filled structures, and it results in an artificially hyperechoic (bright) appearance of these structures, one that does not represent their true acoustic reflectivity. What is the source of this artifact? The computer algorithm that generates the ultrasound image “expects” idealized, uniform solid tissue (imagine a spherical hot dog or ball of dough). Such a tissue would result in a gradual linear decrease in the returning sound signal to the probe, caused by partial absorption of the sound beam proportional to increasing tissue depth. If the image were not corrected for this effect, the brightness of tissues would gradually decrease with increasing depth, even if their actual density and reflectivity were the same. The software algorithm is programmed to correct for this anticipated loss of signal by boosting the returning ultrasound signal proportionally with increasing depth of penetration. In the case of fluid-filled structures, the sound beam is attenuated to a lesser-than-expected degree, and the software correction therefore overcorrects relative to the actual degree of sound attenuation. Tissues immediately deep to fluid-filled structures such as the gallbladder or urinary bladder therefore normally appear bright because of this artifact.
Ring-down artifact or reverberation artifact is seen when strong reflectors such as air bubbles or thin metallic structures are within the ultrasound beam. The reflector resonates and reflects the sound wave, creating a bright signal at the true location of the needle or gas interface. Additional reflections appear as a series of equally spaced, bright signals deep to the true location. This artifact is seen during ultrasound-guided procedures such as vascular access and can be seen during ultrasound-guided paracentesis and abdominal ultrasound when air is encountered.
Mirror artifact is a mirror-image effect that is seen at the interface of two tissues of high reflectivity. Some sound waves may be reflected multiple times within this interface before returning to the ultrasound transducer, rather than being reflected immediately. Because of this longer path of reflection, the ultrasound software interprets these echoes as originating at a greater distance from the probe. As a consequence, the echoes are converted into an image of the object at an erroneously increased depth. Mirror artifact can occur at the inferior diaphragmatic surface, where high-density liver meets low-density lung on the opposite side. A reversed image of the liver is sometimes visible cephalad to the diaphragm and should be recognized as not representing real anatomy.
Ultrasound Resolution, Depth of Penetration, and Probe Selection
Ultrasound imaging relies on physics of sound. Sound waves are sinusoidal waves. Assuming a fixed wave speed ( v ), the wavelength (λ) and frequency ( f ) of sound waves are inversely proportional, defined by the equation: λ = v / f . Long wavelength means low frequency, and short wavelength means high frequency. The depth of penetration of the ultrasound beam is determined by the wavelength, with long wavelengths allowing deep penetration of tissue for imaging of deep structures. The resolution of the ultrasound image is determined by the sound frequency, with high frequency yielding high image resolution for imaging of small structures. The simplest ultrasound probes emit a single frequency (really a narrow range of frequencies), so the frequency of the ultrasound probe determines both the resolution and the depth of penetration.
When selecting a probe for abdominal imaging, this trade-off must be considered, and the best probe for the suspected differential diagnosis must be chosen ( Table 9-4 ). A typical abdominal ultrasound probe has a frequency of ~5 MHz, a 60-mm curved contact surface, and a depth of penetration of 20 to 30 cm. For deep structures, a low-frequency probe is necessary to provide sufficient imaging depth. For small structures, a high-frequency probe is needed to provide adequate resolution. If a structure is both deep and small, one solution is to place the probe closer to the object of interest; for example, an endocavitary ultrasound probe uses a high frequency (~8 MHz) to provide high resolution but is shaped to allow insertion into the vagina for imaging of deep structures. The curved surface is only about 11 mm in width and allows scan depth up to 10 cm.
| Ultrasound Probe | Footprint | Frequency | Resolution | Depth of Imaging Penetration |
|---|---|---|---|---|
| Abdominal | ~60 mm | Lower frequency (~5 MHz) | Lower resolution | Deeper penetration (20-30 cm) |
| Endovaginal | ~11 mm | Higher frequency (~8 MHz) | Higher resolution | Shallower penetration (10 cm) |
Ultrasound probes also differ in their footprint (the surface contacting the patient and the shape and configuration of the ultrasound beam emanating from the probe). Typical abdominal ultrasound probes have a broad, curved, linear array (6 cm), creating a fan-shaped beam with a wide field of view.
Many parameters can be adjusted on modern ultrasound machines, and a full discussion is beyond the scope of this text. However, we address one common parameter and associated misconception here. The gain of an ultrasound machine can be adjusted, altering the brightness of the ultrasound image. Increasing the ultrasound gain increases the brightness of the image; decreasing gain decreases image brightness. Gain is the equivalent of the “listening intensity” of the ultrasound machine; although it boosts the returning signal strength, it proportionally increases the noise as well. Changing gain does not increase the intensity of the sound waves entering the patient. Improving the signal-to-noise ratio would require increasing the energy of the sound waves interrogating the body tissues, which is not controlled by gain. Although higher-energy sound waves can be used, these can result in tissue heating and are not involved in most diagnostic ultrasound.
Interpretation of Ultrasound
Ultrasound differs somewhat from x-ray and CT in that often the examination is targeted to a single organ system or region of the abdomen and pelvis, such as the right upper quadrant. Consequently, entire organs or organ systems may be absent from the field of view. The ultrasound examination must be interpreted with specific clinical information in mind, depending on the specific diagnosis in question. We review key ultrasound findings of specific disease states in the last section of this chapter.
Fluoroscopy
Fluoroscopy is relatively rarely used today for abdominal imaging in the United States. Fluoroscopy uses an x-ray beam to expose a fluorescent receptor, generating either a moving video image or still x-ray images. Because the radiation exposure depends on the total duration of the x-ray beam exposure, prolonged fluoroscopic procedures can lead to significant radiation exposures, potentially even higher than those for CT. The technique does not reveal intraabdominal structures well, unless radiopaque contrast agents are used. Images acquired before contrast administration (called masks) can be digitally subtracted from postcontrast images, allowing static radiopaque structures such as bones and instruments to be removed from the image. When vascular contrast agents are used, the result is an angiogram, useful in diagnosis and treatment of conditions such as hemorrhage from solid organs, mesenteric ischemia, and intestinal hemorrhage. Some therapeutic applications of abdominal angiography are described in Chapter 16 . Enteral contrast agents can be given, resulting in studies such as esophagography, contrast gastrography, small-bowel follow-through, and contrast colonography (e.g., barium or air-contrast enema). These studies have special utility in disorders affecting the bowel lumen, such as ulcer, volvulus, and intussusception. Contrast agents can also be instilled into the biliary system and urinary system. Overall, CT plays a broader diagnostic role today, with fluoroscopic procedures often assuming therapeutic roles once the diagnosis has been established. We discuss fluoroscopy in specific clinical settings later in this chapter.
Systematic Guide to Abdominal Pathology
In this final section, we review major forms of abdominal pathology. We describe which imaging modality is best when possible, and the evidence for that recommendation. We describe advantages and disadvantages of each modality for each diagnosis. We review the imaging findings for all major modalities that can be used to make the diagnosis. In some cases, we emphasize that a particular modality is insensitive or nonspecific and should not be relied upon. We often refer to the ACR appropriateness criteria, which provide succinct evidence-based guidelines for imaging in many common clinical scenarios ( Table 9-5 ). Throughout other chapters of this text, we emphasized well-validated clinical decision rules for imaging. Unfortunately, no single clinical decision rule governs imaging of the numerous, varied, and complex abdominal conditions. When possible, we highlight clinical guidelines that may alert the clinician to the need for imaging or provide reassurance that imaging may be deferred for the moment.
| Leading Differential Diagnosis, Stable Patient ∗ | “Best” Imaging Test † |
|---|---|
| Undifferentiated abdominal pain |
|
| Abscess or postsurgical complication |
|
| Aortic aneurysm |
|
| Appendicitis |
|
| Blunt abdominal trauma |
|
| Cholecystitis |
|
| Diverticulitis |
|
| Free air |
|
| Inflammatory bowel disease |
|
| Large-bowel obstruction |
|
| Mesenteric ischemia |
|
| Pancreatitis and complications (hemorrhage, abscess, pseudocyst) |
|
| Pelvic pathology (e.g., torsion or ectopic pregnancy) |
|
| Penetrating abdominal trauma |
|
| Small-bowel obstruction |
|
| Ureterolithiasis |
|
∗ Unstable patients may require no imaging and may be best served by laparotomy. Patients with classic presentations of disease may require no imaging.
† Many factors may influence imaging decisions, including patient age, pregnancy status, clinical stability, allergies, and renal function. The ideal choice in a given patient may differ from that listed here.
Pneumoperitoneum and Other Pathologic Gas
Figures 9-7 through 9-10 demonstrate imaging findings of pneumoperitoneum. Three modalities are commonly used to evaluate pneumoperitoneum: x-ray, CT scan, and ultrasound. X-ray has been the usual first choice and remains an appropriate first test in selected patients with a high probability of pneumoperitoneum based on history and examination findings or unstable vital signs. CT is more sensitive, as we discuss later, and is often the best, first, and only imaging study in stable patients with a broad differential diagnosis for their abdominal complaint. Ultrasound is not routinely used for detection of pneumoperitoneum in the United States, but a growing body of literature supports its use.


X-ray Technique and Findings of Pneumoperitoneum
Although emergency physicians often describe x-ray as “ruling out free air,” this terminology is inaccurate, because studies suggest that x-ray is relatively insensitive for detection of pneumoperitoneum. If x-ray is used to assess for free air, it is upright chest x-ray, not abdominal x-rays, that are most sensitive. The upright position increases sensitivity by allowing air to collect under the diaphragm, where it provides a silhouette against the subjacent liver (right side) or stomach and spleen (left side; see Figure 9-7 ). In a patient positioned supine, air often collects in the midline abdomen in the highest position, near the anterior abdominal midline or anterior to the liver—and thus may not be visible under the diaphragm (see Figure 9-8 ). Studies with CT scan confirm that these are the common locations for intraperitoneal air to collect in the supine position, as described later. In this position, air does not form a silhouette against other abdominal organs and is not easily detected with x-ray. Large amounts of pneumoperitoneum may sometimes be seen on supine abdominal x-ray. Gas may outline both the intraluminal and the extraluminal surface of the bowel wall, a finding called Rigler’s sign. Gas can also collect along the falciform ligament (falciform ligament sign), around the perimeter of the peritoneal cavity (“football” sign), along the medial umbilical folds (“inverted V” sign), and over the liver (right-upper-quadrant gas sign). In one retrospective study, 59% of cases pneumoperitoneum exhibited one or more of these findings on supine x-ray, although this series was biased by the selection of cases of pneumoperitoneum and likely overstates the sensitivity of supine x-ray.
The AP or PA upright chest x-ray can detect subdiaphragmatic gas, which appears black. Studies comparing the frontal and lateral views suggest that the lateral view may be more sensitive, particularly if air has not migrated to the most cephalad subdiaphragmatic position. Woodring and Heiser found that, in patients with known pneumoperitoneum, upright lateral chest x-ray detected 98% of cases, whereas upright PA chest x-ray detected only 80%. Maintaining the patient in an upright position for at least 5 minutes increases the sensitivity of chest x-ray. An upright abdominal x-ray is less sensitive than an upright chest x-ray because the abdominal x-ray exposure is greater to allow penetration of abdominal organs, which are denser than lung tissue. This overexposes or “burns out” some regions of the abdomen, rendering even some soft tissues black on the x-ray image. Air may be hidden because of this effect. In addition, the central ray of the x-ray beam is not centered on the diaphragm in a typical abdominal x-ray, also reducing the sensitivity. Miller et al. found that expiratory phase lateral decubitus and midinspiratory upright chest x-ray were most sensitive—using an interesting experiment in which two of the study authors were injected on separate occasions with 1 or 2 cm of intraperitoneal air. Another method to increase visibility of free air is perform an upright chest x-ray after the patient has been positioned in the right lateral decubitus position for 10 minutes, allowing air to collect under the left diaphragm. In patients who cannot tolerate full upright positioning, a left lateral decubitus abdominal x-ray (left side down) can be performed. This allows pneumoperitoneum to collect between the right lateral margin of the liver and the abdominal wall, creating a silhouette. When peptic ulcer perforation is suspected, another method to improve visualization of free air is to insufflate the stomach with air using a nasogastric tube, a technique called a pneumogastrogram. Lee et al. found that this procedure increased the sensitivity of x-ray from 66% to 91% in 129 patients with suspected perforated gastric ulcer. Given the much higher sensitivity of CT (described later), it is likely more efficient to obtain CT in most cases than to perform multiple x-rays using these techniques.
Chest x-ray can be difficult to interpret for free air. The normal gastric air bubble can be mistaken for free air on the left side, although usually the superior wall of the stomach appears thicker than the diaphragm, allowing the two to be distinguished. On the right, the colon may become interposed between the liver and the diaphragm, in which case colonic air may simulate free subdiaphragmatic air (Chilaiditi syndrome). Subphrenic fat is low in density and may be mistaken for air. Basilar atelectasis can create a linear density in the lower lung that can be mistaken for the diaphragm, in which case lung tissue above the actual diaphragm can be mistaken for intraperitoneal air. Loculated extraluminal air in the abdomen may fail to rise to a subdiaphragmatic location and may be missed.
Computed Tomography Technique and Findings of Pneumoperitoneum
CT scan is extremely sensitive for detection of gas in any location, including pneumoperitoneum (see Figures 9-9 and 9-10 ). Gas or air appears black on all CT window settings, because it is very low in density (−1000 Hounsfield units) compared with any other tissue. No contrast agents are needed to detect air because of the intrinsic extreme difference in density between air and other tissues. On a typical soft-tissue window setting, small amounts of air may be difficult to recognize, because fat within the peritoneum and retroperitoneum appears dark on these settings. The window level may be adjusted to make fat lighter in appearance. A simple solution is to select a lung or bone window, because either makes all other tissues lighter in hue, allowing black air to be readily detected. Because CT scan is usually performed with the patient in a supine position, intraperitoneal gas collects in a different location than is seen on upright chest x-ray. In one study, the most common locations for pneumoperitoneum were the anterior midline abdomen (pararectus and midrectus recesses) and the space anterior to the liver, although collections were also seen in the pelvis and mesentery. Air may be trapped in other locations by normal organs, surgical adhesions, or the presence of a loculated abscess, so the entire abdomen should be inspected. The retroperitoneum should also be inspected, because some segments of bowel, including the duodenum and ascending and descending colon, are retroperitoneal. Another advantage of CT is that it may identify the source of pneumoperitoneum, aiding surgical planning. Pinto et al. found that the site of free air correlated with the site of perforation, particularly for gastroduodenal perforation. Free air did not occur with ruptured appendicitis in this study, which included only 40 patients.
Studies have compared the sensitivity of x-ray and CT for detection of pneumoperitoneum. Stapakis and Thickman examined the performance of both modalities in patients who had undergone diagnostic peritoneal lavage for assessment of abdominal trauma—a procedure that introduced air into the peritoneum, providing an ideal setting to compare the two diagnostic tests. CT detected air in all patients, including collections as small as 1 mm. X-ray was far less sensitive, detecting no collections 1 mm or smaller, 33% of collections from more than 1 mm through 13 mm, and 100% of collections greater than 13 mm, for an overall sensitivity of 38% compared with CT. Earls et al. found CT to be more sensitive than left lateral decubitus x-ray in detecting postoperative pneumoperitoneum, with x-ray detecting only 47% of gas collections detected by CT 3 or 6 days after surgery. CT detected gas collections with volumes as low as 0.3-5.8 mL.
If enteral contrast is given, contrast may leak out of bowel in some cases and be visible on CT—though studies in the setting of trauma show this to be a fairly rare event ( Figure 9-11 ).

Ultrasound of Pneumoperitoneum
Ultrasound can be used to detect pneumoperitoneum. Gas is a poor acoustic transmitter and scatters the ultrasound beam, resulting in a highly echogenic signal, with dark acoustic shadowing occurring deep to any air collection. Air normally occurs within the abdomen, contained within bowel, so the search for free air requires inspection of regions of the abdomen that are normally devoid of air. These include the right upper quadrant superficial to the liver. Subcutaneous air in this location has a similar appearance to free air but remains fixed in position, whereas true free air can be displaced by palpation with the ultrasound probe. Rib shadows can be mistaken for air, as both demonstrate bright acoustic signal and dark acoustic shadowing.
In some studies, ultrasound is comparable or superior in sensitivity to x-ray in the detection of pneumoperitoneum. Chen et al. found ultrasound to have a sensitivity of 93% and specificity of 64%, compared with x-ray (sensitivity = 79%, specificity = 64%). In a second study, the same authors found the sensitivity of ultrasound to be 92%, compared with 78% for x-ray. Both modalities showed 53% specificity. Two problems occur in both of these studies. First, the populations in both studies are extremely spectrum biased, with most patients having hollow organ perforation. This compromises the external validity of the studies and their applicability to a general emergency department population with abdominal pain. Second, in both studies, the specificity of ultrasound is so low that it cannot be trusted to make the diagnosis of pneumoperitoneum accurately; some confirmatory study would be required, or a large number of patients would generally be expected to suffer an unnecessary operation. Braccini et al. found ultrasound to be superior to x-ray in detection of pneumoperitoneum (ultrasound sensitivity 86%, specificity 83.5%; x-ray sensitivity 75.7%, specificity 89.2%). Moriwaki et al. reported sensitivity of ultrasound for free air to be 85%, with higher specificity than in the prior studies (100%). Overall, the role of ultrasound in detecting free air is unclear. Although ultrasound may be superior to x-ray, it is less sensitive and specific than is CT. Ultrasound may be useful in patients in whom avoiding CT is particularly desired, but when a high degree of suspicion exists for pneumoperitoneum, CT should be performed.
Not all pneumoperitoneum detected by imaging is pathologic or is caused by abdominal pathology. Rarely, pneumoperitoneum may occur because of pneumothorax or even entry of air through the female genital tract. Following surgery, gas may remain in the peritoneum and be visible on upright PA x-ray for up to 1 week. However, the possibility of pathologic free air resulting from infection or iatrogenic bowel perforation should be considered if signs or symptoms are suggestive.
Bowel Obstruction
In the sections that follow, we discuss the radiographic diagnosis of bowel obstruction, beginning with proximal obstructions, continuing with small-bowel obstruction, and finishing with obstruction of large bowel. Figures 9-12 through 9-50 demonstrate imaging findings of bowel obstruction of various causes.

Gastric Outlet Obstruction
Gastric outlet obstruction is a variant of bowel obstruction. In adults, the diagnosis can be caused by neoplasm (including gastric lymphomas and carcinoma), ulcer, ingested foreign body, and rarely extrinsic compression. In infants, the process commonly occurs because of pyloric stenosis.
Although the principles of imaging for gastric outlet obstruction are the same as for small- and large-bowel obstruction, the proximal nature of the obstruction also offers the opportunity for direct visualization with endoscopy. In addition, because the obstruction is so proximal, abnormalities on imaging are often limited to the stomach, though extrinsic compression of the stomach from adjacent pathologic processes is possible.
X-ray Findings of Gastric Outlet Obstruction
The x-ray findings of gastric outlet obstruction include a grossly distended stomach, with a paucity of gas in the remainder of the abdomen if sufficient time has elapsed for peristalsis to empty the bowel distal to the obstruction (see Figure 9-12 ). The stomach may displace the transverse colon inferiorly. If obstruction is caused by ulcer, free air may be seen.
Upper Gastrointestinal Series (Fluoroscopic Examination)
A traditional means of assessing for gastric outlet obstruction is with contrast swallow study. In this case, contrast fails to move beyond the stomach. Irregularities in the mucosal surface, such as craters from ulcer, can be seen. The thickness of the stomach wall cannot be measured directly with this technique, because only the mucosal surface is visible.
Computed Tomography Findings of Gastric Outlet Obstruction
On CT, the stomach may appear grossly distended, and thickening of the pyloric region may be seen with gastric outlet obstruction. Gastric varices can be seen with IV contrast–enhanced CT. In rare cases of gastric volvulus, the stomach wall may fail to enhance normally and beaking at the point of volvulus may be seen, as described later for large- and small-bowel volvulus. If oral contrast is administered, it will not move beyond the stomach. Stomach anatomy can be difficult to visualize with CT, although thin collimation (slice thickness) and coronal plane reformations can assist. No large studies have examined CT for gastric outlet obstruction, so the description of the appearance is based on case reports.
Infantile Pyloric Stenosis
Pyloric stenosis causes gastric outlet obstruction in infants, with 95% of cases diagnosed between 3 and 12 weeks of age. A family history and male gender are risk factors, although sporadic nonfamilial cases and cases in female patients occur. The typical history is of projectile emesis immediately after feeding. In patients without the classic palpable olive on physical examination, the diagnosis was made historically using upper GI contrast studies, but today ultrasound is the predominant imaging modality. X-ray is nonspecific but usually shows gross gastric distension and often a paucity of distal bowel gas (see Figure 9-12 ). Ultrasound is highly sensitive and specific for pyloric stenosis and does not expose the patient to ionizing radiation, an important consideration in pediatric patients. Ultrasound findings of pyloric stenosis (see Figure 9-13 ) include a pylorus 14 mm or greater in length and 10 mm or greater in diameter. The use of a pyloric thickness 5.5 mm or greater does not improve diagnostic accuracy, although some authors suggested a thickness of 4 mm as a diagnostic criterion.


Hernanz-Schulman et al. studied 152 infants with suspected pyloric stenosis and found the sensitivity and specificity of ultrasound to be 100% for patients requiring surgery. Van der Schouw et al. also found that ultrasound improved the diagnosis of pyloric stenosis in infants without a palpable abdominal olive suspected of pyloric stenosis. An ultrasound-measured pyloric length of 14 mm or greater and a diameter of 10 mm or greater, along with the age at which vomiting began (<5 weeks), base excess, and a bicarbonate level of 28 mmol/L or greater, yielded high sensitivity and specificity.
Upper Gastrointestinal Series for Pyloric Stenosis
Because of the diagnostic utility of ultrasound, upper GI series is now rarely performed for evaluation of suspected pyloric stenosis. Upper GI series requires radiation exposure, whereas ultrasound does not. When ultrasound is equivocal, upper GI series can be performed. Enteral contrast introduced into the stomach by nasogastric tube is not seen beyond the pylorus.
Small-Bowel Obstruction
X-ray and CT are commonly used to evaluate small-bowel obstruction. Recent studies also support the use of ultrasound for this indication. X-ray has historically been used to “rule out” small-bowel obstruction, but this terminology is inaccurate, because x-ray has relatively poor sensitivity, as we discuss later. In the past, contrast small-bowel series with fluoroscopy have been used to identify obstruction not evident on x-ray. This modality and contrast enteroclysis have little role today in the emergency department as a result of the diagnostic power of CT. MRI can also be used to evaluate small-bowel obstruction but is not routinely required in the emergency department, because CT provides the necessary information in most patients. MRI can be used instead of CT in the pregnant patient to eliminate radiation exposure. Figures 9-14 through 9-19 show imaging findings of small-bowel obstruction.


X-ray of Small-Bowel Obstruction
X-ray diagnosis of small-bowel obstruction relies on two primary findings: dilated loops of small bowel and air–fluid levels (see Figures 9-14 and 9-15 ). Dilated loops of small bowel are visible on supine, upright, or lateral decubitus images. The small bowel is normally less than 3 cm in diameter, so a diameter exceeding this is considered pathologic. The small bowel is characterized by internal folds called plicae circularis (or valvulae conniventes), which completely traverse the diameter of the bowel. These distinguish the small bowel from the large bowel, which is marked by haustra, segmentations that do not completely traverse the bowel diameter. In a dilated loop of small bowel, the adjacent plicae circularis can give the tubular bowel the appearance of a “stack of coins.”
Air–fluid levels are not visible on a supine x-ray, because air and fluid layer in the plane of the x-ray detector and do not form a silhouette against each other. Air–fluid levels are visible on upright or decubitus abdominal x-rays, because fluid settles into dependent loops of small bowel. Normal small bowel contains both air and fluid, so scattered air–fluid levels can be a normal finding or a finding in ileus. However, in the presence of a mechanical obstruction, multiple air–fluid levels occur. As loops proximal to the obstruction fill with fluid, displacing air, air–fluid levels may be replaced by tiny pockets of air, called the “string of beads” or “string of pearls” sign on the upright x-ray. On a supine x-ray, these air pockets may appear elongated and slitlike, caused by air trapped along plicae circularis—sometimes called the “stretch” sign.
Air is present in the small bowel primarily from swallowed air; gas within the large bowel is partly caused by gas production by anaerobic bacteria. Fluid is normally present in the small bowel because of swallowed fluids, including saliva and ingested materials, and gut secretions. In the presence of a mechanical obstruction, peristalsis distal to the point of obstruction may ultimately push air and fluid out of the distal bowel. Thus a classic appearance for small-bowel obstruction includes air–fluid levels, dilated loops of small bowel, and an absence of bowel gas in the distal bowel and rectum. However, mechanical bowel obstructions can occur along a spectrum, both in terms of severity (partial or complete) and in terms of duration of obstruction before x-rays are obtained, affecting the resulting images. Understandably, an x-ray obtained moments after the onset of even a complete obstruction may not yet show dilated bowel proximal to the obstruction or an absence of gas distal to the obstruction. A partial obstruction, which allows some bowel contents to traverse the point of obstruction, may never develop a classic x-ray appearance.
In the case of ileus, when small bowel is diffusely “stunned” or inactive, no focal point of obstruction is present. The bowel may appear dilated, and air–fluid levels may be seen, but air and gas are usually distributed throughout the bowel, including distally through the large bowel to the rectum. Classically, this appearance differs from that of a complete mechanical bowel obstruction, in which gas and fluid are evacuated from bowel distal to the point of obstruction by peristalsis. However, in reality, an ileus may appear identical to an early complete mechanical bowel obstruction or a partial bowel obstruction, so the presence of gas in the distal bowel cannot distinguish these or rule out complete obstruction. A number of other bowel gas patterns have been described, including a “nonspecific bowel gas pattern,” but unfortunately, bowel obstruction may be present in patients with normal, nonspecific, ileus, or obstruction x-ray patterns. Air in the rectum should not be attributed to digital rectal examination, which does not introduce significant amounts of air.
X-ray is relatively poor for distinguishing ileus from mechanical obstruction. Air–fluid levels occurring at different heights within the same loop of bowel (called differential or dynamic air–fluid levels) have been described as more typical of mechanical obstruction than ileus, with an increasing likelihood of obstruction with increasing height differential. Harlow et al. found that the presence of differential loops is only 52% sensitive and 71% specific for mechanical obstruction—inadequate for clinical utility. With height differentials greater than 20 mm, the specificity is 94%, with less than 25% sensitivity.
This insensitivity of x-ray strongly limits its utility in the evaluation of small-bowel obstruction. Because a normal or nondiagnostic x-ray can occur in the presence of bowel obstruction (see Figure 9-18 and the related CT in Figure 9-19 ), CT (discussed later) is often performed following a normal x-ray. Moreover, because CT is commonly used to identify the point of obstruction, identify a cause such as hernia (see Figures 9-20 and 9-21 ), confirm the degree of obstruction, and identify ischemic bowel related to obstruction, an abnormal x-ray is commonly followed by CT today. Consequently, x-rays have little impact on patient management, other than introducing diagnostic delay and additional cost. Rarely, x-rays may be useful in the sickest patients (unsuitable for CT), when CT is unavailable, or in patients with such a low pretest probability of bowel obstruction that the physician is willing to accept an insensitive test result without further evaluation. X-rays can be performed portably, allowing other resuscitation measures to be continued in unstable or very ill patients. Early identification of free air or bowel obstruction with x-ray may facilitate care such as nasogastric tube placement or surgical consultation in these sickest patients.


What Are the CT Findings of Small-Bowel Obstruction?
The CT findings of small-bowel obstruction are similar to those found on x-ray: dilated loops of bowel and air–fluid levels (see Figures 9-16 and 9-17 ). Fukuya et al. found that the optimal balance between sensitivity and specificity for obstruction was achieved using 2.5 cm as the definition for dilated small bowel. In this same study, a small-bowel diameter of 3 cm or greater was 100% specific for small-bowel obstruction. Gazelle et al. found obstruction was predicted by the presence of dilated loops of bowel greater than 2.5 cm in diameter from outer wall to outer wall proximal to a point of stenosis, giving way to undilated bowel distally. Air–fluid levels and the amount of intestinal fluid did not predict obstruction. Multiple planes of image reconstruction can be helpful in assessing for small-bowel obstruction; in some cases, curved or oblique planes may be useful in identifying the exact cause of obstruction. Because CT scan is performed with the patient supine, rather than upright, air–fluid levels are seen on axial and sagittal planar images but not on images reconstructed in a coronal plane. Air appears black on a soft-tissue window, whereas native fluid within the bowel appears dark gray on this window setting.
Other CT findings of small-bowel obstruction have been described, including the string of pearls sign (similar to its x-ray counterpart), and the “small-bowel feces” sign. The latter is defined by small gas bubbles mixed with particulate matter within dilated loops of small bowel proximal to a point of obstruction. Normally this mixture of gas and solid or liquid intestinal contents is seen only in the colon, but in the presence of bowel obstruction, bacterial action begins to produce gas in small-bowel contents, resulting in this sign, which has a reported specificity of 82% for small-bowel obstruction. The small-bowel feces sign has also been described as locating the transition zone. Free fluid with bowel obstruction on CT has been associated with a higher rate of surgical intervention.
Computed Tomography Findings of Complete Versus Incomplete Small-Bowel Obstruction
Using CT without oral contrast, high-grade obstruction is suggested by a 50% difference in the caliber of proximal dilated bowel and collapsed bowel distal to the transition point. Using CT with oral contrast, complete obstruction is diagnosed if no enteral contrast passes the point of obstruction at delayed scans 3 to 24 hours after the initial CT. Partial obstruction is diagnosed if some contrast material passes the point of obstruction.
Computed Tomography Findings of Bowel Ischemia Associated With Bowel Obstruction
On CT scan, a closed-loop obstruction can be seen, indicating a high risk for bowel ischemia (see Figure 9-19 ). In such an obstruction, characterized by a grossly distended U-shaped loop of bowel with an abrupt transition to collapsed distal bowel loops, compression of the blood supply can lead to gangrene without rapid surgical intervention. Other findings concerning for ischemia from strangulating obstruction are listed in Table 9-6 .
| CT Finding | Description |
|---|---|
| Triangular bowel loop | Suggestive of closed loop with strangulation |
| Abnormalities in the attached mesentery | Nonspecific, including increased or decreased enhancement |
| Beak sign | Narrowing of the bowel lumen to a sharp point or beak at a point of tight obstruction or volvulus; insensitive but highly specific (sensitivity = 32%, specificity = 100%) |
| Bowel wall thickening >2 mm | Suggestive of ischemia, inflammatory bowel disease, or infectious enteritis; Visible on CT without IV or oral contrast |
| Closed-loop obstruction | Grossly distended U-shaped loop of bowel with an abrupt transition to collapsed distal bowel loops, suggesting strangulating obstruction |
| Decreased bowel wall enhancement | After administration of IV contrast, indicative of lack of blood flow to bowel and insensitive but highly specific (sensitivity = 34%, specificity = 100%) |
| Diffuse engorgement of mesenteric vasculature | Possibly suggestive of distal obstruction from volvulus or thrombosis |
| High attenuation in the bowel wall | Bright appearance of the bowel wall, visible without IV contrast, indicative of hemorrhage into bowel wall and suggestive of bowel ischemia |
| Increased bowel wall enhancement | After administration of IV contrast, suggestive of bowel ischemia but possible in reperfusion, infection, or inflammatory bowel |
| Large ascites | Nonspecific finding, because ascites can result from cirrhosis, heart failure, malignancy, or other causes other than ischemia; appears intermediate gray on soft-tissue CT windows, around 0-20 HU |
| Mesenteric fluid | Intermediate gray with Hounsfield density around 0-20 HU, visible on CT with IV contrast, suggesting but not specific for bowel ischemia (normal mesenteric fat is darker due to fat content, around −50 to −100 HU) |
| Pneumatosis intestinali or pneumatosis coli | Gas (black) in bowel wall, suggesting infarction or presence of gas-forming organisms |
| Portal venous gas | Always abnormal and suggestive of bowel infarction |
| Target sign | Two concentric layers of enhancement of the thickened bowel wall |
| Two adjacent collapsed bowel loops at the site of obstruction | Represent the afferent and efferent bowel segments leading into a closed loop created by bowel volvulus. |
| Unusual course of mesenteric vasculature | Possibly suggestive of volvulus or malrotation |
| Whirl sign (also called the whirlpool sign) | A pinwheel appearance of blood vessels converging on a central point of volvulus |
Although detection of ischemia associated with small-bowel obstruction is a prime indication for CT, the sensitivity and specificity have wide reported ranges in the medical literature. The ACR appropriateness criteria call CT an “excellent means of detecting complications of bowel obstruction such as ischemia and strangulation.”
Frager et al. found CT to be 100% sensitive but only 61% specific. Balthazar et al. reported the sensitivity of CT as 83%, with 93% specificity. Ha et al. found the overall sensitivity of CT to be 85%, although individual findings such as poor bowel wall enhancement (sensitivity = 34%, specificity = 100%) or a serrated beak (sensitivity = 32%, specificity = 100%) were less sensitive but highly specific. Zalcman et al. reported an overall sensitivity of CT of 96% and specificity of 93% for ischemia in the setting of small-bowel obstruction. Mallo et al. conducted a systematic review from 1966 to 2004 and found 11 studies of CT for ischemia associated with small-bowel obstruction, with 743 patients. For ischemia, the aggregate sensitivity of CT was 83% (range = 63%-100%) and specificity was 92% (range = 61%-100%). Sheedy et al. evaluated the prospective performance of CT for detection of small-bowel obstruction-associated ischemia in 60 patients and found poor sensitivity (14.8%) with high specificity (94.1%). Decreased segmental bowel wall enhancement with IV contrast was the most specific finding (100% specificity).
Jang et al. compared simple visual assessment of bowel wall enhancement for evidence of ischemia with a quantitative measure (maximal attenuation of a region of interest) in which the Hounsfield unit enhancement of bowel wall was measured. Visual inspection had a sensitivity of 91.7% and specificity of 66.7%. In comparison, quantitative measurements provided better sensitivity and specificity. A maximum attenuation of less than 85 Hounsfield units was 100% sensitive but only 45% specific for ischemia. Adopting a lower threshold improved specificity at the expense of sensitivity. If the maximum bowel wall attenuation was less than 45 Hounsfield units, the sensitivity was only 25% but specificity was 100%. The authors also assessed a technique in which the Hounsfield density of the same region on a noncontrast CT (performed immediately before CT with IV contrast) was subtracted from the Hounsfield attenuation on IV-contrasted CT. This provided the best combination of sensitivity and specificity but would require that patients undergo two CT scans, increasing the radiation exposure.
Oral Contrast Agents and Computed Tomography of Suspected Small-Bowel Obstruction
Just as small-bowel obstruction can be diagnosed with x-ray using no enteral contrast, CT without enteral contrast can demonstrate small-bowel obstruction. In the case of obstruction, the small bowel is typically already distended with ingested saliva, partially digested food, and intestinal secretions—providing intrinsic enteral contrast. Unlike high-density enteral contrast agents (e.g., barium sulfate or Gastrografin, also called diatrizoate meglumine), which appear white on CT using soft-tissue window settings, native fluid within the bowel is relatively low in density, near water density. Low-density fluid appears dark gray on soft-tissue window settings and is readily differentiated from air and fat. High-density contrast agents are designated “positive” contrast agents, whereas low-density contrast such as native bowel contents are called “neutral” contrast agents. Multiple studies demonstrate that positive enteral contrast agents are not generally needed for the diagnosis of small-bowel obstruction. In its published appropriateness criteria, the ACR states that the use of positive enteral contrast may actually disguise bowel wall changes indicative of ischemia, which we discuss later.
Intravenous Contrast Agents and Computed Tomography of Suspected Small-Bowel Obstruction
Small-bowel obstruction can be diagnosed without IV contrast, but the use of IV contrast can assist in diagnosis of bowel ischemia. Detection of ischemia is an important indication for abdominal CT in clinically suspected or x-ray-confirmed small-bowel obstruction, so IV contrast should be administered when possible. IV contrast may assist in other conditions with similar clinical presentations to small-bowel obstruction, as described in other sections of this chapter and chapters of this book.
Atri et al. compared IV-enhanced CT with nonenhanced CT (no oral, IV, or rectal contrast). Unenhanced CT had a sensitivity of 88.1% and specificity of 77% for small bowel obstruction, not significantly different from the sensitivity and specificity of CT with IV contrast (87.6% and 75%, respectively).
What Is the Transition Point, and What Is Its Significance?
With CT, the point of a mechanical obstruction can be identified and often the cause can be determined. Proximal to this point, the bowel appears dilated beyond 3 cm. Distal to the point of obstruction, bowel loops are decompressed (<3 cm). The point of obstruction, at which dilated bowel loops give way to undilated bowel, is called the transition point or transition zone. Identification of a transition point helps to confirm a mechanical obstruction rather than ileus. In addition, the cause of obstruction may be recognized as an abscess, mass, internal or external hernia (see Figures 9-20 and 9-21 ), volvulus, intussusception (see Figures 9-23 and 9-24 ), ingested foreign body, or inflamed bowel segment, aiding surgical planning. Adhesions may be difficult to identify directly on CT but are a common cause of small-bowel obstruction in patients with CT evidence of small-bowel obstruction without a visualized cause. Use of coronal plane images, in addition to axial images, may assist in detection of the transition point. A recent study questions the clinical significance of the radiographic transition zone. Colon et al. found no difference in the rate of immediate operative therapy or failure of nonoperative therapy in patients with and without transition zones. Transition zones correlated with operative findings in 63% of cases.


What Is the Sensitivity of Computed Tomography for Small-Bowel Obstruction? How Does This Compare With X-ray?
X-ray and CT have been compared in sensitivity for detection of small-bowel obstruction. As with x-ray, the sensitivity of CT likely varies according to the severity of obstruction. The ACR cites a range of sensitivities of x-ray (30%-90% in published series), as well as a high rate of misleading findings on plain x-ray (20%-40%).
In most studies, CT is considerably more sensitive than x-ray for the diagnosis of small-bowel obstruction, although a small number of studies show comparable sensitivity and specificity. In its appropriateness criteria, the ACR cites the higher sensitivity and specificity of CT, as well as its ability to determine the degree and cause of obstruction and the presence of ischemia, as key reasons for the use of CT as the primary diagnostic modality for suspected small-bowel obstruction. Mallo et al. conducted a systematic review from 1966 to 2004 and found 15 studies of CT for small bowel obstruction. The sensitivity of CT for complete obstruction was 92% (range = 81%-100%), and the specificity was 93% (range = 68%-100%).
Shrake et al. retrospectively reviewed x-ray and enteroclysis (a rarely-used procedure in which the bowel is rapidly distended with fluid via an enteric tube prior to imaging) in 117 consecutive patients undergoing enteroclysis for suspected small-bowel obstruction. Among patients with normal or nonspecific x-rays, 22% had obstruction demonstrated by enteroclysis. Of patients with x-rays suggesting obstruction, 42% had normal enteroclysis or only minor adhesions. These results suggest that x-ray findings may imply the wrong diagnosis in 20%-40% of cases.
Megibow et al. retrospectively viewed 84 CT scans from patients with suspected small-bowel obstruction and found a sensitivity of 94% and specificity of 96%. CT identified the cause of obstruction in 73% of cases.
Frager et al. compared the accuracy of x-ray and CT in 85 patients, using a gold standard of surgical findings and clinical course. For complete obstruction, x-ray combined with clinical suspicion was 46% sensitive, whereas CT was 100% sensitive. For partial obstruction, x-ray with clinical suspicion was 30% sensitive, whereas CT was 100% sensitive. CT was false positive in three cases of ileus from causes including small-bowel infarction, pneumonia, and peritonitis from bladder rupture.
Maglinte et al. retrospectively compared the sensitivity of x-ray and CT in 78 patients, using a gold standard of clinical outcome and enteroclysis. X-ray was 69% sensitive and 57% specific for small-bowel obstruction. CT was 64% sensitive and 79% specific. In subgroups classified as high-grade obstruction, x-ray was 86% sensitive and CT was 82% sensitive. In low-grade obstruction, x-ray was 56% sensitive and CT was 50% sensitive.
Suri et al. reported that the sensitivity of CT was 93%, with 100% specificity. X-ray was 50% sensitive and 75% specific, and ultrasound was 83% sensitive and 100% specific. However, this prospective study included only 32 patients, 30 of whom had obstruction, suggesting significant selection and spectrum bias compared with a typical emergency department population.
Low-grade obstruction may be a relative CT blind spot, with fewer than 50% of patients diagnosed by CT in two studies by Maglinte et al. However, these studies included a nonconsecutive retrospective sample of patients referred for enteroclysis to confirm small-bowel obstruction, a group in whom presumably the diagnosis was relatively difficult (hence requiring enteroclysis). This may underestimate the sensitivity of CT in a typical population of emergency department patients.
Ultrasound for Small-Bowel Obstruction
Ultrasound is rarely used in the United States but often used internationally for the diagnosis of small-bowel obstruction. Advantages of ultrasound are portability, lack of any ionizing radiation exposure, and elimination of injected iodinated contrast, with its attendant risks.
Ultrasound findings of small-bowel obstruction are similar to those with other imaging modalities. Dilated loops of bowel greater than 3 cm diameter are seen proximal to a point of mechanical obstruction, with collapsed loops distally. Fluid-filled loops of bowel are readily seen with ultrasound, although air continues to pose a barrier to visualization, scattering the ultrasound beam. Associated ascites are readily recognized. The thickness of the bowel wall can also be assessed. Because ultrasound allows dynamic assessment of bowel motility, peristalsis can be used as an additional criterion. In the presence of obstruction, increased bowel motility with a to-and-fro or whirling motion of intestinal contents may be seen. Conversely, in ileus, an absence of intestinal peristalsis is seen. Hyperechoic ultrasound contrast agents can be administered intravenously to assess bowel wall perfusion. After administration of these agents, lesser echogenicity is seen in ischemic bowel wall compared with normally perfused bowel.
Ultrasound has been compared retrospectively and prospectively with x-ray for the diagnosis of small-bowel obstruction. Ko et al. found ultrasound to be correct in 89% of 54 cases, compared with 71% of cases for x-ray. Sonography also more accurately predicted the degree and cause of obstruction. Ogata et al. prospectively compared ultrasound and x-ray in 50 patients with suspected bowel obstruction, 22 ultimately diagnosed with small-bowel obstruction and 2 with large-bowel obstruction. Ultrasound was 88% sensitive and 96% specific, whereas x-ray was 96% sensitive and 65% specific. This study is limited by selection biases and a small sample size with wide confidence intervals (CIs). Czechowski compared x-ray and ultrasound in 96 patients and found ultrasound to be 91% sensitive in patients with strangulation, compared with 30% for x-ray. In cases of simple obstruction, ultrasound was 89% sensitive, compared with 78% for x-ray. However, the small number of cases (9 simple obstructions and 10 strangulation obstructions) results in wide CIs. As described earlier, Suri et al. prospectively compared x-ray, CT, and ultrasound, finding ultrasound to be 83% sensitive and 100% specific, but with significant selection bias and a small patient population.
Hata et al. studied contrast-enhanced ultrasound for assessment of small-bowel obstruction–associated intestinal ischemia in 51 patients with dilated bowel on x-ray. Ultimately, 15 patients were found to have bowel ischemia from strangulation, 5 from superior mesenteric artery (SMA) thromboembolism, and 31 patients had simple obstruction. Diminished or absent color signals from the bowel wall had a sensitivity of 85% for bowel ischemia (95% CI = 62%-97%) and specificity of 100% (95% CI = 91%-100%). Larger studies are needed to confirm these findings. The rate of SMA thrombosis in this series was extraordinarily high (10%) compared with the rate in the general population, suggesting selection bias in this study population.
Midgut Volvulus With Resulting Bowel Obstruction and Ischemia in Adults
Midgut volvulus can result in intestinal obstruction and acute bowel ischemia. The condition is not restricted to pediatric patients but represents a particular concern in preverbal infants who cannot communicate symptoms, sometimes leading to catastrophic diagnostic delay. In adults, midgut volvulus can occur as a result of undiagnosed midgut malrotation. It is a rare cause of mesenteric ischemia in young adults. X-ray findings are nonspecific but can include a “bird’s beak” appearance because of rotation of the bowel around the point of volvulus. CT demonstrates this same appearance, with whirling of the mesentery. Other CT findings of intestinal ischemia are often present, as described earlier.
Midgut Volvulus in Infants
Midgut volvulus resulting from malrotation is a much feared pediatric emergency, occurring in an estimated 1 in 500 live births. Because 60% of cases present within the first month of life and another 20%-30% present before 12 months, diagnosis is difficult; the patients cannot communicate symptoms. Another 10% of cases present throughout life, including adults of any age. Mortality is around 15%, but short gut syndrome from extensive bowel infarction is a highly morbid consequence. The clinical presentation in neonates is bilious emesis.
X-rays for Midgut Volvulus
X-rays may demonstrate evidence of proximal intestinal obstruction, with a dilated stomach and proximal small bowel and an otherwise gasless abdomen. A “double-bubble” sign may also be seen. When x-rays suggest volvulus, the preferred radiographic technique for confirmation is upper GI series, although CT and ultrasound can also be used. Because x-rays are not sensitive for the diagnosis, a confirmatory study is needed whenever clinical suspicion exists.
Upper Gastrointestinal Series for Midgut Volvulus
Sizemore et al. studied 166 patients and found upper GI series to be 96% sensitive for malrotation and 79% sensitive for midgut volvulus. Upper GI series demonstrates a classic beaking appearance of the small bowel at the point of volvulus, with no contrast passing this point. The configuration of the bowel is also abnormal, caused by malrotation, although the specific appearance is beyond the scope of this text. Figure 9-22 shows an upper GI series performed for suspected midgut volvulus.
Computed Tomography for Midgut Volvulus
CT scan can reveal midgut volvulus, as well as other serious causes of abdominal signs and symptoms, in infants. No large studies have examined its diagnostic performance, but multiple investigators have reported its use in pediatric patients. The CT “perfusion cutoff” sign has been described in children and is seen as hyperenhancement of the bowel wall proximal to the point of volvulus, followed by an abrupt lack of enhancement of the bowel wall distal to the point of volvulus. This finding is based on case reports, and the sensitivity is unknown.
Ultrasound for Midgut Volvulus
Ultrasound can assess for malrotation, the anatomic basis for midgut volvulus. Ultrasound can identify inversion of the normal positions of the superior mesenteric vein and artery and a “whirlpool” sign of twisted vessels, indicating midgut volvulus. The sensitivity for malrotation is reported to be 98%, whereas the specificity is only around 75%. Ultrasound thus may be useful to rule out malrotation but not to confirm malrotation or volvulus.
Computed Tomography Findings of Intussusception With Resulting Bowel Ischemia
Whereas intussusception in children (discussed in the next section) requires reduction with enema or surgery, in adults, intussusceptions are a rare and potentially incidental finding on CT scans. Sundaram et al. reviewed 95,223 CT scans performed over 7 years and found 136 intussusceptions in 118 patients (0.13% of CT scans). In this study, 88.2% of intussusceptions were enteroenteric, 3.7% were enterocolic, and 4.4% were colocolic or other locations. The authors found 5.9% of patients required surgery, whereas 94.1% were nonsurgical. The discovery that 63% of surgical lesions involved the colon suggested that colonic intussusceptions is more likely surgical—though the small number of surgical cases in this series makes this finding uncertain. CT criteria were not specific for identifying enteroenteric lesions requiring surgery. Many nonsurgical enteroenteric intussusceptions were greater than 3.5 cm in length and thicker than 3 cm, suggesting that length and thickness had poor predictive value. A case of adult intussusception imaged with CT is shown in Figures 9-23 and 9-24 .
Pediatric Intussusception
Intussusception is the leading cause of bowel obstruction and potential infarction in children 3 months to 6 years, with a peak incidence between 3 and 12 months. Most cases are ileocolic, with the terminal ileum carried through the ileocecal valve into the colon. Although a pathologic leadpoint is theorized to account for intussusception, 90%-95% of cases have no identifiable cause. The condition is fatal if not rapidly treated, although most patients recover if treated within 24 hours of onset. Intense colicky pain, vomiting, and currant jelly stools are classic but occur in only about one in five cases. Lethargy can occur. Rapid imaging is key to diagnosis and treatment (see Figures 9-25 through 9-31 , which demonstrate imaging findings with multiple modalities).


X-rays can demonstrate a soft-tissue mass at the site of intussusception, a pattern of bowel obstruction, or perforation—but are often normal or nonspecific. Sargent et al. found that x-rays were equivocal in 53% of suspected cases of pediatric intussusception, positive in 21%, and negative in 26%. Smith et al. reported a sensitivity of 80.5% and specificity of 58% for x-rays interpreted by full-time pediatric emergency physicians. Morrison et al. found that when interpreted by emergency physicians, x-ray had a sensitivity of 48% and specificity of 21%. Overall, x-ray appears too insensitive and nonspecific to confirm or exclude intussusception ( see Figure 9-25 ).
Ultrasound has become the mainstay of diagnosis, because it is noninvasive and highly sensitive and specific. Hryhorczuk and Strouse retrospectively reviewed 814 pediatric patients evaluated for intussusception with ultrasound and found ultrasound was 97.9% sensitive and 97.8% specific. Ultrasound is a desirability modality in children because of lack of radiation exposure. Findings include an appearance of alternating hyper echoic and hypoechoic layers (see Figures 9-26, 9-28, and 9-30 ).
CT is not usually required for the diagnosis of intussusception in children. However, CT may be obtained to assess for other conditions, such as appendicitis or mass, only to demonstrate intussusception. CT demonstrates a “target” sign of alternating hyperattenuating and hypoattenuating bowel layers. Findings of bowel obstruction and ischemia (described earlier) may also be present, depending on the duration of the intussusception.
Air-contrast enema, once the mainstay of diagnosis, is usually used only therapeutically today after ultrasound diagnosis (see Figures 9-27, 9-29, and 9-31 ). Air is instilled into the rectum under controlled pressure to reduce the intussusception and is successful in about 85% of cases. Water or barium contrast enema reduction is not commonly performed today because of the safety and efficacy of air-contrast enema. Unsuccessful reduction requires surgical therapy, as does perforation from the enema, which rarely occurs (in about 1.6% of cases). When reduction with air-contrast enema is successful, recurrence takes place in about 7.5% of cases within 36 hours. However, recurrence is not associated with adverse outcomes, and routine admission after successful reduction may not be required.
Large-Bowel Obstruction
Large-bowel obstructions including special cases, such as hernia and cecal and sigmoid volvulus, are demonstrated in Figures 9-32 through 9-50 . About 25% of bowel obstruction cases involve the large bowel, whereas 75% involve the small bowel. Large-bowel obstruction can be diagnosed by four modalities: x-ray, contrast enema, CT, and ultrasound. As previously discussed for small-bowel obstruction, x-ray is the historical standard but CT is more sensitive and specific, with the ability to provide information about the cause of obstruction and complications such as bowel ischemia. Contrast enema has become rare because of the diagnostic power of CT. Ultrasound is uncommonly used in the United States and thus is not discussed here, but it sees wider use internationally. Large-bowel obstruction can result from several processes, including intrinsic mass lesions, extrinsic compression by mass lesions or abscesses, adjacent inflammatory processes such as diverticulitis, surgical adhesions, hernias, and cecal and sigmoid volvulus. X-ray does not reveal the cause in most cases, although a characteristic appearance of cecal and sigmoid volvulus is sometimes seen, as described later.


Related posts:
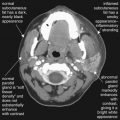
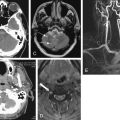
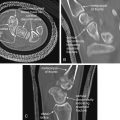
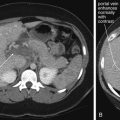
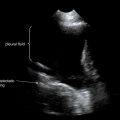
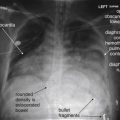
Stay updated, free articles. Join our Telegram channel

Full access? Get Clinical Tree


