In the two preceding chapters we discussed chest imaging in patients without a history of injury and in the setting of trauma. In this chapter, we focus on imaging of three particularly life-threatening conditions: pulmonary embolism (PE), spontaneous aortic dissection, and spontaneous thoracic aortic aneurysm rupture. These conditions share computed tomography (CT) as their primary diagnostic modality today. For each of these, we briefly review pathophysiology, pretest probability assessment, and the limited role of chest x-ray in diagnosis. We discuss the role of CT in detail, comparing CT to other imaging modalities, including the historical criterion standards, pulmonary angiography and aortography, which are more rarely performed today. We consider the role and diagnostic accuracy of alternative imaging modalities, including ventilation–perfusion (VQ) scan, magnetic resonance imaging (MRI), and echocardiography. We consider challenging clinical scenarios, such as the patient with contraindications to intravenous (IV) contrast, the unstable patient who may be at risk during imaging tests outside of the emergency department, the patient requiring exclusion of both PE and aortic pathology, and the pregnant patient with suspected PE. Along the way, we review critical imaging findings that may allow you to diagnose these important conditions before radiologist interpretation, allowing earlier initiation of therapy. In the chapter on interventional radiology ( Chapter 16 ), interventions for PE and aortic disease are described, with a critical review of the evidence for these treatments.
Brief Guide to Figures in This Chapter
Figures in this chapter are grouped according to clinical case so that x-rays, CT scans, and other imaging studies from a single patient are clustered together for teaching purposes. This means that sometimes you are directed to a figure later in the chapter, illustrating a related imaging finding in a different patient. These cross-references to later figures are marked by the words see also. In addition, a summary of the figure content is listed in Table 7-1 for quick reference. We highly recommend looking at all figures corresponding to a given patient case. They are arranged to illustrate pearls and pitfalls of imaging.
| Content | Figure Numbers |
|---|---|
| Pulmonary embolism figures | 7-1 to 7-59 |
| 7-2, 7-3, 7-34, 7-38, 7-41, 7-51, 7-52 |
| 7-2 |
| 7-3, 7-34, 7-38, 7-41, 7-51, 7-52 |
| 7-8 to 7-33, 7-35 to 7-37, 7-39, 7-40, 7-42, 7-47, 7-55 |
| 7-11, 7-12 |
| 7-13 to 7-27, 7-33, 7-39 |
| 7-16, 7-17 |
| 7-28, 7-29, 7-36, 7-42 |
| 7-30 to 7-32, 7-35, 7-37, 7-42 |
| 7-39, 7-40, 7-47 |
| 7-43 to 7-46, 7-48 to 7-50, 7-53, 7-54 |
| 7-4, 7-5 |
| 7-56 to 7-59 |
| Aortic disease figures | 7-60 to 7-102 |
| 7-60, 7-65, 7-67, 7-69, 7-70, 7-73, 7-75, 7-78, 7-85, 7-88, 7-92, 7-95, 7-98, 7-99 |
| 7-60, 7-65, 7-67, 7-69, 7-70, 7-73, 7-75, 7-92, 7-95 |
| 7-67, 7-78, 7-85, 7-88, 7-92 |
| 7-98, 7-99 |
| 7-61 to 7-64, 7-66, 7-68, 7-69, 7-71, 7-74, 7-76, 7-77, 7-79 to 7-84, 7-86, 7-87, 7-89 to 7-91, 7-93, 7-94, 7-96 to 7-98, 7-100 |
| 7-80, 7-81 |
| 7-80, 7-82, 7-83 (brachiocephalic) |
| 7-64 |
| 7-80, 7-82, 7-83 |
| 7-84, 7-91 |
| 7-87 |
| 7-90 |
| 7-96 |
| 7-74, 7-93, 7-94 |
| 7-72 |
We begin our discussion with PE. This discussion sets the stage for our review of aortic imaging, which has many features similar to those of PE.
Pulmonary Embolism
PE occurs when thrombus, usually from lower extremity or pelvic veins, migrates to the pulmonary arteries, resulting in partial or complete obstruction of blood flow in the affected vessel. The lung segment supplied by this vessel may become infarcted, and atelectasis or pleural effusion may occur. Pulmonary embolism is a life-threatening condition, although the range of reported mortality is very wide. In a large US emergency department sample of patients diagnosed with acute PE, 30-day mortality attributed to acute PE was only 1.1%, but all-cause mortality was 5.4%. Other studies suggest 30-day death rates of 15% in initially hemodynamically stable patients and almost 60% in patients presenting with hemodynamic instability, demonstrating the wide range of clinical severity.
Which Patients Require Imaging for Pulmonary Embolism? How Does Pretest Probability Influence Imaging Decisions?
Pretest probability assessment is a key part of planning for diagnostic imaging in emergency department patients with suspected PE. Pretest probability assessment first determines whether a patient requires imaging of any kind to assess for PE. Next, pretest probability strongly determines the reliability of the available diagnostic imaging modalities, influencing both the choice of modality and the clinical application of a negative or positive imaging test. As we discuss in detail later in the sections on VQ scan and CT, when imaging test results are at odds with clinical pretest probability, additional testing is warranted because of the possibility of false-positive and false-negative imaging results.
PE can be challenging to diagnosis clinically, as it can present with a variety of symptoms, including chest pain, dyspnea, and syncope. Let’s consider how clinical risk assessment tools should be applied to patients with suspected PE. First, ask the binary question: Is PE a possible cause of the patient’s presentation? If the answer is unequivocally “no,” (for example, in a patient with pleuritic chest pain immediately after blunt chest trauma), further risk assessment is not needed and may trigger unnecessary testing. If the answer is “yes” (including “likely not,” “possibly so,” or “likely yes”), “ further clinical risk stratification is needed. Several clinical assessment schemes exist, but they share the ability to sort patients into low-risk categories (not requiring imaging) and higher-risk categories (requiring imaging). Some risk stratification schemes incorporate lab testing (D-dimer ∗
∗ D-dimer is a fibrin degradation product present in blood after a clot is degraded by fibrinolysis. Its presence or absence can be used as a screening tool for the presence of clot.
), whereas others rely solely on clinical history and physical exam. We consider two risk stratification tools or clinical decision rules: Wells score and pulmonary embolism rule-out criteria (PERC).Clinical decision rules are important guides to imaging decisions once the diagnosis of PE has been considered based on clinical gestalt. This last statement is important, because the two clinical rules we discuss here could lead to unnecessary imaging if applied indiscriminately to patients with clinical presentations not suggestive of PE. For example, a 60-year-old patient presenting with fever, abdominal pain, heart rate of 120 beats per minute, and history of appendectomy 10 days prior may be an obvious clinical case of postoperative abscess but scores 3 points by Wells criteria (discussed later), falling into a moderate risk group for PE. Clearly, the patient should not be evaluated for PE solely based on these criteria, unless clinical signs and symptoms suggest PE. By the same concept, the patient would fail several of the PERC, but these should not be applied if the clinician does not suspect PE. Figure 7-1 demonstrates appropriate use of risk-stratification for PE, and also shows how inappropriate use of risk-stratification rules could lead to unnecessary imaging.

Wells criteria ( Table 7-2 ) are validated criteria to identify patients with a low clinical risk for PE. Wells and colleagues have investigated multiple cutoffs, including a low–moderate–high categorization, and a PE unlikely–likely categorization (see Table 7-2 ). In Wells’ validation set, patients with a score less than 2 (low risk) had an overall PE rate of only 2.0%, regardless of D-dimer result. However, the confidence intervals were broad, with an upper limit of 7.1%, which would be unacceptably high for most clinicians. Ironically, low-risk patients with a negative D-dimer had a higher rate of PE (2.7%) than those with positive D-dimer testing (0%) in Wells’ study, though no statistical difference between the groups existed. When the Wells Criteria are dichotomized into PE “unlikely” (score ≤ 4) and “likely” (score > 4) categories, an unlikely score plus a negative SimpliRed D-dimer predicts a PE risk for around 2% with an upper 95% CI of 6%. Other studies suggest that the SimpliRed D-Dimer is not sufficiently sensitive and that ELISA D-dimer assays are superior. More recently, a simplified dichotomized Wells Criteria has been described, although this rule requires additional prospective validation. Under this paradigm, each criterion is assigned only 1 point, and a score of no more than 1 combined with a normal D-dimer predicts a 3-month incidence of venous thromboembolism (VTE) of 0%, with a 95% confidence interval (CI) of 0% to 1.6%. Using this strategy, 26% of patients could avoid diagnostic imaging for PE. The use of Wells criteria, in conjunction with D-dimer testing, to screen patients for possible PE is widely accepted and was endorsed by the American College of Emergency Physicians (ACEP) in its 2003 clinical policy on evaluation of adult patients with suspected PE, now retired.
| Criterion | Score |
|---|---|
| Clinical signs and symptoms of DVT | 3.0 |
| PE is No. 1 diagnosis or equally likely | 3.0 |
| Heart rate > 100 bpm | 1.5 |
| Immobilization at least 3 days or surgery in past 4 weeks | 1.5 |
| Previous objectively diagnosed PE or DVT | 1.5 |
| Hemoptysis | 1.0 |
| Malignancy with treatment within 6 months, or palliative | 1.0 |
The PERC are a prospectively derived and validated system to exclude PE without D-dimer testing. The advantage of such a system is the avoidance of unnecessary imaging prompted by false-positive D-dimer results, a problem often encountered with highly sensitive D-dimer tests. The criteria ( Box 7-1 ) are meant to be applied only to patients judged to be at low risk for PE based on physician gestalt. Imaging decisions in patients not judged by gestalt to be at low risk of PE should not be based on PERC. In a prospective study of more than 8100 patients, the rate of 45-day VTE or death was less than 2% in PERC-negative patients. The rule can eliminate the need for diagnostic imaging in about 20% of patients with a low pretest probability (defined as <15%) based on physician gestalt. Multiple other clinical probability scores exist including the Charlotte Rule and Geneva Rule, with similar overall accuracy. These and experienced clinician gestalt can be used to determine pretest probability.
Formulating a pretest probability assessment of PE should be routine practice before the decision to perform a diagnostic imaging test for PE. In patients whose pretest probability assessment suggest a need for imaging to evaluate for PE, multiple imaging tests are available, but the usual first imaging step is chest x-ray.
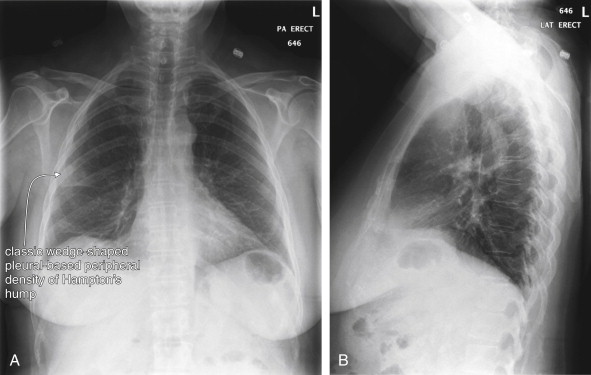
How Is Chest X-ray Useful in the Evaluation of Pulmonary Embolism? What Is the Importance of Classic Abnormalities Such as Hampton’s Hump and the Westermark Sign? Do Any Chest X-ray Findings Confirm or Exclude Pulmonary Embolism?
Chest x-ray plays a limited role in the diagnosis of PE, as an embolism is not directly visible on plain x-ray. The greatest importance of chest x-ray in assessment for PE is in evaluation of the differential diagnosis, which can include pneumonia, pneumothorax, malignancy, pleural effusion, pericardial disorders, and aortic or other mediastinal abnormalities. Chest x-ray is inexpensive, rapid to obtain, and exposes the patient to minimal radiation in comparison with CT and VQ scan. Consequently, it is an appropriate initial imaging test in virtually every patient with suspected PE, as it explores the differential diagnosis of complaints such as chest pain, dyspnea,
- •
Age <50 years
- •
Pulse <100 beats per minute
- •
Sa o 2 >94%
- •
No unilateral leg swelling
- •
No hemoptysis
- •
No recent trauma or surgery (with general anesthesia) in past 4 weeks
- •
No prior PE or DVT
- •
No hormone use
| Chest X-ray Finding | Sensitivity | Specificity |
|---|---|---|
| Normal | 12% | 82% |
| Oligemia (Westermark sign) | 8%-14% | 92%-96% |
| Prominent central pulmonary artery (Fleischner sign) | 20% | 80% |
| Pleural-based area of increased opacity (Hampton’s hump) | 22%-24% | 82% |
| Vascular redistribution | 9%-10% | 85%-87% |
| Pleural effusion | 35%-36% | 70% |
| Elevated diaphragm | 14%-20% | 85%-90% |

Several key points about chest x-ray bear emphasis:
- •
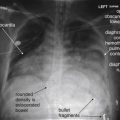
Chest x-ray abnormalities including pleural effusion, atelectasis, lung mass, and parenchymal densities can coexist with or be a consequence of PE. Chest x-ray findings must be considered carefully in the context of the patient’s presentation and overall risk profile for PE. For example, a chest x-ray finding of parenchymal opacity can represent pneumonia or pulmonary infarction. In the context of fever and productive cough, the chest x-ray may provide sufficient information to diagnose pneumonia. However, in the setting of abrupt pleuritic pain and dyspnea, the same finding should be considered compatible with PE and should not prevent further testing for PE.
- •
No chest x-ray finding is sensitive enough to rule out PE.
- •
With the exception of the rare finding of oligemia (Westermark sign), no chest x-ray finding appears to be specific enough to rule in PE. If the diagnosis is seriously suspected, additional testing is warranted to confirm PE, regardless of suggestive chest x-ray findings such as Hampton’s hump.
- •
A normal or near-normal chest x-ray is generally a prerequisite for VQ scan. As described in more detail later in this chapter, chest x-ray abnormalities often predict a nondiagnostic VQ scan, in which case CT may be a better choice.
What Modalities Can Be Used to Detect Pulmonary Embolism? How Does Pulmonary Angiography Diagnose Pulmonary Embolism?
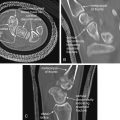
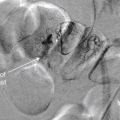
As we discussed earlier, chest x-ray plays a limited role in the diagnosis of PE, as an embolism is not directly visible on plain x-ray. Instead, indirect or associated findings of PE may sometimes be visible, including pleural effusions and pulmonary parenchymal opacities associated with infarction. In general, these findings are neither sensitive nor specific for PE, so the major role of chest x-ray is in evaluation for other pathologic processes in the differential diagnosis. Common imaging tests for PE include VQ scan and CT pulmonary angiography, with niche roles for MRA and echocardiography in the evaluation of selected patients, as discussed later. The historical criterion standard diagnostic test was fluoroscopic pulmonary angiography ( Figures 7-4 and 7-5 ). In this test, a catheter is inserted through a central vein and advanced through the right heart to the pulmonary artery. Contrast is injected through the catheter, filling the pulmonary arterial tree, which is then visible under fluoroscopy. A pulmonary embolus is visible as a filling defect within the stream of contrast. A fully occlusive PE may completely block flow of contrast distally, whereas a partially occlusive thrombus or small peripheral thrombus may be subtler. As we discuss later, CT pulmonary angiography uses the same principles to detect thrombus and shares many of the advantages and pitfalls. Although pulmonary angiography is used as the “gold standard” diagnostic test in many studies evaluating other imaging modalities, angiography is itself imperfect. Based on animal models, autopsy studies, and follow-up studies using subsequent diagnosis of PE to identify false-negative angiography results, pulmonary angiography is likely only about 87% sensitive (95% CI = 79%-93%), which as we discuss is comparable to CT sensitivity. Pulmonary angiography is rarely performed today as a primary diagnostic test for PE because of its invasive nature and morbidity. Its role has largely been relegated to secondary investigation in cases in which other diagnostic modalities are inconclusive or when invasive therapy is needed for massive PE. The chapter on interventional radiologic techniques ( Chapter 16 ) discusses pulmonary angiography in detail.


Next, we discuss the theory behind other common tests for PE, starting with CT.
CT Pulmonary Angiography
CT was independently invented in 1972 by British physicist Godfrey N. Hounsfield and American Allan M. Cormack, who in 1979 shared the Nobel Prize in medicine and physiology for their contributions. CT was a breakthrough technology, because it allowed depiction of cross-sectional anatomy with soft-tissue detail unobtainable by conventional x-ray, discovered in 1895 by Wilhelm Roentgen. The first CT scanner could accommodate only the human head and required more than 7 minutes to acquire a single image (slice). Early CT scanners used a single x-ray emitter and detector to acquire image data. Data was acquired one slice at a time, with the emitter and detector circling the patient once, and then the table moving a small distance between each image acquisition ( Figure 7-6 ). The consequence was not only poor image resolution but also data gaps, because anatomic information between slices was unavailable. The ability of CT to diagnose subtle pathology, such as small pulmonary emboli, was limited by both resolution and data gaps. Initially CT was used to demonstrate not the PE but the infarcted lung segment, and it had a sensitivity of less than 50%.

Computed Tomography Scan Characteristics
Two innovations known as “helical” and “multislice” technology improved CT image and data quality, enhancing diagnostic capability. Because of these improvements in CT technology, older studies on the diagnostic characteristics of single-slice CT do not apply to most CT scanners now in clinical use. CT scanners with helical or “spiral” capability acquire data continuously as the patient moves through the gantry ( Figure 7-7 ). Although depending on the CT protocol some data gaps may remain, the amount of missing data is substantially reduced by this technology. All modern scanners can acquire image data in this fashion. In the early years of CT, spiral CT for the diagnosis of PE was an important distinction, because nonhelical scanners were still in use at many institutions. Multislice CT introduces additional x-ray detectors. In scanners of this type, as the patient moves through the CT gantry, the emitter and detectors rotate around the patient in a circular path. The combination of continuous table motion and circular motion of the x-ray source and detectors results in a helical pattern of data acquisition. Data is acquired as a three-dimensional volume. Slices may be reconstructed in any plane, or three-dimensional reconstructions can be generated using sophisticated software. This technology offers substantial improvements in resolution, allowing structures less than a millimeter in size to be seen (the minimum slice thickness on most commercial CT scanners today is 0.625 mm). A tradeoff continues to exist between detail (resolution and signal-to-noise ratio) and radiation exposure. A high-resolution CT of the chest or abdomen exposes a patient to a radiation dose equivalent to approximately 400 chest x-rays. A common misconception is that a higher “slice number” of a CT scanner indicates higher resolution. Instead, the slice number (4 slice, 16 slice, 64 slice, etc.) refers to the number of x-ray detectors, which determines the number of slices that can be acquired simultaneously. This is independent of the slice thickness, which determines resolution. A higher slice number does allow a body region such as the chest to be scanned more quickly, minimizing motion artifact and thus improving test performance. Chapter 8 discusses some technical aspects of CT in more detail in the context of cardiac CT.

On CT, the density of tissues is measured in Hounsfield units (HU). Air has a density of −1000 HU, water 0 HU, and bone + 1000 HU. Fat, being less dense than water but denser than air, has a value of approximately −50 HU. Soft tissues such as muscle are somewhat denser than water and have an approximate value of +40 HU to +100 HU. A gray scale is then assigned spanning the range of densities, with the densest structures appearing white and the least dense appearing black. This gray scale can be shifted to accentuate tissues of interest. For example, if the user is interested in viewing details of bone, the computer reassigns the entire gray scale to values just below +1000 HU, allowing differentiation of subtle detail within bone. Detail of other structures is not visible on this setting, because all soft-tissue structures appear a fairly uniform gray whereas air remains black. If the user is interested in viewing lung detail, the gray scale is assigned to values near −1000 HU to accentuate details of low-density lung. Details of bone would be obscured on this setting, because all structures that are significantly denser than air would appear white. Most modern computerized picture archiving and communication systems (PACSs) allow the user to select from a list of useful preset variations in the gray scale, or windows. Typical window settings are lung, soft tissue (sometimes called vascular, chest–abdomen, or mediastinal), and bone. Most findings described in this chapter are seen best on soft tissue window settings, because these highlight detail of soft tissues and blood vessels. Some findings are seen best on lung windows, and these are specifically pointed out in the text and figure legends. Examples of window settings are shown in Figure 7-8 .

How Does CT Pulmonary Angiography Detect Pulmonary Embolism?
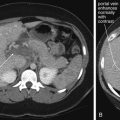
As described earlier, traditional pulmonary angiography uses contrast material injected through a catheter in the main pulmonary artery to fill the pulmonary arterial tree. A filling “defect,” or location where contrast fails to fill a vessel lumen, marks the presence of a PE (see Figures 7-4 and 7-5 ). CT pulmonary angiography relies on the same principle of filling defects in a stream of injected contrast ( Figures 7-9 and 7-10 ). The technique can be augmented by acquiring additional CT images of the pelvis and lower extremities to assess for clot in these locations, a test called CT venography (discussed later in this chapter). Contrast material is injected, usually peripherally through a catheter in the antecubital fossa. For CT pulmonary angiography, the CT acquisition is timed in an attempt to coincide with the arrival of the contrast bolus in the pulmonary arteries, after it has first traversed veins of the upper extremity, the subclavian vein, the superior vena cava, and the right atrium and ventricle ( Figure 7-11 ). An ideal scan is achieved with a rapid contrast bolus and perfect timing of the scan. A poor contrast bolus may fail to fill the pulmonary arteries, limiting diagnostic accuracy. A poor contrast bolus may cause either a false-negative or a false-positive result. In some cases, a vessel that is partially filled with contrast may simulate the filling defect of a PE, causing a false-positive result. More often, PEs may be missed because they are not visible unless surrounded by a bright bolus of contrast ( Figure 7-12 ) (a noncontrast chest CT is therefore not useful to assess for PE). A poorly timed scan may result in an image in which the pulmonary arteries are poorly opacified with contrast, because the contrast bolus has not yet reached or has already passed through the pulmonary arteries. Today, automated bolus tracking software improves the timing of the bolus. A technician injects a small test bolus of contrast, and CT images at the level of the main pulmonary artery are acquired over a few seconds. Enhancement of the pulmonary artery is measured over this time interval, allowing selection of the optimal timing of the full contrast injection and complete CT scan (see Fig. 7-12 ).


Small-caliber catheters and distally placed catheters (in the hand, wrist, or forearm) may result in a suboptimal contrast bolus and a nondiagnostic scan. A discussion of flow rates through peripheral catheters is given in Chapter 4 in the context of cervical CT angiography. An optimal contrast bolus requires an automated pressure injector, with an injection rate of around 4 to 5 mL per second. Phantom studies show that peripheral catheters as small as 20 gauge allow adequate contrast injection rates without exceeding safe pressure limits. Many institutions bar the use of central venous catheters with power injectors because of theoretical concerns of embolization of catheter fragments. Embolization has also been described with peripheral venous catheters, but this appears to be a much rarer event. Embolization occurs because of mechanical fragmentation of a catheter subjected to high pressures. Central venous catheters may be subject to fragmentation more than are peripheral catheters because of their length, which causes a linear increase in resistance to flow. In addition, a central catheter’s tip usually lies in the superior vena cava, with little obstruction to embolization of a fragment. In contrast, a peripheral catheter fragment may be prevented from embolizing because of valves in peripheral veins. Despite these concerns, a number of studies suggest that pressure injection through central venous catheters is safe. Some newer permanent and emergency devices are designed for high-pressure, rapid infusion. Examples include PowerPort and PowerLine, Bard Access Systems, which can tolerate 300 psi with a 5 mL per second maximum infusion rate (information from the manufacturer’s website).
What Are the Diagnostic Findings of Pulmonary Embolism on CT Pulmonary Angiography?
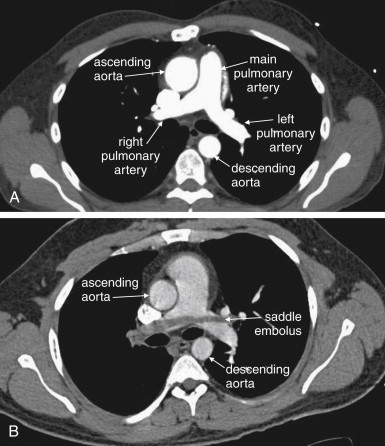
Large pulmonary emboli may be recognized easily by familiarity with a few basic points. Box 7-2 outlines a simple approach to CT interpretation for PE. Figures 7-9 and 7-10 depict classic findings of PE on CT scan. On CT, a normal pulmonary artery fills with contrast and appears bright white when viewed with soft-tissue windows. A PE within the vessel displaces contrast, creating a filling defect, which appears as a dark gray region within the vessel. The majority of pulmonary emboli occur within a few bifurcations of the main pulmonary artery, so inspection of the central pulmonary arteries may allow detection of PE in many cases. In one study, 51% of pulmonary emboli were found in central or lobar vessels, and 27% were in segmental vessels. In only 22% were isolated subsegmental vessels involved. More distal vessel branches may be more difficult to interpret because of their small size and the quality of the contrast bolus. Start your interpretation with inspection of the main pulmonary artery and its branches, because emboli in this location are both common and easily recognized ( Figures 7-13 through 7-28 ). Inspect for saddle pulmonary emboli (see Figures 7-10, 7-13, and 7-15 ) and right atrial and ventricular abnormalities (see Figures 7-16 and 7-17 ).


Several additional pieces of information may be helpful in the evaluation of the scan. First, pulmonary emboli are more common in vessels in lower lung segments (58% of cases), and these should be carefully inspected.
Second, many pulmonary emboli do not completely obstruct the vessel, and a characteristic appearance of contrast leaking around the embolus is often seen ( Figures 7-23 through 7-28 ). A possible pulmonary embolus seen on one axial image should be tracked through multiple adjacent images to confirm or refute the finding ( Figures 7-22 and 7-29 ; see also Figure 7-36 ). Coronal and sagittal plane images can also assist in this evaluation (see Figures 7-25 and 7-27 ).

Third, inspection of lung windows may aid in the detection of PE. As stated earlier, selecting lung windows simply refers to picking a default setting on a PACS that shifts the CT gray scale to accentuate the fine detail of low-density tissues such as lung. On lung
- 1.
Choose soft tissue or vascular window setting. Some PACS systems have preset vascular windows. These alter the normal soft tissue window to decrease bloom artifact caused by the contrast bolus.
- 2.
Assess contrast bolus quality.
- 3.
Assess for motion artifact.
- 4.
Locate the main pulmonary artery, and inspect for saddle embolism.
- 5.
Moving cephalad or caudad, inspect each large-order vessel for emboli.
Pearls for Pulmonary Embolism
- •
Look for more PEs in caudad vessels.
- •
Look for contrast leak around embolism.
- •
Use the patient’s pain location as an aid.
- •
Check lung windows for evidence of pulmonary infarction.
Pitfalls for Pulmonary Embolism
- •
Motion gives a false negative or positive.
- •
Tachypnea gives a false negative or positive.
- •
A slow scanner gives a false negative or positive.
- •
An obese patient gives a false negative or positive.
- •
Poor bolus gives a false negative or positive.
- •
Lymph nodes give a false positive.
- •
External compression gives a false positive.


False-positive and false-negative CT pulmonary angiography results may occur due a number of factors. A poor contrast bolus may not opacify the pulmonary arteries sufficiently to allow the filling defect of a pulmonary embolus to be recognized. Ironically, a very dense contrast bolus can also lead to misdiagnosis because of streak artifact that can obscure thrombus (see Figures 7-21, 7-36, and 7-47 ). A slow scanner or an extremely tachypneic patient may result in a false-negative or nondiagnostic scan because of excessive motion artifact. Lymph nodes immediately adjacent to blood vessels appear dark gray and may be mistaken for pulmonary emboli by inexperienced readers. A blood vessel compressed by an adjacent structure such as a lymph node, airway, or mass may have an irregular contour that may be mistaken for the filling defect of a PE. Extremely obese patients may have poor-quality scans resulting from underpenetration of radiation. Intentional inspiration and “breath hold” immediately before CT acquisition can introduce an artifact leading to false-positive interpretation by the following mechanism. With slower CT scanners, the patient is often instructed to take a deep breath and then to stop breathing during the scan to reduce motion artifact. Deep inspiration results in a sudden decrease in intrathoracic pressure, pulling noncontrasted blood into the right heart from the inferior vena cava. This can result in indeterminate or false-positive interpretation in a minority of cases, because the noncontrasted blood (which appears dark gray) may be mistaken for the filling defect of a PE. Ironically, faster scanners might worsen this artifact if deep inspiration is encouraged, because the entire CT acquisition occurs rapidly during the peak of the effect of inspiration.
Do CT Findings Predict Acute Morbidity and Mortality from Pulmonary Embolism?
A number of scoring systems have been proposed for severity of PE by CT. Surprisingly, saddle PE does not predict high mortality. CT can detect physiologic consequences of massive PE such as right ventricular dilatation, ventricular septal bowing, and decreased size of the left atrium and pulmonary veins from decreased pulmonary venous return. To date, studies are equivocal, with some suggesting that CT evidence of right ventricular dysfunction may predict morbidity and mortality and thus might be a criterion for aggressive therapy using interventional radiologic techniques, which are described in detail in Chapter 16 .
CT Pulmonary Angiography Sensitivity: When Is a Negative Scan Enough?
Although many measures of CT sensitivity can be considered, let’s start with two summary statements:
- 1.
A normal CT predicts a very low risk for PE in patients with low to moderate pretest probability.
- 2.
When very high clinical suspicion exists for PE, additional imaging is warranted following a negative CT pulmonary angiogram.
Later, we review the evidence for these statements.
CT as a diagnostic test for PE was attempted as early as 1978, but early attempts offered poor resolution, sensitivity, and specificity. This resulted from the use of single-slice, nonhelical technology. Because images were acquired at large distance intervals and with relatively thick slices, small pulmonary emboli were undetectable. Image acquisition speed was slow, resulting in motion artifact during respiration. By the late 1990s, studies of CT using single-slice helical scanning began to report CT sensitivity of 87% to 91% with specificity of 78% to 98%, which compared favorably with the alternative diagnostic tests, VQ scan and pulmonary angiography. By 2002 to 2005, reports emerged of modern helical multislice scans offering superior image resolution with visualization of subsegmental pulmonary arteries, limited gaps in data, and rapid scan acquisition, eliminating respiratory and cardiac motion artifact. For these reasons, when evaluating studies on the sensitivity and other test characteristics of CT for PE, it is important to determine whether modern CT equipment was used in the study. Although CT remains a limited test, it uses the same basic principles as traditional pulmonary angiography as described earlier, and the test characteristics of the two modalities have converged as CT technology has continued to improve. The most current studies of CT show high sensitivity and specificity when compared with pulmonary angiography. Questions have begun to arise about the proper criterion diagnostic standard when comparing the two techniques, because pulmonary angiography itself is subject to false positives and false negatives.
Before examining the evidence in detail, let’s reexamine our goal in performing diagnostic imaging for detection of PE. CT accuracy can be evaluated using two general strategies. The first is a “disease-oriented outcome” standard, meaning the presence or absence of PE, as detected by some reference test and compared with CT. The second is a “patient-oriented outcome” standard, based on the clinical outcome (morbidity or mortality) for a patient with a normal CT scan who is not treated with anticoagulation. The second may be the more important standard, because our primary goal as emergency physicians is to prevent morbidity and mortality.
Literally hundreds of published articles exist on the topic of CT for PE; a PubMed search using the terms “CT,” “pulmonary,” and “angiography” found 1679 matches with more studies published each day. (The author performed that first search on March 8, 2010, but by March 21, 2011 the number of PubMed matches had grown to 2025). Here, we consider a few of the key studies underlying our understanding of CT sensitivity and specificity. Early studies of single-detector CT were haunted by questions of undetected subsegmental pulmonary emboli with possible significant patient morbidity and mortality resulting from undiagnosed and untreated thrombus. However, new studies of multidetector CT demonstrate the ability to image subsegmental pulmonary arteries. Most importantly, patient outcomes after negative CT are similar to those after negative traditional pulmonary angiography. A 2005 review found that the incidence of PE 6 to 12 months after negative traditional pulmonary angiography was approximately 1.6%, whereas a negative CT pulmonary angiogram carried a 1.3% average incidence of VTE. Exceptions to this may include patients with symptoms of deep venous thrombosis (DVT), in whom further evaluation may be warranted if CT pulmonary angiography is negative. To be fair, these outcome numbers are influenced not only by the sensitivity of the two tests, but also by the risk profile of the patient populations being tested. Patients subjected to formal pulmonary angiography are typically at high risk (high pretest probability) of PE, warranting the use of an invasive test for evaluation. Thus a low rate of PE following a negative angiogram in this population is impressive, reflecting high test sensitivity. In contrast, patients undergoing CT pulmonary angiography have a low overall risk of PE, so good outcomes following normal CT pulmonary angiography are as much a measure of the low pretest probability of disease as of the test’s sensitivity. We will consider this issue in more detail in the discussion to come.
Outcome Studies Following Negative CT Pulmonary Angiography
A systematic review and meta-analysis (including both single and multidetector CT) published in JAMA in 2005 found that the likelihood ratio negative for PE following a negative chest CT was 0.07 (95% CI = 0.05-0.11). The likelihood ratio negative for mortality attributable to PE was 0.01 (95% CI = 0.01-0.02) at follow-up of 3 to 12 months. These values are similar to those reported for conventional pulmonary angiography. Other investigators have also reported good clinical outcomes (98% or greater survival without venous thromboembolic disease) in the 6 months after a negative chest CT, without additional DVT testing. The Christopher Study, a prospective multicenter study of 3306 patients published in JAMA in 2006, examined VTE outcomes in patients with negative chest CT who were not anticoagulated. The 3-month rate of VTE was only 1.3% (95% CI = 0.7%-2.0%), with a mortality rate of 0.5% (95% CI = 0.2%-1.0%). A 2009 meta-analysis found a similar 3-month incidence of VTE (1.2%, 95% CI = 0.8%-1.8%) following normal CT pulmonary angiography and conventional pulmonary angiography (1.7%, 95% CI = 1.0%-2.7%). Fatal pulmonary emboli were rare in the 3 months following a normal CT, occurring in 0.6%. The authors also evaluated the incremental safety provided by performing bilateral compression ultrasound to evaluate for DVT but found no statistically significant difference in 3-month risk for PE or fatal PE with this additional testing strategy.
In JAMA in 2007, Anderson et al. reported a randomized, controlled, single-blinded noninferiority trial comparing CT and VQ scan to assess the safety of CT as an initial test for acute PE. The study examined a high-risk population of 1417 patients, all with a Wells score of 4.5 or greater or positive D-dimer results. Patients were randomized to assessment with either VQ scan or CT scan. Initial diagnosis with PE was made for 19.2% of patients in the CT group and 14.2% of patients in the VQ scan group. Patients with negative imaging results did not receive anticoagulation and were followed for 3 months to determine the interval development of either PE or proximal DVT. Only 0.4% of patients with negative initial CT scan results and 1.0% of those with negative VQ scan results developed thromboembolism during the follow-up, with no statistical difference between the two groups. This study offers strong evidence that either CT scan or VQ scan is a safe initial approach to rule out PE in the emergency department, with a negative predictive value of 99%.
You may recall that negative predictive values are subject to variation depending on the rate of disease in the study population and are relatively discouraged as a reported measure of a test’s accuracy for this reason. Consider the extreme example of a test that is always negative for PE and therefore has a sensitivity of 0%. If used in a study population consisting of 99 patients without PE and 1 patient with PE, the test would have a 99% negative predictive value, because only a single patient has the disease. Then, why should we accept a negative predictive value in Anderson et al.’s study? This study examined a high-risk population, with an overall rate of PE of 16.5%. This is likely a higher rate of thromboembolic disease than would occur in most emergency department cohorts being evaluated, so the test likely will perform with a similarly high negative predictive value in our patients. Consider how our hypothetical 0% sensitivity test would perform in this population. It would fail to identify all patients with PE (16.5%), so the negative predictive value would be only 83.5%. Anderson et al.’s study suggests that both VQ and CT perform well in sorting from a high-risk population those patients who can safely avoid anticoagulation. The authors point out that CT diagnosed more patients with PE than did VQ scan, yet those with negative CT or VQ fared equally well without anticoagulation. This implies that some of those diagnosed with PE by CT scan either did not really have the disease or did not require anticoagulation therapy for it. Overdiagnosis of PE remains a potential concern with CT scan, as this may subject patients to unnecessary anticoagulation.
CT, VQ scan, and Likelihood Ratios: Altering Pretest Odds With a Negative Diagnostic Imaging Test
Another measure of test diagnostic accuracy is likelihood ratio. Two likelihood ratios can be calculated for every test, based on the test’s sensitivity and specificity. The likelihood ratio positive (LR+) is the probability of a person who has the disease in question testing positive divided by the probability of a person who does not have the disease testing positive. This is also mathematically represented as LR+ = sensitivity/ (1-specificity). The likelihood ratio negative (LR-) is the probability of a person who has the disease in question testing negative divided by the probability of a person who does not have the disease testing negative. It is mathematically represented by LR− = (1-sensitivity)/specificity. The pretest odds of the diagnosis multiplied by the appropriate likelihood ratio determines the post-test odds. Odds and probability can be mathematically interconverted. Although the pretest odds cannot be specifically determined for an individual patient, it can be estimated by the physician based on factors such as the overall prevalence of disease in a given emergency department and the given patient’s similarity to the overall population (e.g., more at risk or less at risk than an average patient). A likelihood ratio positive greater than 10 strongly increases disease probability, effectively ruling in disease for all but the lowest-risk patients. A likelihood ratio negative less than 0.1 strongly decreases disease probability, effectively ruling out disease in all but the highest-risk patients. Given this background, what are the LR+ and LR− values for CT pulmonary angiography and VQ scan (a test for pulmonary embolism discussed later in this chapter)?
Roy et al. performed a systematic review and meta-analysis of strategies for diagnosis of acute PE, published in BMJ in 2005. The authors provide likelihood ratios for CT and VQ scan, which are useful in our clinical decisions. Positive likelihood ratios were as follows: “high probability” VQ scan was 18.3 (95% CI = 10.3-32.5), CT was 24.1 (95% CI = 12.4-46.7), and lower extremity venous ultrasound was 16.2 (95% CI = 5.6-46.7). Because positive likelihood ratios greater than 10 are generally considered to be helpful in ruling in a disease process, all three diagnostic strategies could be considered confirmatory if positive in a patient with a moderate or high pretest probability of PE. Negative likelihood ratios were as follows: normal or near-normal VQ scan was 0.05 (95% CI = 0.03-0.10), and negative CT plus negative lower extremity ultrasound was 0.04 (95% CI = 0.03-0.06). Because a test with a likelihood ratio negative less than 0.1 is considered to provide strong evidence against a disease process, a normal VQ or CT plus ultrasound can be used to rule out PE in all but the highest-risk patients. The authors noted that the likelihood ratio negative of a negative CT alone (without ultrasound) was only 0.11 (95% CI = 0.06-0.15) and therefore concluded that CT alone should only be used to rule out PE in low-risk patients. Adding ultrasound evaluation may be prudent in patients with higher clinical risk. A low-probability VQ scan had a negative likelihood ratio of 0.36 (95% CI = 0.25-0.50), meaning that it reduces the likelihood of PE but only moderately. In very-low-risk patients, this may equate to an acceptably low risk for PE, but in high-risk patients, a “low probability” VQ scan does not rule out PE. Likelihood ratios are based on sensitivity and specificity values, so what do published studies say about CT sensitivity and specificity?
Studies of CT Pulmonary Angiography Sensitivity and Specificity
A 2002 meta-analysis of 12 studies from 1990 to 2000 comparing CT to standard pulmonary angiography or high-probability VQ scan found an overall sensitivity of 74.1% and specificity of 89.5%, with broad reported ranges for both sensitivity (57% to 100%) and specificity (68% to 100%). A systematic review and meta-analysis published in 2005 in Radiology (including single and multidetector CT) found the pooled sensitivity for CT to be 86% (95% CI = 80.2%-92.1%) with a specificity of 93.7% (95% CI = 91.1%-96.3%). In other words, a positive CT is likely to rule in PE correctly, but a negative CT might miss as many as one in five patients with PE. A 2006 review reached similar conclusions, finding that CT pulmonary angiography alone was relatively insensitive but, when combined with lower extremity DVT diagnostic testing, had a false-negative rate of only 1.6%.
In 2006, the results of the multicenter PIOPED II study were published in the New England Journal of Medicine. This National Institutes of Health–funded prospective study used a composite reference standard, including additional imaging results, to determine the accuracy of multidetector CT. The study included 4-, 8-, and 16-detector CT scanners. Overall, the study found CT pulmonary angiography to be 83% sensitive (95% CI = 76%-92%) with a specificity of 96% (95% CI = 93%-97%). The likelihood ratio positive was 19.6 (95% CI = 13.3-29.0), indicating that a positive CT scan strongly predicts the presence of PE. The likelihood ratio negative was 0.18 (95% CI = 0.13-0.24), indicating that a negative CT substantially reduces but does not exclude the possibility of PE. Remember that a test with a likelihood ratio positive greater than 10 is thought to suggest a disease process strongly, whereas a likelihood ratio negative less than 0.1 is necessary to exclude a diagnosis confidently. The investigators also reported the positive predictive values in patients with intermediate and high pretest probability and the negative predictive value of CT angiography in patients with low pretest probability. Positive predictive values of CT in intermediate- and high-risk patients were 92% and 96%, respectively. Negative predictive value was 97% in low-risk patients. As described earlier, positive and negative predictive values are influenced by the prevalence of disease in the subject groups and are generally discouraged as a means of describing test properties. However, in this case, reporting predictive values stratified by clinical pretest probability is appropriate, because validated tools (Wells score and others) are available to us as emergency physicians to allow us to identify patients with similar probability of disease. The authors concluded that a CT finding that is concordant with pretest probability is highly predictive, whereas discordant imaging and clinical risk assessment should be followed with additional testing. The relatively low sensitivity of CT pulmonary angiography in PIOPED II (83%) may come as a surprise, and deserves comment. The reference standard for the diagnosis of PE in PIOPED II was designed to be extremely conservative, and included the diagnosis of DVT by venous ultrasound in a patient whose other diagnostic tests for PE were negative. Thus a DVT was assumed to be a surrogate for the diagnosis of PE, and a negative CT pulmonary angiogram in this setting was considered to be a false negative. While from a clinical perspective, patients with DVT require anticoagulation, it is not actually true that all patients with DVT also have PE. Thus, this reference standard exaggerates the false negative rate (and thus decreases the apparent sensitivity) of CT for PE. 13.5% of PE diagnoses in PIOPED II were based on such ultrasound findings. If these patients in truth had isolated DVT without PE, the negative CTs that occurred in some of these patients would be true negatives, not false negatives, and the sensitivity of CT would be higher than that reported by the PIOPED II investigators.
In another publication, the PIOPED II investigators recommended several diagnostic pathways based on clinical pretest probability. They point out that a negative CT angiogram in a low-risk patient has an excellent negative predictive value (96%) and recommend against treatment in this group. They point out a slightly improved negative predictive value (97%) when CT venography (CTV) of the lower extremities is also performed, although controversy exists about this technique because the small additional diagnostic yield comes at the cost of considerable additional radiation exposure. Notably, they recommend additional diagnostic testing in low pretest probability patients with positive CT angiography results resulting from positive predictive values of only 68% for segmental PE and 25% for subsegmental PE. Segmental and subsegmental filling defects on CT are more prone to interobserver error and may result from poor contrast bolus or other artifacts, rather than PE. They are therefore less predictive of PE. If CT demonstrates main or lobar PE, for which positive predictive value is high (97%), the PIOPED investigators recommend treatment without further testing. Filling defects in main or lobar pulmonary arteries are usually readily recognized and easily distinguished from artifact; therefore, they are more predictive of PE.
For patients with moderate pretest probability assessment, the PIOPED II authors suggest treatment in accordance with CT results without further diagnostic testing because of good negative and positive predictive values in this group (89% and 92%, respectively). In patients with high-probability clinical assessment, they recommend treatment for positive CT findings (positive predictive value = 96%) but further workup if CT is negative because of a negative predictive value of only 60% for CT angiography and 82% for CT angiography plus lower extremity CTV.
These recommendations from PIOPED II may be unnecessarily conservative, because they reflect a disease-oriented outcome based on CT sensitivity, not based on patient outcome. PIOPED II did follow patients to 3 and 6 months by phone interview, but the clinical outcomes of patients with negative CT were not reported. It is not clear from the study that PEs missed by CT scan resulted in patient deaths or significant morbidity. Other studies have shown a very low yield of routine lower extremity imaging for DVT in asymptomatic patients with negative chest CT. Rates of additional DVT found using this technique are as low as 0.7% to 2.7%, with costs as high as $200,000 per additional isolated DVT diagnosed. An overall algorithm incorporating pretest probability and CT results in shown in Table 7-4 .
| Pretest Probability of Pulmonary Embolism | CT SCAN RESULT | ||
|---|---|---|---|
| Normal CT | CT POSITIVE | ||
| Segmental or Subsegmental Pulmonary Embolism | Main or Lobar Pulmonary Embolism | ||
| Low probability | Excludes PE | Does not completely confirm PE; consider additional imaging to confirm diagnosis (repeat CT, VQ, pulmonary angiogram, or lower extremity imaging for DVT) | Confirms PE |
| Moderate probability | PE unlikely, but consider lower extremity imaging for DVT | Confirms PE | Confirms PE |
| High probability | Does not completely exclude PE; consider additional imaging to confirm diagnosis (VQ, pulmonary angiography, or lower extremity imaging for DVT) | Confirms PE | Confirms PE |
Related posts:
Stay updated, free articles. Join our Telegram channel

Full access? Get Clinical Tree


