No
Neurogenic tumors
Benign neurofibromas schwannomas
Malignant peripheral nerve sheath tumor
Good
Giant cell tumor
Comes
Chordoma
Benign notochord cell tumor (BNCT)
Of
Osteoblastoma
A
Aneurysmal bone cyst (ABC)
Sacral
Sarcomas
Ewing’s sarcoma
Osteosarcoma
Chondrosarcoma
“Simulators”
Red marrow
Paget disease
Stress fractures
Mass
Mets, myeloma, lymphoma
Meningocele and Tarlov cysts
The diagnoses on the differential diagnosis can be subdivided into general categories based on the patient’s age. For example, ABC, osteoblastoma, Ewing’s sarcoma, and osteosarcoma tend to occur in patients less than 20 years old. Since osteosarcomas in the spine tend to occur in older patients than osteosarcoma in other locations, osteosarcoma should also be included in the differential for a malignant-appearing destructive solitary mass in the sacrum of a patient between the ages of 20 and 40 years. Neurogenic tumors and giant cell tumors tend to occur in patients between the ages of 20 and 40 years. Chordomas, metastases, myeloma, lymphoma, chondrosarcoma, and secondary osteosarcomas as well as the tumor simulators tend to occur in patients over the age of 40 (Table 4.2) [1, 2, 5–9].
Table 4.2
General guidelines for formulating an appropriate differential diagnosis for sacral tumors based on age
Age in years | Less than 20 | 20–40 | Greater than 40 |
|---|---|---|---|
Benign | ABC | Giant cell tumor | Tarlov cysts |
Osteoblastoma | Schwannoma | Tumor simulators | |
Neurofibroma | Stress fracture | ||
Paget disease | |||
Red marrow | |||
Malignant | Ewing’s sarcoma | MPNST | MPNST, usually <50 |
Osteosarcoma | Osteosarcoma | Chordoma | |
Mets | |||
Myeloma | |||
Lymphoma | |||
Chondrosarcoma | |||
Osteosarcoma (secondary to radiation and Paget disease) |
4.5 Imaging Findings of the Most Common Benign and Malignant Neoplasms in the Sacrum and Tumor Simulators
4.5.1 Neurogenic/Peripheral Nerve Sheath Tumors
Peripheral nerve sheath tumors (PNSTs) are divided into benign and malignant categories. Benign PNSTs include neurofibromas and schwannomas and most commonly occur in patients between the ages of 20 and 40 years of age. The malignant categories, formerly referred to as neurofibrosarcomas, malignant schwannomas, and neurogenic sarcomas, are currently termed malignant peripheral nerve sheath tumors (MPNST) by the World Health Organization and are most commonly seen in patients between the ages of 20 and 50 years [7–9]. Any of these categories can be associated with neurofibromatosis type 1, and the risk of malignant degeneration is higher in these patients due to the multiplicity and long-standing nature of these tumors. In the general population, the lifetime risk of malignant transformation of a benign neurogenic tumor is 3–5%. In patients with neurofibromatosis type 1, the risk is as high as 15–20% [10]. Although neurogenic tumors can arise in any location, they most commonly occur near the trunk. The sacral plexus is one of the most common sites, along with the sciatic nerve and brachial plexus. These are typically intradural extramedullary lesions and are not true primary tumors of the sacrum but take their origin within the sacral spinal canal and/or within the sacral neural foramen, with resultant expansion or infiltration of the surrounding bone. Subsequently, they may present as a mass involving the sacrum with a significant presacral soft tissue mass. They may also present as a predominantly presacral soft tissue mass with or without direct anatomic extension into adjacent sacral neural foramina.
Pathologically, neurofibromas and schwannomas have distinctly different relationships to the parent nerve. Neurofibromas show more intimate involvement of the nerve with the parent nerve entering and exiting the fusiform mass, whereas schwannomas show more eccentric involvement of the nerve. It is often impossible to differentiate schwannomas from neurofibromas based on imaging features. This is especially true in the sacrum where the entering nerve segment is much shorter and, therefore, more difficult to characterize the relation of the mass to the parent nerve [2, 7, 11]. The majority of neurofibromas and schwannomas are solitary. However, the presence of multiple nerve sheath tumors suggests a diagnosis of neurofibromatosis.
Benign peripheral nerve sheath tumors grow along nerve segments and often cause chronic indolent remodeling of the cortical surfaces of the sacrum. This growth pattern manifests as expansion of the spinal canal and/or neural foramina and sclerosis along the margins of the expanded bone (Fig. 4.1). The chronic indolent character of the bone remodeling is best evaluated on CT (Fig. 4.1). Most benign peripheral nerve sheath tumors in or around the sacrum will present as a soft tissue mass filling and expanding the associated neural foramen and/or spinal canal with frequent extension into the presacral soft tissue spaces. They often present with a dominant presacral component. Long-standing benign schwannomas may reach huge sizes in the pelvis and often contain areas of cystic degeneration and calcifications (sometimes referred to as “ancient schwannomas”). On MRI (Fig. 4.2), most benign peripheral nerve sheath tumors are intermediate (similar or isointense to skeletal muscle) on T1 and either homogeneously or heterogeneously hyperintense on T2, sometimes showing a “target sign” with a central hypointense area within the T2 hyperintense mass [7, 8]. Up to 70% of benign peripheral nerve sheath tumors will show some degree of heterogeneity on T2 [8]. On post gadolinium images, these lesions usually enhance avidly, usually homogeneously or with mild heterogeneity. However, large long-standing schwannomas may show more heterogeneity with areas of non-enhancing cystic degeneration.
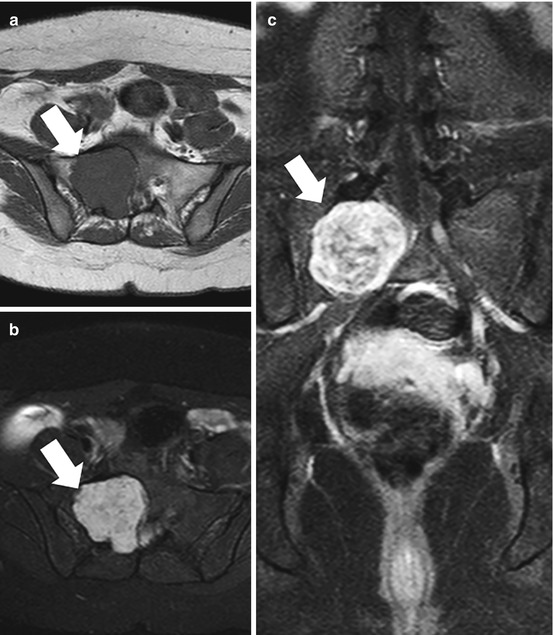
Fig. 4.1
AP radiograph (a) and axial CT images (b and c) of the sacrum in a 33-year-old female with a schwannoma demonstrate a lytic expansile lesion centered upon the right S1 neural foramen. Although the lesion is detected on the radiograph (thin arrows), it could easily be confused with overlying bowel gas. The CT shows the lesion to better advantage and characterizes the benign nature of the growth pattern with expansion of the bone and a thin peripheral rim of sclerosis (thick arrows)
Fig. 4.2
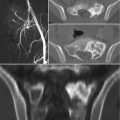
Axial T1 (a), T2 with fat suppression, (b) and gadolinium-enhanced SPGR (c) MR images from the patient illustrated in Fig. 4.1 show typical signal characteristics of a schwannoma with intermediate signal on T1, heterogeneous predominantly hyperintense signal on T2, and avid heterogeneous enhancement
There is significant overlap in the imaging appearance of benign and malignant peripheral nerve sheath tumors. Although size alone cannot be used to differentiate benignity from malignancy, MPNSTs are generally larger than their benign counterparts, with average measurements reported at 10 cm, whereas the average size of a benign neurofibroma has been reported to be 5 cm [8] (Figs. 4.3 and 4.4). On CT imaging of MPNSTs, bony involvement may be more infiltrative with irregular margins between the mass and the adjacent bone (Fig. 4.3). However, more chronic benign-appearing foraminal expansion and cortical remodeling are often seen in MPNTs. The presence of chronic bone remodeling and the absence of infiltration into adjacent bone should not be used to assume benignity. On MRI, MPNSTs often demonstrate more heterogeneity on all imaging sequences. Although benign neurogenic tumors may have cystic change and heterogeneity, dominant areas of intratumoral cystic change and necrosis and a peripheral enhancement pattern with or without intratumoral cystic change should raise the level of suspicion that a neurogenic tumor may be malignant (Fig. 4.4). In addition, the presence of perilesional edema with feathery areas of increased T2-weighted signal adjacent to the mass should also raise suspicion of a malignant mass in the setting of a suspected nerve sheath tumor [7–9]. Pain and rapid growth are also concerning features.
Fig. 4.3
Axial CT images of the upper pelvis (a and b) of a 16-year-old female with a malignant peripheral nerve sheath tumor demonstrate a mass involving the left S1 nerve root with associated chronic-appearing expansion of the neural foramen (black arrows). The mass is in anatomic continuity with a large solid heterogeneous presacral soft tissue mass (asterisks). Axial CT of the lower pelvis (c) shows that the soft tissue mass extends inferiorly where it fills nearly the entire pelvis and courses toward the left sciatic notch (curved arrows). Axial T1-weighted MRI (d) shows that despite the chronic-appearing expansion of the left S1 neural foramen, there is evidence of permeation of the tumor into the adjacent sacral ala (thin arrow)
Fig. 4.4
Axial (a) and sagittal (c) T1-weighted and axial (b) and sagittal (d) T2-weighted MR images of the patient in Fig. 4.3 with a malignant peripheral nerve sheath tumor illustrate the massive size of the tumor which fills the entire pelvis (asterisks) and is in anatomic continuity with the mass involving the S1 nerve root. The mass is markedly heterogeneous with focal areas of internal necrosis (arrow) and is associated with perilesional edema on the T2-weighted images
Benign peripheral nerve sheath tumors are at risk for malignant degeneration, especially plexiform neurofibromas in patients with neurofibromatosis type 1. These patients typically have innumerable complex plexiform masses of varying sizes, and determining which lesions are suspicious for malignant degeneration can be extremely challenging. Recently, 18FDG PET–CT has been shown to be a promising imaging tool for identifying tumors that are suspicious for malignant degeneration [10, 12]. Full-body imaging can be performed which is particularly advantageous in patients with neurofibromatosis and multiple masses. Lesions with higher FDG uptake are considered worrisome for malignant transformation. Although different threshold standard uptake values (SUV) have been described, in general, masses with an SUV less than 4 are at low risk for malignancy. Lesions with an SUV between 4 and 7 are intermediate risk, and an SUV greater than 7 is highly suspicious for malignant degeneration [10]. In addition, these plexiform masses are often huge, and PET–CT can be useful for identifying a specific area within a large mass to target for preoperative image-guided biopsy, decreasing the chance of sampling error.
4.5.2 Giant Cell Tumors
The majority of giant cell tumors (GCT) of the bone are benign and composed of a spindle cell stroma with intermixed ovoid mononuclear giant cells that have osteoclastic activity [5, 13, 14]. Although usually benign, they can be locally aggressive and may recur after resection. Approximately 5–10% are malignant, either primary malignant giant cell tumor of the bone or dedifferentiation within a recurrence [2, 15]. Metastases to the lungs, although rare, may occur with benign tumors [2, 13]. These tumors generally occur in patients in the second through fourth decades of life, more commonly in females [5]. Giant cell tumor (GCT) of the bone is most commonly found in the ends of long bones of skeletally mature patients, manifesting as a well-defined eccentrically located lytic lesion, usually without a sclerotic margin, extending to the subchondral bone of the articular surface. However, 15% of GCT involve flat bones and up to 7% of cases of GCT have been reported in the spine. Of the cases occurring in the spine, 90% occur in the sacrum [1, 2, 5, 13, 14]. GCT is the second most common primary bone tumor of the sacrum after chordoma. When GCT involves the sacrum, they most commonly occur in the upper sacrum and often involve both sides of midline but are usually eccentrically located, lateralizing to one of the sacral alae [1].
In the sacrum, radiographic and CT findings are also of a lytic lesion but may be more destructive than typically seen in long bones, often destroying the cortex of the sacral neural foramina and frequently extending across the sacroiliac joint (Fig. 4.5). On CT, these masses are soft tissue attenuation and appear expansile or purely lytic without any evidence of mineralization. Although there is usually a narrow zone of transition without a sclerotic rim as in GCT of the long bones, in the sacrum, and in the spine, a thin rim of sclerosis may occasionally be seen [13]. Large soft tissue masses may also be present (Fig. 4.5).
Fig. 4.5
AP radiograph (a), coronal (b) and axial (d) unenhanced bone window, and axial soft tissue window (c) CT images show typical imaging features of a giant cell tumor of the sacrum in a 29-year-old female. The lesion demonstrates a purely lytic pattern of destruction with a peripheral rim of sclerosis and a large associated soft tissue mass anteriorly and posteriorly (arrows). The lesion also crosses the SI joint (asterisk) and involves the adjacent ilium
On MRI (Fig. 4.6), GCT of the bone usually demonstrate low to intermediate signal on T1 but may have areas of increased T1 signal associated with intralesional hemorrhage. On T2-weighted or fluid-sensitive sequences, there may be significant heterogeneity due to hemorrhage or necrosis, but these tumors frequently have predominantly low to intermediate T2 signal due to the presence of fibrous components and hemosiderin. The low T2 signal may aid in differentiating GCT from malignant and other benign masses in the sacrum that usually show predominantly bright T2 signal [13]. However, areas of increased T2 signal are often present as well due to fluid and cystic changes. Secondary aneurysmal bone cyst formation occurs in up to 14% of GCT of the bone which may result in prominent areas of cystic change and extensive fluid–fluid levels [14]. On post contrast CT and MR imaging, these tumors usually show significant enhancement of the non-cystic components.
Fig. 4.6
Sagittal T1 (a), sagittal T2 (b), and sagittal gadolinium-enhanced SPGR (c) MR images of the giant cell tumor from patient illustrated in Fig. 4.5 show a large destructive heterogeneous mass extending from S1 to S4 with a large associated soft tissue mass extending both anteriorly and posteriorly. The mass is markedly heterogeneous on all of the image sequences with areas of solid heterogeneous enhancement and scattered foci of fluid signal intensity (asterisk) that could be due to cystic change or necrosis. Of interest, there are significant areas of low to intermediate signal on the T2-weighted image in the bone and soft tissue component of the tumor which can be seen in GCT due to the presence of fibrous tissue and hemosiderin
4.5.3 Chordoma and Benign Notochordal Cell Tumors
Chordoma: Chordomas are rare tumors, accounting for 2–4% of all primary malignant bone tumors. However, excluding lymphoproliferative malignancies, it is the most common primary tumor of the sacrum, accounting for 40% of all primary sacral neoplasms, including both benign and malignant tumors [1, 13, 16]. Chordomas are malignant neoplasms that develop from remnants of the primitive notochord. During development, the notochordal tissue is relegated to the intervertebral regions to become the nucleus pulposus as the cylinder of notochord tissue is replaced by cartilage-producing sclerotomes. Vestiges of nonneoplastic notochord tissue are found in up to 2% of cadavers, usually in the midline near the spheno-occipital synchondrosis and in the sacrococcygeal regions, paralleling the most common locations for chordomas with 30–35% occurring in the spheno-occipital region and 50–60% in the sacrococcygeal region. In the sacrum, chordomas are more common in the fourth and fifth sacral segments [1, 2, 13, 16, 17]. Chordomas occur in all age groups but occur most commonly in the fourth to seventh decades of life and are more common in males, with a 2:1 male to female ratio [2, 17].
Radiographs may reveal a lytic lesion in the sacrum with a soft tissue mass containing calcifications. CT will show a destructive lytic lesion, typically in the midline or paramidline, extending into the sacral spinal with a large lobulated midline exophytic presacral soft tissue mass (Fig. 4.7) [1, 2, 5, 11, 13]. Internal calcifications are frequently seen, occurring in approximately 50–70% of cases, with some series reporting detectable calcifications within the mass in up to 90% of cases on CT [13, 18–21]. The calcifications can be related to chronic areas of hemorrhage and necrosis as well as chondroid matrix [1]. The resulting calcifications may be amorphous, predominantly peripheral or punctate and chondroid in nature, with a similar appearance to the matrix seen in chondrosarcomas. Chondrosarcomas are much less common in the sacrum and, in contrast to chordoma, tend to occur eccentrically within the sacrum [16].
Fig. 4.7
Axial soft tissue window CT images of the lower sacrum of a 61-year-old male show typical imaging features of a chordoma with a lytic destructive lesion in the lower sacrum (asterisk) that is centered on the midline, has a large associated exophytic presacral soft tissue mass (arrows), and contains scattered punctate calcifications (circle)
On MRI, chordomas typically present as a solid mass centered within the midline or paramidline lower sacrum with heterogeneous T1 and T2 signal and variable heterogeneous enhancement [1, 2, 5, 11, 13, 16, 18] (Fig. 4.8). Chordomas often have evidence of internal hemorrhage which may show areas of high T1 signal within a heterogeneously T1 low and intermediate signal intensity mass. They often demonstrate prominent lobulated regions of T2 hyperintensity within the lobulated sacral and presacral soft tissue mass, again with significant heterogeneity and foci of lower T2 signal related to intralesional hemorrhage and/or calcifications. Chordomas often cross disk spaces or sacral segments, a characteristic that is more unique and distinctive in the tumors involving the mobile spine (the spine above the sacrum). When large, chordomas may also cross the sacroiliac joint [16].
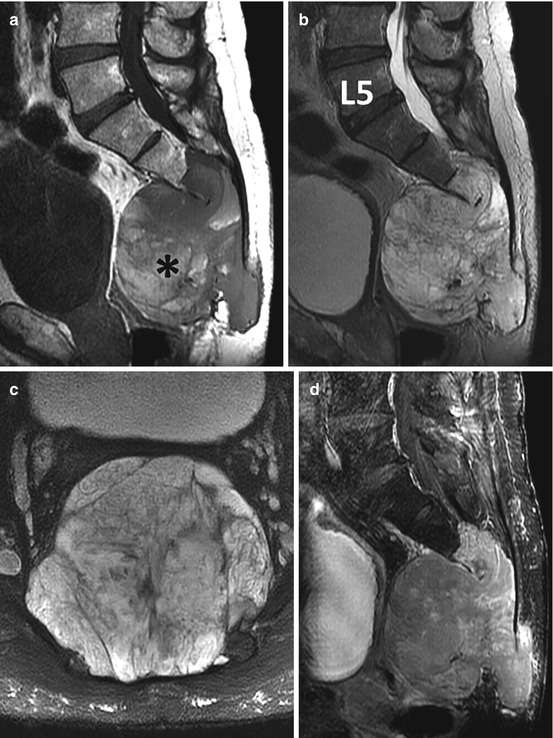
Fig. 4.8
Sagittal T1 (a), sagittal T2 (b), axial T2 (c), and sagittal gadolinium-enhanced (d) MR images show a large heterogeneous solid destructive mass involving the majority of the sacrum and coccyx typical of chordoma (same patient illustrated in Fig. 4.7). The MRI nicely demonstrates both the intraosseous and extra-osseous extent of the tumor. There are areas of increased signal within the mass on T1 indicative of intralesional hemorrhage (asterisk), and the mass shows minimal patchy enhancement that reflects the myxoid component of the tumor
Benign Notochordal Cell Tumors: Benign notochordal cell tumors (BNCTs), previously referred to as benign chordoma, giant notochord rest, and giant notochord hamartoma, are benign intraosseous lesions of notochord cell origin, initially described in 1999. These represent a distinct entity from remnant notochord rests [22–24]. On radiographs, BNCTs are usually occult. Although they may also be occult on CT, BNCTs typically present as a small midline focus of subtle hazy sclerosis without evidence of a destructive osteolytic component (Fig. 4.9). BNCTs are often discovered incidentally on MRI, where they typically present as a small intraosseous midline mass with nonspecific intermediate T1 signal, predominantly hyperintense T2 signal, and no significant enhancement on post gadolinium contrast-enhanced images (Fig. 4.9). The margins of the mass are often slightly lobulated. In addition, they may contain tiny foci of bright intralesional fat that can be identified with careful scrutiny of the T1-weighted and corresponding fat-suppressed T2-weighted images. This finding is crucial in differentiating BNCT from chordoma as chordomas should not contain intralesional fat [25]. There have been reported cases of BNCT with atypical features including a small area of cortical permeation and a tiny associated soft tissue mass. In these cases, there was absence of lytic destruction in the bone and there were tiny amounts of intralesional fat suggesting the diagnosis of BNCT. In atypical or equivocal cases as described above, CT-guided biopsy can be performed to make the diagnosis of a BNCT and avoid unnecessary surgical resection [25].

Fig. 4.9
Sagittal CT (a) shows a subtle region of hazy sclerosis in the S2 segment. This corresponds with a small nodular mass with predominantly intermediate signal intensity on sagittal T1-weighted (b) and hyperintense signal intensity on T2-weighted (c) MR images. Axial T2-weighted MRI (d) shows that the mass is centered on the midline (thick arrow) and axial gadolinium-enhanced SPGR MRI (e) shows that there is no enhancement in the mass (circle). There is subtle stippling of the signal pattern on the MR images that correlates with tiny foci of intralesional fat. The constellation of imaging findings is typical of a benign notochordal cell tumor
4.5.4 Osteoblastoma and Osteoid Osteoma
Osteoblastoma and osteoid osteoma are similar but distinct lesions with different imaging features and clinical courses [13]. Osteoid osteoma and osteoblastoma are rare in the sacrum [2, 11].
Osteoblastoma is a rare benign but locally aggressive bone producing primary bone tumor that constitutes only 1–2% of all primary bone tumors, usually presenting in the second decade of life. This tumor has a predilection for the spine with 30–40% of cases occurring in the spine [26, 27]. Of osteoblastomas occurring in the spine, 7–17% occur in the sacrum [26, 27]. Osteoblastomas in the sacrum usually occur in the posterior elements of the upper sacrum and can have a varied CT and radiographic appearance. They range from a round well-defined radiolucent lesion greater than 1.5 cm with surrounding sclerosis to an expansile lesion with a sclerotic rim that contains multiple small internal calcifications [13]. They may also present with more aggressive features as an expansile destructive mass with infiltrative margins [13]. The calcifications in osteoblastoma are often punctate with chondroid-like features (Fig. 4.10). The MRI findings are varied and generally nonspecific with intermediate to low signal on T1-weighted images, heterogeneously hyperintense T2 signal with varying amounts of intermediate and low T2 signal depending on the amount of calcified osteoid matrix (Fig. 4.11). However, the hallmark of these tumors is extensive peritumoral edema, which can make evaluation of margins and tumor extent difficult. Due to the ability of MRI to exaggerate the overall size of the process on fluid-sensitive sequences and the nonspecific MR signal characteristics of the lesion, correlation with CT is imperative to avoid the misdiagnosis of an osteosarcoma.

Fig. 4.10
Lateral radiograph of the upper sacrum (a) and sagittal (b), axial (c), and coronal (d) CT images of a 17-year-old male with an osteoblastoma show a solid mass with internal calcifications involving the posterior elements of S1 and S2 (thin arrows) that is associated with expansion of the bone (thick black arrows) as well as surrounding medullary sclerosis (asterisks)
Fig. 4.11
Coronal T1 (a), T2 (c), and gadolinium-enhanced SPGR (b and d) MR images of the patient in Fig. 4.10 show typical MR imaging features of an osteoblastoma. The mass has intermediate signal intensity on T1-weighted and heterogeneous intermediate and high signal intensity on T2-weighted images and shows avid enhancement with gadolinium (asterisks). Of interest, the mass is associated with extensive surrounding bone marrow edema (thin arrows) with is typical of osteoblastoma
Although 10% of osteoid osteomas occur in the spine, only 2% of spinal osteoid osteomas occur in the sacrum [2, 11, 13]. They most commonly occur in males between 10 and 20 years of age. Osteoid osteomas most commonly arise in the posterior elements of the spine and, when in the sacrum, are most commonly located in the articular process of S1. On radiographs, they may be occult or present as a sclerotic lesion. The lucent nidus is often obscured by the complex anatomy and overlap that occurs with spinal radiographs. CT is the imaging modality of choice when the diagnosis of osteoid osteoma is suspected. On CT, osteoid osteomas usually present as a small radiolucent lesion that by definition is less than 1.5 cm in diameter. They may contain a central focus of calcification and are notorious for inciting exuberant surrounding sclerosis and cortical thickening. On MRI, detection of the nidus is often difficult due to the extensive surrounding increased T2 signal in the bone and soft tissues due to edema and inflammatory change that results in exaggeration of the overall size of the process. When identified, the tumor is typically low to intermediate on T1 and intermediate to high on T2-weighted images. The tiny focus of central calcification demonstrates low signal on all pulse sequences.
4.5.5 Aneurysmal Bone Cyst
Aneurysmal bone cysts (ABCs) are relatively rare benign expansile bone lesions with blood-filled cystic spaces which, until relatively recently, were thought to represent a reactive process. However, a neoplastic origin in primary ABC has been demonstrated with evidence of USP6 gene rearrangement in primary tumors [28]. The majority of ABCs are considered primary lesions with no underlying neoplasm found. When associated with an underlying tumor, as secondary ABC, giant cell tumor of the bone and chondroblastoma are the most common lesions on the differential diagnosis. However, they can be associated with other benign and malignant tumors. Most aneurysmal bone cysts are diagnosed by the age of 20 years with a slightly higher prevalence in females. The spine is involved in 12–30% of cases of ABC. Of spinal cases, 13% occur in the sacrum [5, 13]. Although, usually, the lesion is comprised of blood-filled cystic cavities with thin vascular septations between the cysts, a “solid variant” has been described and is more common in the spine. Spinal ABCs may cross the disk space or SI joint, similar to chordoma and GCT.
Related posts:

Stay updated, free articles. Join our Telegram channel

Full access? Get Clinical Tree


