Fluorodeoxyglucose (FDG) PET/CT is sensitive to metabolic, immune-related, and structural changes that can occur in tumors in cancer immunotherapy. Unique mechanisms of immune checkpoint inhibitors (ICIs) occasionally make response evaluation challenging, because tumors and inflammatory changes are both FDG avid. These response patterns and sequelae of ICI immunotherapy, such as immune-related adverse events, are discussed. Immune-specific PET imaging probes at preclinical stage or in early clinical trials, which may help guide clinical management of cancer patients treated with immunotherapy and likely have applications outside of oncology for other diseases in which the immune system plays a role, are reviewed.
Key points
- •
Immunotherapy causes infiltration of tumors by immune cells and in rare cases is associated with unique response patterns, such as pseudoprogression.
- •
FDG PET/CT is frequently used to assess response to immunotherapy, and, although it cannot distinguish immune-related activity from tumor growth, it has the potential to provide insight into the immune response.
- •
New probes for PET imaging of the immune system are likely to be helpful in predicting response to cancer immunotherapy and separating immune-related changes from progressive disease.
Introduction
To promote their own proliferation and survival, cancer cells are known to escape immune surveillance and suppress the immune response. , Although the processes by which tumors escape immune surveillance are not understood completely, some of these mechanisms have been elucidated. For example, tumors can express T-cell suppressor proteins, either constitutively or in response to the initial immune response in the tumor microenvironment. As a result, drugs that target suppressors of cytotoxic T cells have been seen as attractive tools in immunotherapy.
Exemplary immunotherapeutic agents that have demonstrated survival benefit include immune checkpoint inhibitors (ICIs), such as ipilimumab, pembrolizumab, and nivolumab, which usually are administered every 2 weeks to 3 weeks. Ipilimumab inhibits cytotoxic T-lymphocyte–associated protein 4 (CTLA-4) by preventing CTLA-4 binding to the B7 ligand on antigen-presenting cells or even tumors. Nivolumab and pembrolizumab inhibit the membrane protein programmed cell death receptor (PD-1) on cytotoxic T cells, preventing PD-1 binding to PD ligand 1 (PD-L1) or PD ligand 2 (PD-L2) ( Fig. 1 ). , Similarly, PD-L1 inhibitors, such as atezolizumab, avelumab, and durvalumab, prevent PD-1 binding on cytotoxic T cells. In the absence of therapy, signaling through CTLA-4 or the PD-1 axis leads to suppression of cytotoxic T-cell function and persistence of tumors. Treatment with checkpoint inhibitors blocks these inhibitory signals and leads to activation of the immune response with T-cell activation and expansion.

Immunotherapies have been used to re-engage and augment the immune response against a variety of malignancies, such as melanoma, non–small cell lung cancer, renal cell cancer, urothelial cancer, head and neck squamous cell cancer, Merkel cell carcinoma, and Hodgkin lymphoma, and the role of immunotherapy in the treatment of cancer continues to expand. , Although immunotherapy generally is associated with more frequent durable responses compared with chemotherapy or targeted therapy, more than 50% of patients do not respond. Given nonredundancy in immune checkpoint pathways, combination immunotherapy has been utilized to increase efficacy, although combination therapies also are associated with greater toxicity. ,
Imaging is used routinely for diagnosis, staging, treatment planning and response assessment in oncology. Ultrasound, computed tomography (CT), and MR imaging can identify potential tumor lesions and assess changes in the size and density of lesions after treatment. In addition, functional imaging using PET with 18 F-fluorodeoxyglucose (FDG) is used routinely due to its high sensitivity for detecting malignancy and characterizing tumor metabolism. This article discusses the role of FDG PET/CT in the assessment of treatment response after cancer immunotherapy and identifies a few approaches that utilize FDG PET/CT to evaluate the immune response. New immune-specific PET imaging probes that are just beginning to be explored in early-phase clinical trials also are reviewed.
Atypical response patterns in immunotherapy
The novel mechanism of action of immunotherapies, with immune and T-cell activation, has the potential to lead to unusual patterns of response, such as pseudoprogression or hyperprogression, which are discussed later. These atypical responses are, however, quite rare, and a vast majority of patients treated with current immunotherapy regimens have typical response patterns. In addition, it is important to be aware of potential immune-related adverse events (irAEs), which can result in misleading findings on imaging.
Pseudoprogression
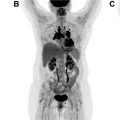
For some patients on immunotherapy, tumors can transiently increase in size, or new lesions may be seen. If follow-up evaluation shows resolution of the new lesions and decreasing size or resolution of the lesions that had previously grown, this is termed, pseudoprogression ( Fig. 2 ), and can be early or delayed. This phenomenon likely occurs as a result of tumor infiltration by immune cells, which has been confirmed by biopsy in a few cases. Many of these transiently increased/new lesions also are avid on FDG PET/CT, and, in some patients, pseudoprogression may be associated with clinical symptoms.

Pseudoprogression has been reported mainly in melanoma patients treated with ipilimumab (occurring in up to 15% of cases), and appears much rarer with the use of anti–PD-1/PD-L1 agents. Billan and colleagues have compiled frequencies of pseudoprogression in pooled studies and clinical trials where anti–PD-1 axis immunotherapy agents were used to treat different cancers, and frequencies ranged from 1.3% to 9.3%. In the largest analysis to date involving 19 clinical trials and 2400 participants, nivolumab and pembrolizumab were investigated in various advanced solid tumors, and pseudoprogression was observed in 6.3% of patients. Thus, morphologic increase in tumor volume or metabolic activity on FDG PET/CT is much more likely to reflect true progressive disease.
Pseudoprogression also has been seen with chimeric antigen receptor (CAR) T-cell therapy when patients are imaged early; a case report of a patient with relapsed B-cell acute lymphoblastic leukemia noted pseudoprogression of extramedullary disease on MR imaging at 16 days post–CAR T-cell treatment, with subsequent response on day 30. In contrast, when patients with lymphoma were imaged at 1 month post–CAR T-cell therapy via FDG PET/CT, no evidence of pseudoprogression was identified even in patients that had cytokine release syndrome, suggesting that pseudoprogression should not be a confounding factor for routine follow-up scans in patients treated with CAR T-cell therapy.
Hyperprogression
Hyperprogression of cancer after the initiation of ICIs is a recently described response pattern in a subset of patients receiving PD-1/PD-L1 axis inhibitors. Hyperprogression is considered a therapy-induced acceleration of tumor growth kinetics (see Fig. 2 ) and has been defined as treatment failure of less than 2 months, or a 2-fold or greater increase in tumor burden/growth rate during immunotherapy. The existence of hyperprogression continues to be controversial, however, given that it is difficult to establish if rapid progression is due to the natural history of the disease or an immunotherapy-induced process. ,
In several reports, prebaseline, baseline, and post-treatment scans were utilized, so that the tumor growth rate during immunotherapy could be compared with the growth rate prior to immunotherapy. Champiat and colleagues used this approach to show that 12/131 (9%) patients who received anti–PD-1/PD-L1 immunotherapy could be classified as hyperprogressors. In another study where prebaseline, baseline, and post-therapy scans were available, 6/155 (4%) of patients experienced hyperprogression. Additional studies are needed, however, to understand the biology driving hyperprogression and provide more evidence for this controversial phenomenon.
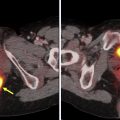
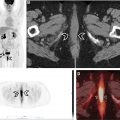
Immune-related Adverse Events
Immunotherapeutic agents can cause off-target side effects known as irAEs, which result from inflammation of various organs/organ systems. irAEs usually occur within 12 weeks of immunotherapy initiation and commonly occur in the skin and gastrointestinal tract ( Fig. 3 ), although the pancreas ( Fig. 4 ), thyroid gland ( Fig. 5 ), pituitary gland, liver, lung ( Fig. 6 ), heart, and joints also may be affected. , Sarcoid-like reactions also can occur as a manifestation of irAE ( Fig. 7 ). Although incidence rates vary by organ system, irAEs may occur in more than 50% of patients and they appear to be more common in patients on anti–CTLA-4 monotherapy and combination immunotherapy. , , Fatality is rare and ranges from 0.3% to 1.3% in patients treated with PD-1/PD-L1 and CTLA-4 inhibitors and is more frequently attributable to colitis-related toxicity in patients treated with ipilimumab, and pneumonitis when patients receive anti–PD-1/PD-L1 therapy.


irAEs can manifest on imaging in a range of organs and organ systems, can precede clinical symptoms, and even may mimic metastatic disease , ; therefore, it is important that radiologists are aware of this entity so that is included in the differential diagnoses for patients on immunotherapy. On FDG PET/CT, irAEs manifest as increased FDG uptake in the involved organs, and subsequent decreased uptake suggests resolution of acute inflammation. irAEs also may predict response to immunotherapy, , although this may be organ/system dependent.
Response evaluation
Response criteria in solid tumors (RECIST) and other metrics are used routinely to assess response to cancer therapy. The observation of pseudoprogression, however, in a subgroup of patients treated primarily with ipilimumab motivated the development of new criteria for response assessment in the setting of cancer immunotherapy, in order to distinguish true progressive disease from pseudoprogression. In a majority of these new immune-related response criteria, such as irRC, iRECIST, and iPERCIST, , , , an increase in size of lesions and/or appearance of new sites of disease on the first follow-up (relative to baseline imaging) reflects unconfirmed progressive disease. If follow-up anatomic imaging and/or FDG PET/CT after greater than or equal to 4 weeks demonstrates no improvement or even worsening of disease, patients are classified as confirmed progressive disease. In the modified Lugano criteria for immunotherapy in lymphoma, biopsy or subsequent imaging can be performed. In addition, some investigators have combined anatomic and molecular imaging criteria to characterize response, whereas others have used thresholds of lesion size and number to determine progressive disease. , Despite this wide variety of new immune-related response criteria, RECIST remains the primary method of response assessment for most clinical trials, including immunotherapy trials, with immune-related response criteria used for exploratory endpoints.
Immune imaging with fdg pet/ct
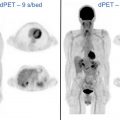
FDG is known to be taken up by activated immune cells. In clinical FDG PET/CT scans, this is reflected in inflammatory conditions, such as infection, rheumatoid arthritis, and sarcoidosis, which demonstrate elevated FDG uptake. Additionally, in vitro studies have demonstrated markedly increased uptake in activated T cells compared with unstimulated T cells. In the routine clinical setting, FDG activity in immune cells cannot be discriminated from FDG activity in tumor cells. If a baseline FDG PET/CT is compared, however, with an early post-treatment FDG PET/CT over a short interval that minimizes changes in the tumor, any increase in FDG uptake should reflect tumor infiltration by activated immune cells. This metabolic “flare” phenomenon has been demonstrated in a preclinical mouse tumor model and reported in a few clinical cases and potentially is an earlier and more sensitive measure of response to cancer immunotherapy. A recent clinical trial demonstrated that a metabolic flare could be detected in 2/16 (13%) patients with melanoma on pembrolizumab as early as 6 days to 7 days post-therapy, with dramatic increases in tumor maximum standardized uptake value that more than doubled and predicted a complete response to therapy; no tumor flare was seen in nonresponders. Future studies need to test this approach in a larger cohort of patients and explore the optimal posttreatment imaging time.
Other approaches to use FDG PET/CT imaging to predict response to immunotherapy also have been explored. For example, 2 studies have reported that an increased ratio of mean standardized uptake value of bone marrow to liver on baseline FDG PET/CT has been associated with decreased survival after anti–PD-1 immunotherapy in the setting of metastatic melanoma. , This bone marrow hypermetabolism in patients with cancer is hypothesized to reflect a systemic inflammatory response, which leads to immunosuppression and is associated with cancer progression. Additional support for this hypothesis is provided by a significant positive correlation between FDG uptake in bone marrow and serum inflammatory markers including the white blood cell count and C-reactive protein.
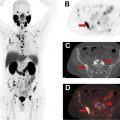
During immunotherapy, activation of the immune system can cause infiltration of lymphoid organs by immune cells. Sarcoid-like reaction, although considered to be an irAE, has been shown to reflect nodal infiltration by immune cells postimmunotherapy, and such nodal infiltration corresponds to associated FDG avidity (see Fig. 7 ). In a recent study, all patients with FDG-avid sarcoid-like reactions following immunotherapy demonstrated positive response. Pseudoprogression also appears to indicate infiltration of tumors by immune cells which are FDG avid. ,
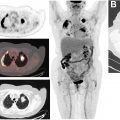
FDG PET/CT also has been used to visualize the immune response following vaccination. Increased FDG uptake has been seen in ipsilateral axillary lymph nodes following the influenza vaccine for up to 2 weeks to 4 weeks, with the highest uptake seen within the first week after the vaccine. , In 1 case report, transiently increased FDG activity also was seen in the spleen at 2 days to 3 days postvaccination, which resolved 12 days later. A similar pattern of increased FDG uptake in the deltoid muscle and ipsilateral axillary lymph nodes has been seen for up to several weeks following COVID-19 vaccination ( Fig. 8 ). These cases underscore the need for an accurate patient history, to ensure that FDG avid reactive axillary lymph nodes are not mistaken for metastatic disease.