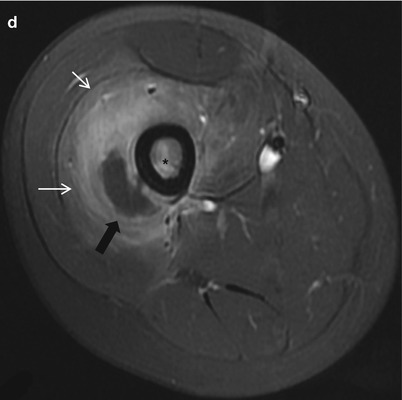
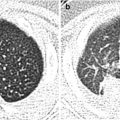
Fig. 31.1
A 10-year-old boy with acute osteomyelitis. (a) Plain radiograph of the right femur demonstrates no bony abnormalities. (b) Bone scan 2 h delayed image demonstrates increased uptake in the proximal diaphysis of the right femur (arrows). (c) Sagittal T2-weighted MR image demonstrates bone marrow edema with poor interface between normal and abnormal marrow as well as soft tissue swelling (arrowheads). (d) Post-contrast axial T1-WI demonstrates contrast enhancement of the bone marrow and soft tissue (small white arrows). Soft tissue abscess with rim enhancement and internal fluid is seen (black arrow)
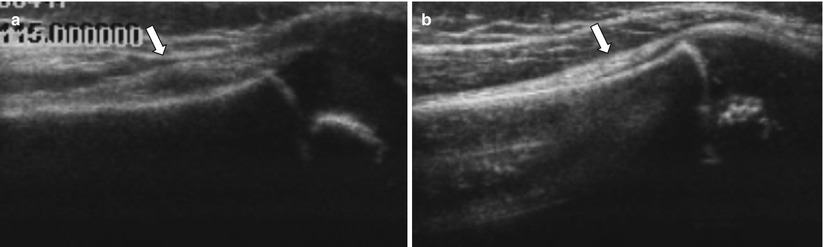
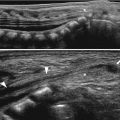
Fig. 31.2
A 5-year-old girl with subperiosteal abscess. (a) Ultrasound exam of the right femur demonstrates periosteal lifting with subperiosteal fluid (arrow). (b) Exam of the contralateral side demonstrates normal appearance of the periosteum (arrow)
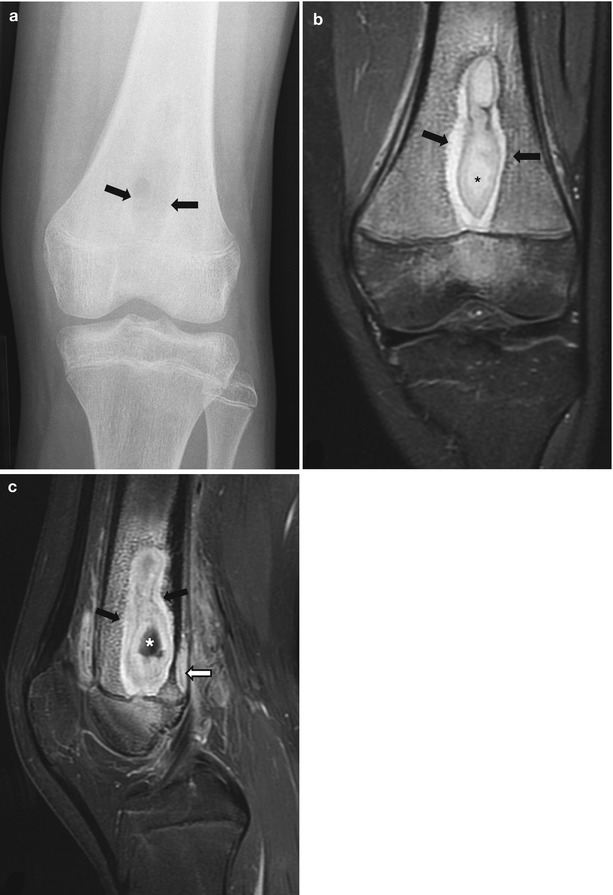
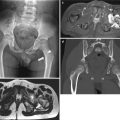
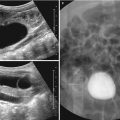
Fig. 31.3
A 12-year-old girl with Brodie’s abscess. (a) Plain radiograph of the left femur demonstrates a single well-circumscribed osteolytic lesion with sclerosis (arrows). (b, c) Coronal T2-WI with fat suppression (b) and post-contrast sagittal T1-WI with fat suppression (c) demonstrate an area of fluid signal with enhancing rim (black arrows). Subperiosteal abscess is seen (white arrow)
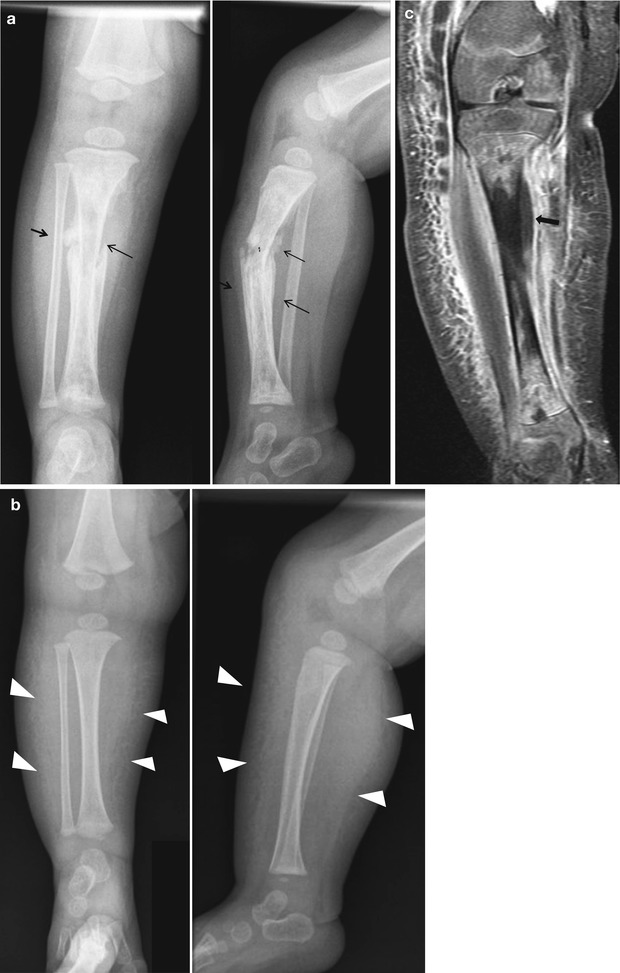
Fig. 31.4
A 3-month-old boy with sclerosing osteomyelitis. subacute-chronic phase: 2 months after disease onset. (a) Plain radiographs of the right tibia-fibula demonstrate cortical thickening, periosteal new bone formation (small black arrows), and intramedullary mixed sclerotic and osteolytic changes. Pathologic fracture is identified. Acute phase: immediately (6 days) after disease onset. (b) Plain radiograph demonstrates soft tissue swelling (arrowheads). (c) Post-contrast T1-WI MR image demonstrates soft tissue swelling, bone marrow enhancement, and subperiosteal abscess formation (arrow)
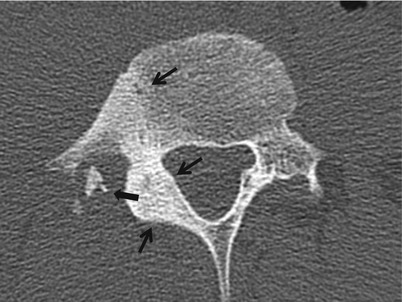
Fig. 31.5
A 16-year-old boy with sequestrum of the lumbar spine. CT scan of the lumbar spine demonstrates sequestrum (arrow) surrounded by soft tissue. Right transverse process and posterior element of the spine show cortical thickening and sclerosis (small black arrows)
31.6.2 Infectious Disorder of the Bone and Joint; Septic Arthritis
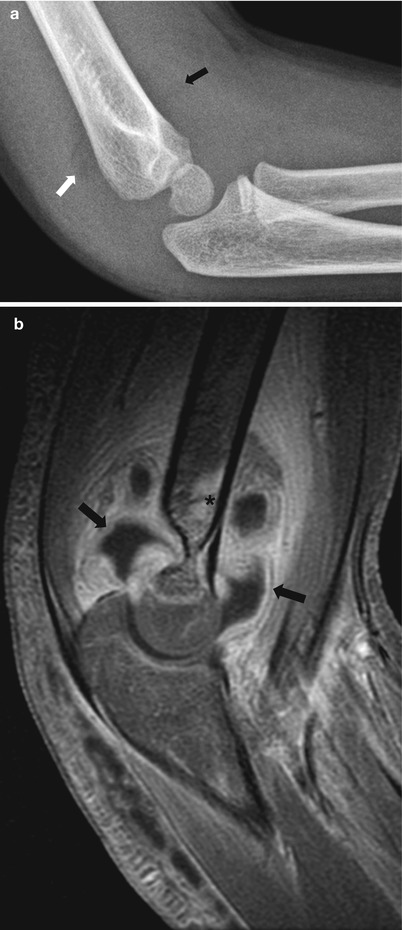
Fig. 31.6
A 3-year-old girl with septic arthritis. (a) Plain radiograph of the elbow demonstrates a large joint effusion with shifting of the anterior (black arrow) and posterior (white arrow) fat pads. (b) Post-contrast sagittal T1-WI with fat suppression demonstrates abundant enhancing synovium (black arrows), soft tissue swelling, and bone marrow edema
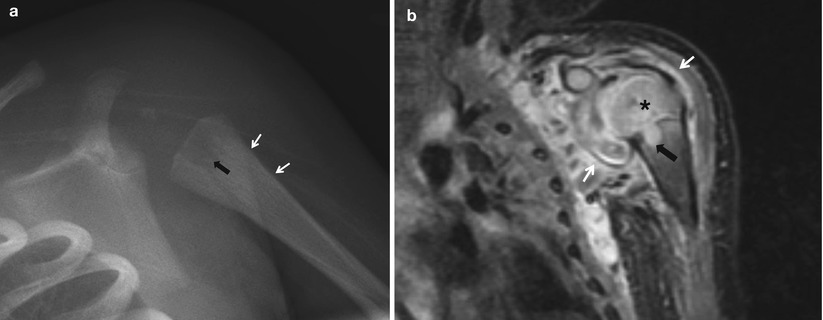
Fig. 31.7
A 3-week-old girl with septic arthritis. (a) Plain radiograph of the left shoulder demonstrates periosteal reaction (small white arrows) and destructive change (black arrow) of the left proximal humerus. (b) Post-contrast coronal T1-WI with fat suppression demonstrates synovial enhancement (small white arrows) and intraosseous abscess formation (black arrow). Bone marrow edema and enhancement of the epiphysis of the humerus suggesting osteomyelitis is seen
31.6.3 Infectious Disorder of the Bone and Joint; Tuberculous Arthritis
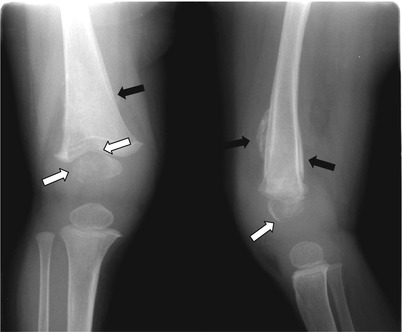
Fig. 31.8
A 2-year-old girl with tuberculosis. Plain radiograph of the right distal femur demonstrates bone destruction (white arrows) and periosteal reaction (black arrows) (Courtesy of JE Cheon M.D., Seoul, Korea)
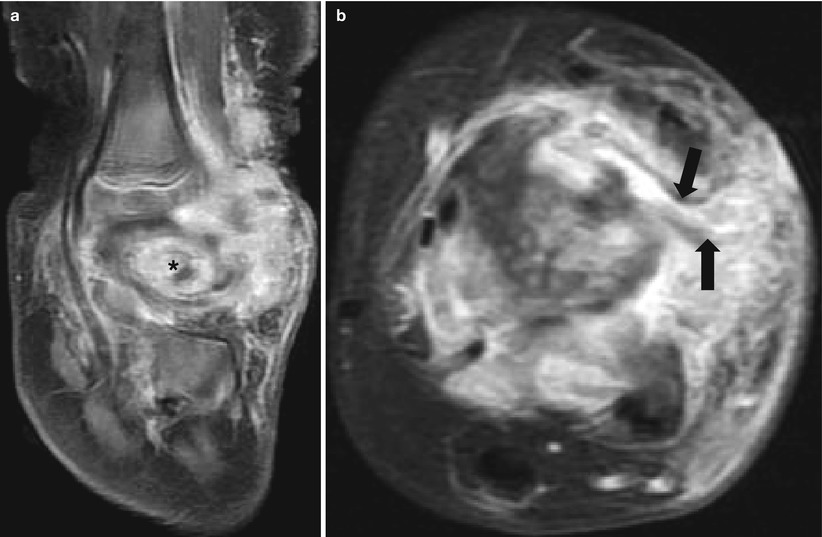
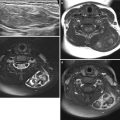
Fig. 31.9
A 2-year-old girl with tuberculosis arthritis of the ankle. (a) Post-contrast sagittal T1-WI with fat suppression demonstrates intraosseous abscess formation and bone erosion and synovitis. (b) Post-contrast axial T1-WI with fat suppression demonstrates dermal sinus track with tram track appearance (arrows) (Courtesy of JE Cheon M.D., Seoul, Korea)
31.6.4 Infectious Disorder of the Bone and Joint; Congenital Syphilis
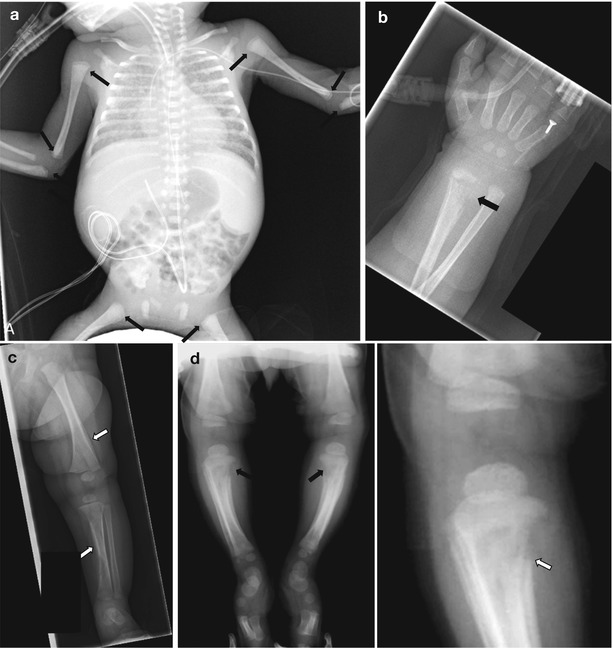
Fig. 31.10
Congenital syphilis. (a) Infantogram of a newborn baby demonstrates multifocal metaphyseal lucent bands (arrows). (b, c) A 2-month-old boy with congenital syphilis. Radiographs of the wrist (b) and lower leg (c) demonstrate metaphyseal lucencies (black arrow) and multiple areas of periosteal new bone formation (white arrows). (d) Another 2-month-old boy with congenital syphilis. Lower extremity and cone-down view of the right knee show Wimberger’s sign bilaterally (black arrows). Characteristic Laval-Jeantet collar, representing spared newly formed metaphysis, is seen (white arrow)
31.6.5 Infectious Disorders of the Soft Tissue; Pyomyositis
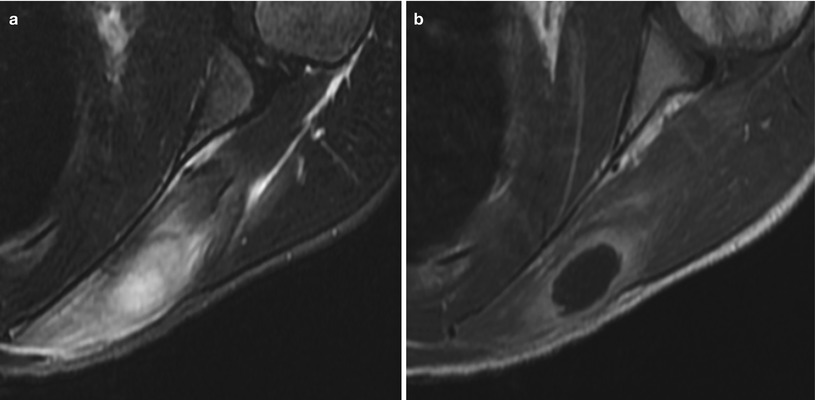
Fig. 31.11
A 11-year-old boy with pyomyositis of the shoulder. (a) Axial T2-WI with fat suppression and (b) Post-contrast axial T1-WI with fat suppression demonstrate well-circumscribed fluid collection with rim enhancement
31.6.6 Noninfectious Inflammatory Diseases of the Bones and Joints; Juvenile Idiopathic Arthritis
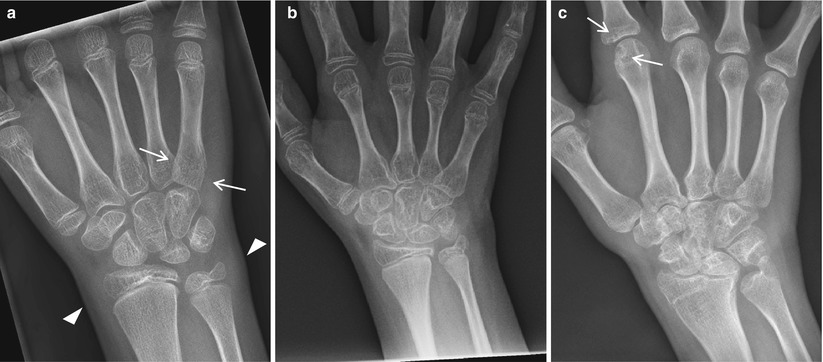
Fig. 31.12
Juvenile idiopathic arthritis in different stages in different patients. (a) A 9-year-old girl with JIA. Wrist radiograph demonstrates periarticular osteopenia (white arrows) and soft tissue swelling (arrow heads). (b) An 11-year-old girl with JIA. Wrist radiograph demonstrates squaring of carpal bones with intercarpal joint space narrowing. (c) A 15-year-old girl with JIA. Wrist radiograph demonstrates loss of joint space in the intercarpal joints due to destruction of the cartilage, proximal migration of the scaphoid and lunate bones, and erosions (white arrows)
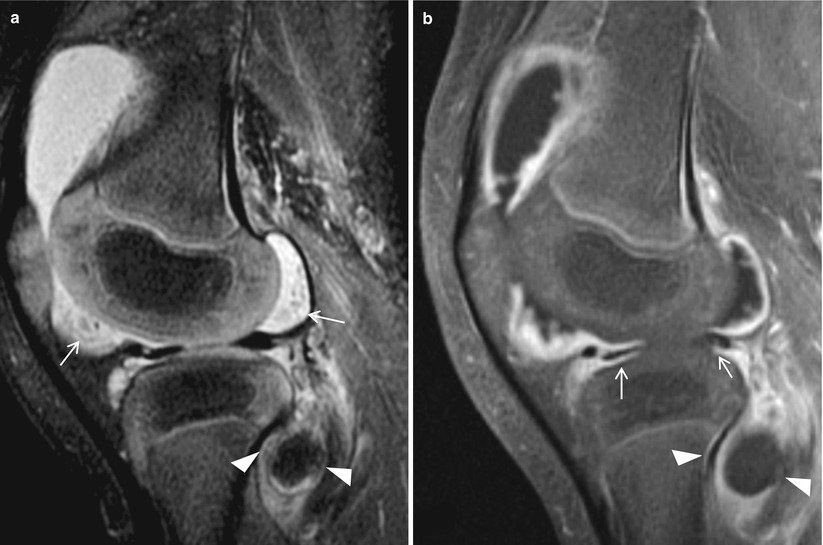
Fig. 31.13
A 3-year-old girl with JIA. (a) Sagittal T2-WI with fat suppression demonstrates a large joint effusion with high T2 signal synovium, which was not differentiated from adjacent fluid. Hypointense rice bodies (arrows) and popliteal cyst (arrowheads) are seen. (b) Post-contrast sagittal T1-WI with fat suppression image demonstrates diffuse synovial enhancement and popliteal cyst (arrowheads). Anterior and posterior horn of the meniscus is hypoplastic (arrows)
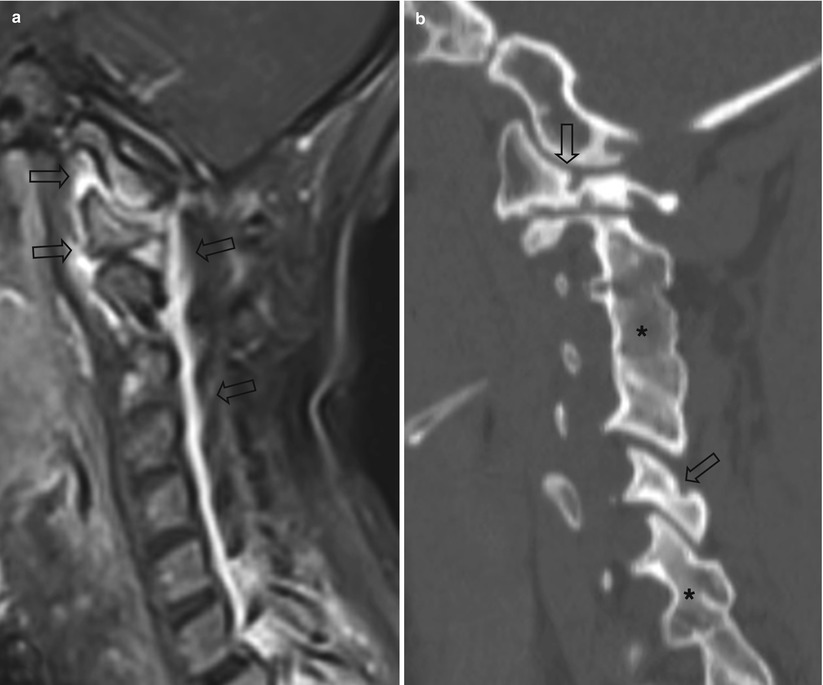
Fig. 31.14
JIA of the cervical spine. (a) A 15-year-old girl with JIA. Post-contrast sagittal T1-WI with fat suppression of the cervical spine demonstrates synovial enhancement and soft tissue swelling (arrows). (b) A 16-year-old girl with JIA. Cervical spine CT scan demonstrates bone erosion (arrows) and multilevel fusion of the posterior elements (Courtesy of AC Merrow, M.D., Cincinnati, Ohio, USA)
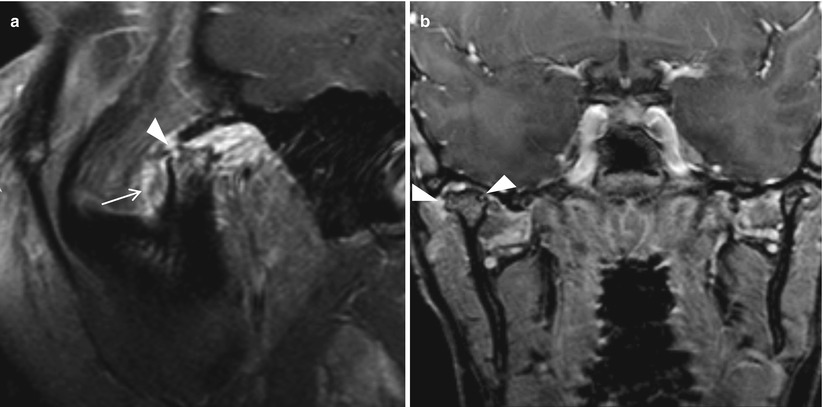
Fig. 31.15
A 17-year-old girl with JIA of the temporomandibular joint. (a) Post-contrast sagittal T1-WI with fat suppression with the patient open mouth demonstrates dislocation of the mandibular condyle, synovial enhancement (arrow), and flattening and shortening of the mandibular condyle with erosion (arrowhead). (b) Coronal post-contrast T1-WI with fat suppression with the patient closed mouth demonstrates both mandibular condyles are within the joints. Hypertrophy of the right mandibular condyle with flattening and erosion (arrowhead) is seen
31.6.7 Noninfectious Inflammatory Diseases of the Bones and Joints; Juvenile Spondyloarthropathies
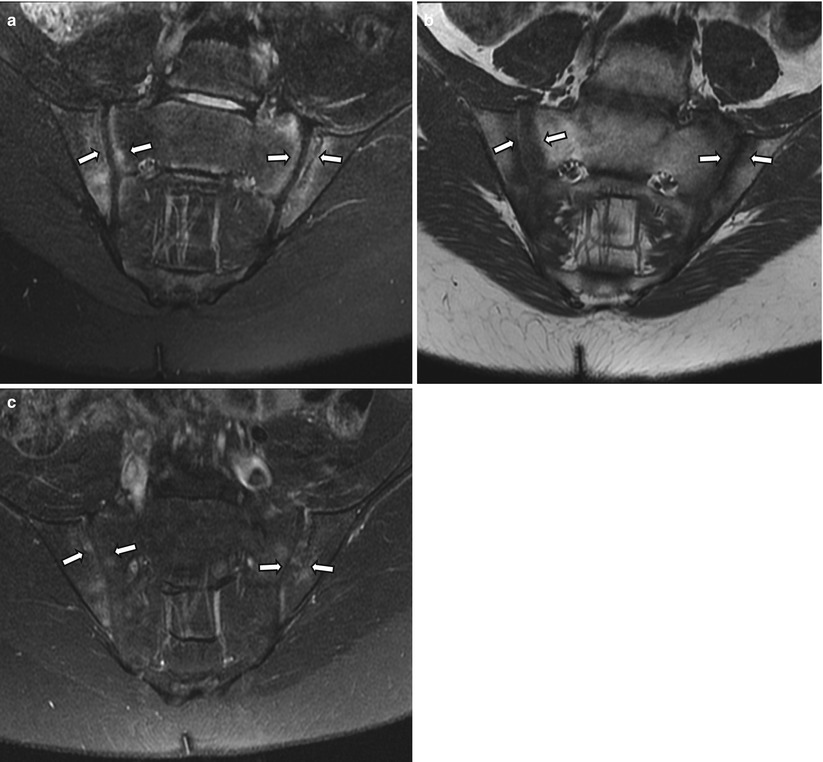
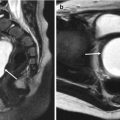
Fig. 31.16


A 14-year-old HLA B27-positive boy with ankylosing spondylitis. Oblique coronal T2-WI with fat suppression (a), T1-WI (b), and post-contrast T1-WI with fat suppression (c) demonstrate bilateral bone marrow edema (arrows) within the sacroiliac joint
Related posts:
Stay updated, free articles. Join our Telegram channel
Full access? Get Clinical Tree
