Abstract
The spinal cord is commonly affected in inflammatory demyelinating diseases (IDD) of the central nervous system. In the most common IDD, multiple sclerosis (MS), the importance of spinal cord involvement is highlighted by the inclusion of characteristic cord lesions in its current diagnostic criteria. In neuromyelitis optica, longitudinally extensive spinal cord lesions over three or more segments are considered almost pathognomonic for the disease. In general, spinal cord lesion load shows a strong correlation with disability, and spinal cord-derived magnetic resonance imaging (MRI) measures are some of the strongest biomarkers of a disabling disease course. In progressive forms of MS, the clinical phenotype is consistent with a progressive myelopathy in most cases. These forms of MS, especially primary progressive MS, represent a major challenge for disease activity monitoring. Novel quantitative MRI metrics characterizing spinal cord involvement in MS are expected to find their way into routine clinical monitoring as they provide unique insight into tissue abnormalities, allowing for monitoring of disease progression and assessment of response to treatment. These techniques include magnetization transfer MRI, diffusion-weighted imaging, atrophy measurement techniques, T1 and T2 relaxometry, and magnetic resonance spectroscopy.
Keywords
Inflammatory myelopathy, Multiple sclerosis, Neuromyelitis optica, Paraneoplastic myelopathy, Transverse myelitis
1.2.1
Introduction
The spinal cord is a common site of involvement in inflammatory demyelinating diseases of the central nervous system (CNS). The most common such disease, multiple sclerosis, is the leading cause of nontraumatic disability in young adults, with an enormous socioeconomic impact. Neuromyelitis optica (NMO), an increasingly recognized and recently redefined condition, also has prominent and very characteristic spinal cord involvement, which is typically much more severe than MS-related transverse myelitis. The critical importance of spinal cord imaging in these conditions is also highlighted by the inclusion of spinal cord magnetic resonance imaging (MRI)-derived metrics in the internationally utilized diagnostic criteria of MS and NMO. However, with the constant evolution of the MS diagnostic criteria, new discoveries pertaining to the pathogenesis and biomarkers of NMO, and the evolving definitions of transverse myelitis, acute disseminated encephalomyelitis (ADEM), pediatric MS, and systemic autoimmune disease-associated and paraneoplastic myelopathies, one might feel overwhelmed when attempting to classify, characterize, diagnose, and manage these conditions. Neuroimaging, specifically MRI, plays a key role in the correct diagnosis of these conditions, and it provides a critically important aid for treatment monitoring. With the advent of advanced MRI techniques enabling quantitative analysis methods, MRI provides a reliable tool in monitoring and characterizing disease progression, and it also enables a unique insight into the generally poorly understood pathogenesis of these disorders.
In this chapter, we will discuss the currently available and constantly evolving MRI-based quantitative tools. These will be discussed in the context of the most common forms of acute and subacute inflammatory myelopathies, including MS-related transverse myelitis, longitudinally extensive transverse myelitis (LETM) related to NMO and NMO spectrum disorder, and idiopathic inflammatory transverse myelitis in the context of MS and as a stand-alone condition. The vast majority of the published quantitative MRI literature clearly has focused on MS, with a smaller but growing proportion of studies related to NMO; for that reason, these two diseases are the main focus when we discuss quantitative methods. Finally, we will outline future perspectives and challenges in the evolving field of quantitative MRI in inflammatory myelopathies.
1.2.2
Classification of Inflammatory Myelopathies
While there is currently no single universally accepted and utilized classification of inflammatory myelopathies, one can consider several features of these conditions to establish clinically useful classifications. One such feature is the lesion location or “lesion type” ( Table 1.2.1 ). In addition, an important classification strategy also followed in the recently published American Academy of Neurology guidelines is whether the TM episode is complete or partial, which is an especially helpful distinguishing feature at first presentation with transverse myelitis.
- •
Multiple sclerosis (MS): Patch-like lesions abutting the surface of the cord; in contact with cerebral spinal fluid (CSF); up to one-half of the axial crosscut surface is involved, but more commonly one-fourth to one-third
- •
Neuromyelitis optica (NMO): Longitudinally extensive transverse myelitis—three or more segments long, “center of the cord” appearance on axial cuts, often involves more than 50% on axial cuts
- •
Idiopathic transverse myelitis (TM): May be similar to MS or NMO-like lesions, without meeting the criteria for either; can be a clinically isolated syndrome (CIS) leading to MS, the first manifestation of NMO, or a stand-alone disease
- •
Paraneoplastic myelopathies: Most commonly present as tractopathy
| Type of Lesion | Tracts Involved | Clinical Signs | Examples |
|---|---|---|---|
| Complete | All tracts | Pyramidal, sensory, and autonomic dysfunction below lesion | Trauma or acute necrotizing viral myelitis |
| Bown–Séquard hemicord syndrome | Ipsilateral corticospinal, posterior columns; contralateral spinothalamic | Ipsilateral pyramidal weakness and loss of posterior column function; contralateral spinothalamic loss | Multiple sclerosis, compression |
| Anterior cord syndrome | Bilateral anterior horn cells corticospinal tracts, spinothalamic and autonomic | Acute bilateral flaccid weakness, loss of pain temperature, and sphincter and autonomic dysfunction; preservation of dorsal column modalities such as joint position sense | Anterior spinal artery occlusion |
| Posterior cord | Bilateral posterior columns | Bilateral loss of light touch, vibration, and joint position | Vitamin B 12 or copper deficiency (usually chronic) |
| Central | Crossing spinothalamic, corticospinal, and autonomic fibers | Dissociated sensory loss (loss of pain and temperature with preserved vibration and joint position); pyramidal distribution weakness below lesion; autonomic dysfunction below the lesion | Syrinx, neuromyelitis optica |
| Conus medullaris | Autonomic outflow and sacral spinal cord segments | Early sphincter dysfunction, sacral sensory loss, and relatively mild motor dysfunction | Postviral myelitis |
| Cauda equina | Spinal nerve roots of the cauda equina | Early, often asymmetric flaccid weakness of the lower limbs; sensory loss in root distribution followed by autonomic dysfunction | Acute cytomegalovirus polyradiculitis, compression |
| Tractopathies | Selective tract involvement | Selective pyramidal, posterior column involvement | Paraneoplastic myelopathy, copper deficiency, vitamin B 12 deficiency |
1.2.3
Transverse Myelitis: A Practical Definition Based on MRI
Transverse myelitis is a collective term for segmental inflammatory disorders of the spinal cord. While TM can be seen in the context of infections, which are typically easily recognized given the associated systemic features and/or CSF findings, most cases represent idiopathic inflammatory diseases, including MS, NMO, and less commonly ADEM, paraneoplastic disorders, or sarcoidosis. Metabolic diseases such as vitamin B 12 or copper deficiency also may look like TM on conventional MRI, but even with conventional imaging usually there are clear clues regarding their noninflammatory nature.
The most important classifying feature of idiopathic TM is based on its MRI appearance on axial and sagittal scans: lesions that encompass one-fourth to one-third of the cord crosscut surface area, typically abut the CSF, have a wedge-like appearance, and on sagittal images rarely extend beyond one or two segments are typical MS lesions. By contrast, lesions that are mostly gray matter centered, encompass one-half or more of the crosscut surface area, are longitudinally extensive usually beyond three segments, and during their acute stage are associated with mass effect are typical NMO lesions. TM lesions with NMO-like characteristics are often labeled as LETM.
1.2.4
The Significance of TM and Its Relationship to MS and NMO
It is important to note that a single idiopathic TM event should be considered a CIS that may evolve into MS or NMO later, or may be a stand-alone disease without conversion to a more disseminated demyelinating disease. From the standpoint of a classic MS-like TM evolving into clinically definite MS (CDMS, defined as MS with more than one clinical event clearly related to demyelinating disease), the most important clue is whether upon presentation more than just the symptomatic cord lesion is visualized. If additional MS-like lesions are seen in either the brain or spinal cord, and especially if these lesions meet the Barkhof–Tintore “dissemination in space” criteria ( Table 1.2.2 ), then the patient would fall into the “high conversion risk group,” which has a >80% risk of developing CDMS over the next 20 years, with a hazard ratio of over 6.4 and most of them converting early on. If, in addition to nonsymptomatic MS-like lesions, the CSF is also positive for common markers of MS (immunoglobulin G (IgG) index elevation and oligoclonal bands positivity), the conversion risk is even higher, and conversion occurs earlier, typically within the first couple of years.
| DIS Can Be Demonstrated by ≥1 T2 Lesion 1 in At Least 2 of 4 Areas of the CNS |
|---|
| Periventricular |
| Juxtacortical |
| Infratentorial |
| Spinal cord 2 |
1 Gadolinium enhancement of lesions is not required for DIS.
2 If a subject has a brainstem or spinal cord syndrome, the symptomatic lesions are excluded from the criteria and do not contribute to lesion count.
In 2010, a new set of criteria was proposed for MS, which represents the second modification of the original McDonald MS criteria from 2001. Of note, the 2001 McDonald criteria were the first to incorporate MRI characteristics in the diagnosis of MS. The new 2010 criteria further refine the MRI-based dissemination in space and dissemination in time (DIT) criteria, with special emphasis placed on spinal cord lesions in the dissemination in space criteria ( Table 1.2.2 ) and in the criteria of primary progressive MS (PPMS). The presence of spinal cord lesions in general increases the diagnostic certainty in MS, as many of the “MS mimics” do not lead to cord lesion formation. In PPMS, and in progressive forms of MS in general, the main symptom is that of a slowly progressive myelopathy, which is reflected by the extensive use of cord-derived MRI parameters in the new diagnostic criteria. Advanced MRI methods are becoming especially important in progressive forms of MS, especially in PPMS: in this MS subtype, the most typical clinical presentation is that of a slowly progressive myelopathy, with only minimal if any accompanying MRI activity on conventional MRI despite the ongoing progression. This MS subtype also represents the most universally disabling form of MS (apart from the very rarely seen cases of fulminant MS such as the Marburg variant), and typically PPMS is also the least likely to respond to currently available treatments. Advanced quantitative MRI will likely play a very important role in monitoring PPMS, especially in upcoming tissue restorative treatment trials, and will likely also shed light on the pathogenesis of this very poorly understood entity.
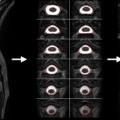
The new DIT criteria ( Table 1.2.3 ) do not have a cord-specific component but enable one single scan at one time point to fulfill DIT: if a scan has both enhancing (“new”) and nonenhancing (“old”) lesions in the typical configuration for MS, DIT criteria are met. While the new DIT criteria certainly will lead to earlier diagnosis and as such may have important treatment ramifications, one must be very cautious with this new development: if more than one pathology is present, such as a one-time demyelinating event intermixed with another pathology that may lead to the presence of enhancing lesions, such as dural AV fistulas in the spinal cord or venous angiomas in the brain, one may encounter cases that do meet DIT criteria but for reasons unrelated to MS. In effect, it can be stated that, as a result of the newly introduced changes, the specificity of the new criteria is lower, while the sensitivity to classify as MS is higher ( Figure 1.2.1 ).
| PPMS May Be Diagnosed in Subjects with |
|---|
|
1 If a subject has a brainstem or spinal cord syndrome, all symptomatic lesions are excluded from the criteria.
1.2.5
Neuromyelitis Optica: The First Demyelinating Disease with a known Serum Marker
Although NMO was considered for decades an “MS variety” and a “severe form of MS,” recent research has completely redefined this inflammatory demyelinating disease and concluded that it has different epidemiology, pathology, CSF findings, radiological features, and response to therapy than classic MS. Dr Vanda Lennon and her colleagues at Mayo Clinic identified a serum marker for this disease: NMO-IgG, an antibody against aquaporin-4 water channels in astrocytic endfeet. NMO-IgG is seen in up to 80% of NMO cases, and when seen, it is virtually pathognomonic to NMO (specificity close to 100%) ( Table 1.2.4 ). It is likely that NMO-IgG is actually pathogenic in the right environment, and not just a biomarker. The fact that NMO’s marker antibody has nothing to do with myelin or oligodendrocytes, but is for a water channel on astrocytes, is both surprising and very significant from the standpoint of new directions in demyelinating disease research. NMO is now considered a disease that primarily targets astrocytes. The only remaining link between MS and NMO is the presence of demyelination in both entities; however, in NMO, demyelination is just a small part of the extensive pathology, and it isn’t even present in every lesion type that NMO can be associated with. Active inflammatory NMO lesions are associated with more extensive tissue damage than MS lesions. NMO pathology also includes uncharacteristic elements for MS, such as eosinophilic infiltration, loss of aquaporin-4 staining in lesions vs. the upregulation of aquaporin-4 immunoreactivity in MS, and nonlesional pathology in normally aquaporin-4-rich areas characterized by aquaporin-4 loss without severe inflammation.
| Mayo Clinic Diagnostic Criteria for Neuromyelitis Optica (NMO) |
|---|
| Definite NMO |
| Optic neuritis |
| Acute myelitis |
At least two of three supportive criteria
|
From the spine-imaging standpoint, NMO cases are characterized by LETM. It is important to note that a myelitis event associated with LETM does not equal NMO: by definition, NMO must include optic neuritis as well as transverse myelitis ( Table 1.2.3 ). In addition, LETM may be associated with other conditions, such as ADEM or pediatric MS. However, first presentation with LETM may imply that the patient is at risk for the development of the full clinical phenotype of NMO and/or for recurrent myelitis events. This situation, especially when associated with NMO-IgG positivity, is often labeled NMO spectrum disorder (NMO-SD). LETM in NMO-SD can be relapsing; this is similar to the situation of relapsing optic neuritis with NMO-IgG positivity, which is the “other extreme” of NMO-SD.
The positivity of autoantibodies related to other autoimmune diseases such as Sjögren’s syndrome, rheumatoid arthritis, systemic lupus erythematosus, and others is very common in NMO and rather uncommon in MS. Cases that were previously considered “Sjögren’s myelitis” or “lupus myelitis” may also represent NMO-SD, which is an active area of clinical investigations.
It is critically important to differentiate NMO from MS, as NMO not only responds poorly to standard MS disease-modifying agents (including a poor response or even no response to otherwise very effective agents in MS treatment, such as natalizumab) but also may actually worsen from interferon therapy. However, NMO shows a reasonable response to immunosuppressive medications, and to agents that selectively suppress or modify B-cell function and/or antibody production.
From the standpoint of advanced imaging methods, it is very important to note that unlike in MS, normal-appearing white and gray matter (NAWM and NAGM) abnormalities are much more restricted or nonexistent in NMO, and they appear to involve only areas “directly hit” by active disease, such as the corticospinal tract as well as the optic radiation.
Paraneoplastic myelopathies , another form of inflammatory myelopathies, are increasingly recognized. A characteristic finding is the appearance of tractopathy —symmetric T2 hyperintensity along both sides of the cord, usually over several segments, following the distribution of specific tracts. This finding commonly demonstrates faint gadolinium enhancement as well. Specific paraneoplastic antibodies may be associated with a variety of clinical presentations, and the antibodies typically predict the underlying cancer type and not the associated neurological syndrome. Therefore, in our view, testing just one or two antibodies while thinking that others are unlikely to be associated with the given neurological condition is an outdated approach; instead, a full panel of paraneoplastic antibodies should be tested. CRMP-5, amphiphysin IgG, GAD-65, VGKC, P/Q or N -type calcium channel, PCA-2, ANNA-2, and neuronal acetylcholine receptor antibodies have all been detected in myelopathy cases. CRMP-5 is in the differential diagnosis of NMO as both myelopathy and optic neuropathy can be observed in the presence of this antibody; this antibody is most commonly associated with small-cell lung cancer.
1.2.6
MRI of the Spinal Cord: Qualitative versus Quantitative Imaging
Although all of the diagnostic features of the various inflammatory myelopathies discussed here are based on qualitative imaging characteristics , advanced MRI methods allow for quantitative MR analysis as well. Quantitative MRI in general is mostly utilized in clinical and basic research; however, as alluded to in this chapter, quantitative MRI metrics of the spinal cord may be especially helpful in monitoring progressive MS cases, where classic MRI measures show poor correlation with the clinical status. Quantitative MRI metrics also play an important role as outcome measures in clinical trials, although the significance of these has recently been questioned.
Even from the standpoint of the acquisition of “classic” qualitative spinal cord images, more recent advances in MRI methodology have resulted in increased sensitivity for lesion detection. Magnetization transfer gradient echo (MT-GE) images and fast-STIR (short tau inversion recovery) sequences were found to depict more cervical cord MS lesions than the classic fast spin echo (FSE) sequence, with fast-STIR having the best sensitivity.
- •
T 1 -weighted sagittal FSE or turbo spin echo
- •
T 2 -weighted sagittal FSE or turbo spin echo
- •
STIR sagittal
- •
Postgadolinium T1-weighted sagittal FSE or turbo spin echo
1.2.7
Magnetization Transfer MRI Studies of the Spinal Cord
Magnetization transfer (MT) imaging (see chapter 3.4 ) provides a quantifiable parameter that can be applied with high resolution even to delicate structures, such as the spinal cord and the optic nerve. Both two-dimensional (2D) and three-dimensional (3D) acquisition methods are available. The generation of MT ratio maps is computationally very straightforward and does not require complex postprocessing methods; image acquisition is also easily available on virtually every clinical system. The MT ratio provides an excellent measure for overall tissue integrity from the standpoint of the macromolecular environment. MT imaging has been successfully applied to patients with MS, showing lesion heterogeneity, subtle changes in the NAWM, and a better correlation with disability in comparison to conventional T2-weighted images. The MT ratio was reduced in the cervical cord, compared with healthy controls. Clinical disability may correlate with MTR independent of cord atrophy, which may in turn relate to preliminary findings of a correlation between axonal loss and MTR in the spinal cord.
MT is especially powerful in assessing NAWM and NAGM. In a study of 8 NMO and 10 MS patients compared to nine healthy volunteers, no significant difference was found for any of the normal-appearing MTR histogram metrics between NMO patients and controls, while MS patients had a significantly lower histogram average MTR and peak height, suggestive of lack of pathology in the normal-appearing cord and brain areas in NMO. The cervical cord MTR histogram metrics, including lesional areas between NMO and MS patients, were otherwise not statistically different.
A larger study of 90 MS patients and 20 matched healthy controls compared MTR histograms obtained using axial, contiguous, 5 mm thick slices and sagittal 3 mm slices. On the axial slices, MS patients had significantly lower average cervical cord MTR and peak height compared to controls. When comparing MTR histograms using sagittal slices, MS patients also had significantly lower average cervical cord MTR and peak location (but not height) than did control subjects. Patients with motor symptoms had significantly lower average cord MTR and peak location than those without.
The different MS subtypes may demonstrate slightly but significantly different MT-MRI characteristics. In a study comparing 52 relapsing-remitting MS (RRMS), 33 secondary progressive MS (SPMS), and 11 PPMS cases vs. 21 controls, patients with SPMS had more cervical cord lesions and more images with visible cervical cord damage than did patients with RRMS or PPMS ( p = 0.04). MS patients as a group had significantly lower average MTR of the cervical cord ( p = 0.006) than control subjects. Compared to controls, patients with RRMS had similar MTR histogram-derived measures, whereas those with PPMS had lower average MTR ( p = 0.01) and peak height ( p = 0.02). Patients with SPMS had lower histogram peak height than did those with RRMS ( p = 0.03). The peak position and height of the cervical cord MTR histogram were independent predictors of motor disability. Interestingly, brain T2 lesion load did not correlate with any of the cervical cord MTR histogram metrics. This study overall demonstrated that progressive forms of MS are in general associated with more severe MT-MRI detectable tissue damage in the cord than RRMS, consistent with the clinical fact that most forms of progressive MS present with an insidiously progressive myelopathy.
The correlation between MTR and cord atrophy remains controversial, with some studies demonstrating correlation, while others do not. In a study of 65 MS cases (14 RRMS, 34 SPMS, and 17 PPMS) and nine healthy volunteers, MTR decrease was again demonstrated in MS patients, with weak but significant correlation with EDSS, the most commonly used functional outcome measure in MS-related clinical trials ( r = −0.25, p < 0.05). Correlation between EDSS and spinal cord surface area (its cross-sectional area, or CSA) was better (SRCC = −0.40, p < 0.01). Interestingly, CSA, a commonly used numerical measure of cord atrophy, did not correlate with MTR ( r = 0.1, p = 0.4), but combining MTR with CSA improved correlation with EDSS ( r = −0.46, p < 0.001), suggesting an independent correlation between disability and these MR-derived parameters. EDSS was higher (suggesting increased disability) in patients with diffuse spinal cord abnormality regardless of focal lesions compared to patients without such abnormalities, and CSA was also lower in patients with diffuse cord abnormality. MTR was also slightly but significantly lower in patients with diffuse cord abnormalities. This study not only highlights the fact that both MTR and CSA may independently capture different but synergistic substrates of disability measures, but also demonstrates that nonlesional cord abnormalities can be critically important determinants of overall disability, independent of and unrelated to lesion load. This diffuse pathology, external to classic focal lesions, is largely undetectable on conventional MRI and is an especially important determinant in PPMS and SPMS patients. Quantitative MT-MRI detectable spinal cord damage appears to correlate very well with disability measures in these patients.
MT-derived measures have also been applied to CIS presenting as transverse myelitis. In a study of 45 such cases, the mean values of MTR histogram-derived metrics were not different between CIS patients and healthy controls subjects. Only three patients showed significantly lower cord MTR values than control subjects. These findings either suggest a sensitivity issue for detection of changes at the CIS stage with MT-MRI, or the absence of demyelination in the cervical cord soon after the onset of MS-like CIS, even in patients with subsequent evolution to MS.
Longitudinal follow-up studies have also been performed to validate the clinical utility of MT imaging derived measures. In 14 untreated patients with RRMS over 18 months, the average cervical cord MTR was correlated with relapse rate ( r = −0.56, P = 0.037). A moderate correlation ( r values ranging from −0.33 to −0.36) between baseline cervical cord MTR metrics and EDSS changes over 18 months was also noted, but this wasn’t significant ( p = 0.26 and 0.21, respectively), perhaps due to the relatively small sample size. It is intriguing, though, that a “snapshot” quantitative MT imaging assessment of the cervical cord may be indicative of short-term disease evolution in RRMS.
One of the largest scale MT imaging-based studies in PPMS to date utilized MRI data from multiple centers, including 226 cases and 84 controls. This study confirmed the role and significance of MT imaging in assessing cord pathology in MS. In addition to providing disease-related data, another goal of this project was to compare and standardize data derived from different scanners at various centers. Mean CSA and MTR-derived metrics showed significant intercenter heterogeneity. After correcting for the center, pooled average MTR and histogram peak height values were significantly different between PPMS patients and controls in all tissue classes, including the spinal cord. More severe cord atrophy and MT-MRI detectable NAGM damage were demonstrated in patients requiring walking aids. PPMS severity therefore can be sensitively assessed by MT imaging, and atrophy-related measures may further aid in the assessment of spinal cord damage in these cases.
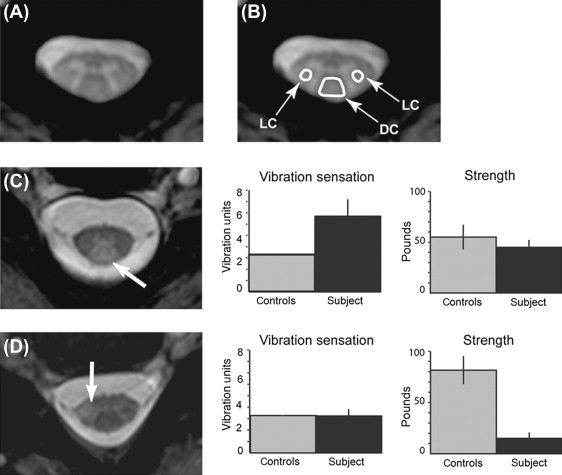
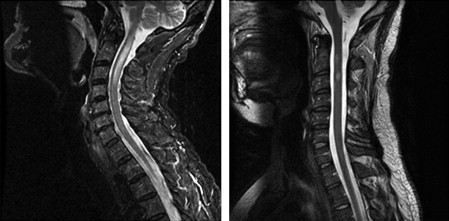
In a study utilizing a novel MT-weighted imaging approach, the authors measured CSF-normalized MT signals in the dorsal and lateral columns and gray matter of the cervical cord in 42 MS cases. They also acquired other measures, including brain lesion volume, cervical spinal cord lesion number and cross-sectional area, vibration sensation, strength, walking velocity, and standing balance. They found that dorsal column CSF-normalized MT signal specifically correlated with vibration sensation ( R = 0.58, P < 0.001), and the lateral column signal with strength ( R = −0.45, P = 0.003), in full correlation with the functional anatomy of these cord regions. A stepwise multiple regression analysis revealed that dorsal column signal and diagnosis subtype alone explained a significant portion of variance in sensation ( R 2 = 0.54, P < 0.001), whereas lateral column signal and diagnosis subtype explained a significant portion of variance in strength ( R 2 = 0.30, P < 0.001). This study demonstrates that functionally compartmentalized MT-MRI data are very helpful in the analysis of specific types of disability in MS, and it suggests that quantitative assessment of selected forms of disability with MRI is feasible ( Figure 1.2.2 ).