Hybrid PET/MR imaging is in early development for treatment planning. This article briefly reviews research and clinical applications of PET/MR imaging in radiation oncology. With improvements in workflow, more specific tracers, and fast and robust acquisition protocols, PET/MR imaging will play an increasingly important role in better target delineation for treatment planning and have clear advantages in the evaluation of tumor response and in a better understanding of tumor heterogeneity. With advances in treatment delivery and the potential of integrating PET/MR imaging with research on radiomics for radiation oncology, quantitative and physiologic information could lead to more precise and personalized RT.
Key points
- •
Hybrid PET/MR imaging is still in early development for treatment planning.
- •
The high initial investment and maintenance costs raise questions of whether PET/MR imaging for radiation therapy treatment planning is superior to that of PET/computed tomography.
- •
There are ongoing improvements in PET/MR imaging workflow, more specific PET tracers, and fast and robust MR imaging acquisition protocols.
- •
PET/MR imaging will play an increasingly important role in better target delineation for treatment planning.
- •
PET/MR imaging will have clear advantages in early evaluation of tumor response and in better understanding of tumor heterogeneity.
Introduction
Radiation therapy (RT) is an important part of the standard of care for most solid tumor types. The principle of modern RT is to deliver a tumor-killing level radiation dose precisely and accurately to the targeted volume, normally solid tumors as well as surrounding regions with high-risk of microscopic invasions, while minimizing dose to critical normal tissue structures nearby. This delivery can be achieved using high energy photon, electron, or heavily charged particle beams. Following radiobiology principles, the prescribed lethal dose is delivered in a fractionated fashion in most cases, such as 2 Gy per fraction, to balance between killing tumor cells and normal cell repair.
RT relies on modern medical imaging techniques to achieve precise localization and dose delivery. Computed tomography (CT) imaging is currently the most important imaging modality that has been an integral part of each step of a typical RT treatment ( Fig. 1 ). CT scans are fast and widely available in clinical practice. CT images provide high-resolution and distortion-free anatomic information of human body, which are critical for high precision and accuracy required by RT. More important, there is an approximate linear correlation between the voxel intensity within CT images (often referred as the CT number) and the electron density of the soft tissue within image voxels, enabling the attenuation of various tissues to be calculated. Therefore, CT images can be used readily for estimating the radiation dose to tissues in vivo for treatment planning.

Radiation Therapy: From Simulation to Treatment Delivery
Simulation
A typical RT treatment (see Fig. 1 ) starts with an initial medical consultation and a special image acquisition called simulation, during which high-resolution anatomic CT images of the tumor region or the tumor bed in case of postsurgical radiotherapy are acquired. There are several important distinctions between simulation CT scans and the conventional diagnostic CT scans. Patients are scanned in body positions corresponding with the actual treatment position. This treatment position is maintained for the simulation and the subsequent RT treatments. A flat, hard table top equipped with dedicated immobilization devices designed for different body regions minimizes bulk body motion, and is always used for CT simulation. The overall aim of these special setups during simulation imaging is to minimize potential inconsistencies of the relative spatial location of tumor targets and the surrounding normal tissues between the time of CT simulation and of actual treatments so that the lethal dose can be delivered precisely to the tumor region.
Contouring
Based on the anatomic CT images acquired during simulation, radiation oncologists delineate (contour) the tumor region as well as critical normal structures where the radiation dose needs to be limited to reduce normal tissue toxicity. To improve the robustness, most clinics follow a 3-tier definition system recommended by Technical Report 50 from the International Commission on Radiation Units and Measurement to guide the definition of target volumes. These recommendations suggest physician-contoured gross tumor volume (GTV) and clinical target volume (CTV) to represent the target volume before treatment planning. During treatment planning, a planning target volume (PTV) created from the CTV as well as volume contours for critical normal tissues nearby, also referred the organ at risk (OAR), are also recommended. A schematic presentation of these volumes as well as real examples of them from a patient with nasopharyngeal carcinoma are shown in Fig. 2 .

The GTV often consists of palpable or visible malignancy from medical images. This volume ideally represents the maximum concentration of tumor cells in vivo. A margin is then created from the GTV to generate the CTV to represent subclinical involvement in tissues adjacent to the GTV, such as individual malignant clusters and microscopic extension tumor cells. Suspected malignant cells, such as regional lymph nodes, are also considered as parts of the CTV. In postsurgical cases, only the CTV is created. Owing to the fractionated nature of RT treatment, the planned dose is delivered across a period of several days to several weeks. Consequently, there are inevitable variations contributed by patient position owing to setup errors, by changes in CTV shape and size owing to different filling of surrounding tissues (such as rectal filling), and by small variations in performances of treatment machines (such as field sizes). A volume extension is then created from the CTV as the PTV to accommodate the variations and ensure all tissues within the CTV receive the prescribed dose. Normal tissue toxicity is an essential dose-limiting factor for RT. It is, therefore, important for contouring OARs, especially when there is complex organ geometry near the PTV. For example, in Fig. 2 B, the CTV (the purple contour) is very close to the brainstem (the cyan contour). To avoid high dose to the brainstem, the extension from the CTV to the PTV (the blue contour) was intentionally reduced toward the brainstem.
There are several sources for uncertainty in contouring, most notably poor soft tissue contrast from CT images and interrater and intrarater variabilities. Contouring is arguably the greatest challenge in modern RT. In contrast with poor soft tissue contrast in CT, MR imaging provides superior soft tissue contrast and flexibility of image acquisition in any orientation. Conventional anatomic MR imaging, most notably T1-weighted with and without gadolinium contrast, T2-weighted and fluid-attenuated inverse recovery T1- and T2-weighted images, have been used routinely in assistance of target and OAR contouring after image registration with simulation CT images. A major disadvantage of MR imaging for radiation treatment planning is that, unlike CT, the information on electron density required to calculate treatment dose is not provided directly. Clinical studies have shown that incorporation of MR imaging with CT improves the target delineation in most of body sites treated with RT ( Fig. 3 ), including the brain, head and neck, breast, and pelvis.

Treatment planning
Using CT data as the virtual patient, the team of radiation oncologists, dosimetrists, and medical physicists can now decide how to arrange external radiation spatially so that the resulting dose distribution calculated on the virtual patient has the prescription dose concentrated at the PTV while minimizing the dose to normal tissues. This process is called treatment planning and is now mainly performed with dedicated computer software, often referred as the treatment planning system. Advances in computer science and computer-driven multiple leaf collimator in early 1990s are the main driving forces for treatment planning. Using CT data, the treatment planning system visualizes the projection of the PTV and OARs along selected radiation beam incident angles and, using a multiple leaf collimator, the radiation aperture is shaped to conform to the PTV projection. The dose distribution from the selected beam arrangement can be superimposed onto the simulation CT for visualization (see Fig. 2 C) and, more important, dose to the PTV and OARs can be quantified by, for example, the cumulative dose volume histogram (see Fig. 2 D), which is a 2-dimensional plot of the histogram of the 3-dimensional (3D) dose within the structure. Cumulative dose volume histogram curves have dose along the horizontal axis and percentage volume receiving greater than the dose on the vertical axis. Using the dose volume histogram and dose distribution on the CT image, the planning team can adjust the beam arrangements manually until a satisfactory and optimized dose distribution is achieved. The plans generated with the abovementioned process are referred as the 3D conformal radiotherapy (3DCRT) plans. Although 3DCRT is capable of delivering a uniform dose to the PTV, it cannot generate a complicated dose distribution for tumor regions with concave PTVs that are immediately adjacent to critical normal tissues. For example, in treating nasopharyngeal cancer, the brainstem, whose dose tolerance is 54 Gy, is sometimes adjacent to the PTVs with a prescription dose of up to 70 Gy (see Fig. 2 ).
Intensity-modulated RT (IMRT) and volumetric-modulated arc therapy (VMAT) were developed to address the limitations of 3DCRT. Instead of manual iterative adjustments in 3DCRT, IMRT/VMAT takes user input goals for the PTV and normal tissues and uses an automatic algorithm to generate a sequence of aperture shapes and dose outputs through these apertures to attempt to satisfy the user’s goals ( Fig. 4 B). Compared with 3DCRT, IMRT/VMAT creates sharp dose fall-off gradient from the high-dose region in PTVs to low dose in adjacent OARs in a short physical distance, even for complicated PTV-OARs geometry such as panpelvic radiation of lymph nodes for postoperative cervical cancer treatment (see Fig. 4 ). A critical factor for successful IMRT planning is to have detailed and accurate knowledge of PTVs and OARs so that the inverse planning algorithm can derive an accurate dose distribution.

Treatment delivery
Based on radiobiological principles, RT is normally delivered in multiple fractions (as many as 35). Before each fraction, patient position is verified against the simulation CT using portal radiographic imaging or on-board cone beam CT if critical OARs are adjacent to the PTVs. This can account for day-to-day variations in positioning and organ shifts.
Treatment response evaluation
Imaging also plays an essential role in evaluation of treatment response (see Fig. 1 ). Posttreatment imaging is normally preformed at 2 to 3 months after RT is completed. Currently, the most commonly used evaluation criteria for solid tumors is imaging-guided tumor size measurement following the guidelines first proposed by the World Health Organization in 1981 and further revised as the Response Evaluation Criteria in Solid Tumors (RECIST) in 2000 and as RECIST 1.1 in 2009. In brief, RECIST standardizes target lesion size measurement at the pretreatment imaging (as the baseline) and each follow-up imaging as the sum of their unidimensional size measurements. With comparisons to the baseline, patients are categorized into 4 response groups of complete response, partial response, stable disease, or progressive disease, solely based on target lesion size measured at each follow-up.
Clinical decisions are then made mainly based on different response categories. For example, for the partial response and stable disease groups, potential boost radiation treatment will be carried and, in contrast, different treatment modalities or salvage radiation treatment will be the likely choice for the progressive disease group (see Fig. 1 ).
However, several limitations of RECIST have been well-documented. One fundamental limitation is that RECIST reflects a simplified tumor size measure. Volumetric change in tumor results from a cascade of complicated and progressive pathophysiologic and biological responses to radiation, which normally occurs weeks and months before any detectable anatomic changes. In addition, many new treatment techniques may be cytostatic, which will not result in measurable volume changes in anatomic CT or MR images. On the other but equally important front of RT, radiation-induced normal tissue toxicity is the main dose-limiting factor that affects the total achievable dose to tumor regions. Most of radiation-induced normal tissue injuries will not cause volumetric changes during the acute phase.
From Anatomic Imaging to Functional Imaging
Given the limitations of conventional anatomic imaging, there is a great interest in functional imaging modalities that can provide information on tumor radiobiology, such as angiogenesis and hypoxia, and pathophysiologic processes, including abnormal metabolism and uncontrolled proliferation, both spatially and temporally. These image features, often referred as image biomarkers, should be predictive to guide and optimize treatment strategy. For example, if early functional imaging examination during the treatment detects hypoxic subvolumes, a switch to a more effective treatment, such as simultaneous dose escalation to radiation-resistant hypoxic subvolumes with IMRT techniques, or concurrent prescription of drugs that specifically target hypoxic cells, can be carried out to improve treatment efficacy. For normal tissue toxicity, such functional imaging modalities can detect spatial location and severity of early onset radiation-induced injuries so that early pharmacologic therapies or reoptimization of the treatment plan can take place to prevent or slow down the sequence of biological events that will, if not intervened, lead to permanent radiation-induced injuries.
Molecular imaging modalities, such as PET, provide promising solutions to address these clinical issues. The strength of PET is its high sensitivity, requiring only a very small amount of radiolabeled tracer (picomolar range) injected in vivo. An increasing number of PET tracers are specific to many biological processes that are the hallmarks of cancer cells. For example, uptake of 18 F-2-deoxy- d -glucose ( 18 F-FDG) increases with upregulating glucose transporters owing to abnormal metabolism of cancer cells and sustained proliferative signal, 18 F-fluroromisonidazole ( 18 FMISO) are sensitive and specific to hypoxic tumor cell clusters owing to abnormal perfusion and tumor vasculatures from disordered angiogenesis. Uptake of 18 F-fluoro-3’-deoxythymidine ( 18 F-FLT) increases in tumor cells owing to accelerated synthesis of DNA and increased thymidine kinase 1 in tumor, an imaging marker for uncontrolled proliferation.
In parallel to advances in clinical PET applications in RT, recent developments in MR imaging, especially parallel imaging and parallel RF transmission that improve imaging acquisition efficiency and reduce image artifacts owing to geometric distortion, have made several advanced MR imaging techniques applicable to clinical RT applications. In contrast with conventional anatomic MR imaging, that is, T1, T2, and proton density MR imaging, contrasts in these MR imaging modalities directly or indirectly correlate with the physiologic and biological processes closely associated with tumor biology and radiobiology. For example, quantitative measures derived from dynamic contrast-enhanced MR imaging (DCE-MR imaging) quantify changes in microvascular permeability owing to abnormal angiogenesis in tumor. Changes in oxygen concentration in venous vessels and in extracellular and extravascular space owing to hypoxic condition will result in detectable changes of image intensity of blood oxygenation level–dependent (BOLD) and tissue oxygenation level–dependent (TOLD) MR imaging, respectively. Changes in cell density owing to abnormal proliferation rate in tumor and break-down of cell membranes under radiation will affect microscopic water diffusion in vivo, which will be detected by diffusion-weighted MR imaging (DWI) and diffusion tensor MR imaging (DTI).
With technical advances in both PET and MR imaging ends, the advantages of having a hybrid PET/MR imaging became appealing for RT. (1) Compared with PET/CT, PET/MR imaging provides high-resolution anatomic MR images with superior soft tissue contrast, which may further reduce variations in target delineation. (2) Functional information from MR imaging and PET are complementary and simultaneous acquisitions of both modalities will potentially compensate modeling/technical limitations of each modality and consequently provide better understanding of complexity in tumor pathology and radiobiology. For example, the physiologic causes for increased uptake of 18 F-FDG-PET in tumor cells are multifactorial, including increased metabolism level and local abnormal perfusion conditions near and inside the tumor. With simultaneous acquisition of DCE-MR imaging and 18 F-FDG-PET imaging, it is possible to study the correlation between dynamic changes of tracer uptake and local perfusion dynamics. Information from DCE-MR imaging can be incorporated into the PET tracer kinetic model to improve its overall robustness. 18 FMISO-PET has been an important imaging biomarker for hypoxia. However, with a coarse voxel resolution (commonly a scale of 4 mm to 1 cm), partial volume effects in PET will potentially include both hypoxic and nonhypoxic clusters ( Fig. 5 C). In contrast, TOLD MR imaging has much better image resolution (see Fig. 5 B) and, therefore, can be used to correct partial volume effect in PET data. (3) With simultaneous acquisitions of multiple functional parameters of tumors, metabolism, and hypoxia, perfusion and diffusion maps from PET/MR imaging are naturally fused together with minimal misregistration spatially. For the first time, it may become possible to perform robust multiparametric image analysis to address patient-specific tumor features, such as intratumor heterogeneity. Consequently, these new results can steer RT treatment strategy toward personalized radiotherapy with aids of more accurate delineation of biological target volume and advanced treatment delivery techniques such as IMRT/VMAT. (4) Last, an integrated PET/MR imaging also has several practical advantages. It can provide “one-stop” acquisitions for all PET and MR imaging images necessary for diagnostic and treatment planning purpose instead of separate stops for PET and MR imaging acquisitions in current practice. Minimized radiation exposure with PET/MR imaging is especially important for pediatric patients and young adults.

Introduction
Radiation therapy (RT) is an important part of the standard of care for most solid tumor types. The principle of modern RT is to deliver a tumor-killing level radiation dose precisely and accurately to the targeted volume, normally solid tumors as well as surrounding regions with high-risk of microscopic invasions, while minimizing dose to critical normal tissue structures nearby. This delivery can be achieved using high energy photon, electron, or heavily charged particle beams. Following radiobiology principles, the prescribed lethal dose is delivered in a fractionated fashion in most cases, such as 2 Gy per fraction, to balance between killing tumor cells and normal cell repair.
RT relies on modern medical imaging techniques to achieve precise localization and dose delivery. Computed tomography (CT) imaging is currently the most important imaging modality that has been an integral part of each step of a typical RT treatment ( Fig. 1 ). CT scans are fast and widely available in clinical practice. CT images provide high-resolution and distortion-free anatomic information of human body, which are critical for high precision and accuracy required by RT. More important, there is an approximate linear correlation between the voxel intensity within CT images (often referred as the CT number) and the electron density of the soft tissue within image voxels, enabling the attenuation of various tissues to be calculated. Therefore, CT images can be used readily for estimating the radiation dose to tissues in vivo for treatment planning.
Radiation Therapy: From Simulation to Treatment Delivery
Simulation
A typical RT treatment (see Fig. 1 ) starts with an initial medical consultation and a special image acquisition called simulation, during which high-resolution anatomic CT images of the tumor region or the tumor bed in case of postsurgical radiotherapy are acquired. There are several important distinctions between simulation CT scans and the conventional diagnostic CT scans. Patients are scanned in body positions corresponding with the actual treatment position. This treatment position is maintained for the simulation and the subsequent RT treatments. A flat, hard table top equipped with dedicated immobilization devices designed for different body regions minimizes bulk body motion, and is always used for CT simulation. The overall aim of these special setups during simulation imaging is to minimize potential inconsistencies of the relative spatial location of tumor targets and the surrounding normal tissues between the time of CT simulation and of actual treatments so that the lethal dose can be delivered precisely to the tumor region.
Contouring
Based on the anatomic CT images acquired during simulation, radiation oncologists delineate (contour) the tumor region as well as critical normal structures where the radiation dose needs to be limited to reduce normal tissue toxicity. To improve the robustness, most clinics follow a 3-tier definition system recommended by Technical Report 50 from the International Commission on Radiation Units and Measurement to guide the definition of target volumes. These recommendations suggest physician-contoured gross tumor volume (GTV) and clinical target volume (CTV) to represent the target volume before treatment planning. During treatment planning, a planning target volume (PTV) created from the CTV as well as volume contours for critical normal tissues nearby, also referred the organ at risk (OAR), are also recommended. A schematic presentation of these volumes as well as real examples of them from a patient with nasopharyngeal carcinoma are shown in Fig. 2 .
The GTV often consists of palpable or visible malignancy from medical images. This volume ideally represents the maximum concentration of tumor cells in vivo. A margin is then created from the GTV to generate the CTV to represent subclinical involvement in tissues adjacent to the GTV, such as individual malignant clusters and microscopic extension tumor cells. Suspected malignant cells, such as regional lymph nodes, are also considered as parts of the CTV. In postsurgical cases, only the CTV is created. Owing to the fractionated nature of RT treatment, the planned dose is delivered across a period of several days to several weeks. Consequently, there are inevitable variations contributed by patient position owing to setup errors, by changes in CTV shape and size owing to different filling of surrounding tissues (such as rectal filling), and by small variations in performances of treatment machines (such as field sizes). A volume extension is then created from the CTV as the PTV to accommodate the variations and ensure all tissues within the CTV receive the prescribed dose. Normal tissue toxicity is an essential dose-limiting factor for RT. It is, therefore, important for contouring OARs, especially when there is complex organ geometry near the PTV. For example, in Fig. 2 B, the CTV (the purple contour) is very close to the brainstem (the cyan contour). To avoid high dose to the brainstem, the extension from the CTV to the PTV (the blue contour) was intentionally reduced toward the brainstem.
There are several sources for uncertainty in contouring, most notably poor soft tissue contrast from CT images and interrater and intrarater variabilities. Contouring is arguably the greatest challenge in modern RT. In contrast with poor soft tissue contrast in CT, MR imaging provides superior soft tissue contrast and flexibility of image acquisition in any orientation. Conventional anatomic MR imaging, most notably T1-weighted with and without gadolinium contrast, T2-weighted and fluid-attenuated inverse recovery T1- and T2-weighted images, have been used routinely in assistance of target and OAR contouring after image registration with simulation CT images. A major disadvantage of MR imaging for radiation treatment planning is that, unlike CT, the information on electron density required to calculate treatment dose is not provided directly. Clinical studies have shown that incorporation of MR imaging with CT improves the target delineation in most of body sites treated with RT ( Fig. 3 ), including the brain, head and neck, breast, and pelvis.
Treatment planning
Using CT data as the virtual patient, the team of radiation oncologists, dosimetrists, and medical physicists can now decide how to arrange external radiation spatially so that the resulting dose distribution calculated on the virtual patient has the prescription dose concentrated at the PTV while minimizing the dose to normal tissues. This process is called treatment planning and is now mainly performed with dedicated computer software, often referred as the treatment planning system. Advances in computer science and computer-driven multiple leaf collimator in early 1990s are the main driving forces for treatment planning. Using CT data, the treatment planning system visualizes the projection of the PTV and OARs along selected radiation beam incident angles and, using a multiple leaf collimator, the radiation aperture is shaped to conform to the PTV projection. The dose distribution from the selected beam arrangement can be superimposed onto the simulation CT for visualization (see Fig. 2 C) and, more important, dose to the PTV and OARs can be quantified by, for example, the cumulative dose volume histogram (see Fig. 2 D), which is a 2-dimensional plot of the histogram of the 3-dimensional (3D) dose within the structure. Cumulative dose volume histogram curves have dose along the horizontal axis and percentage volume receiving greater than the dose on the vertical axis. Using the dose volume histogram and dose distribution on the CT image, the planning team can adjust the beam arrangements manually until a satisfactory and optimized dose distribution is achieved. The plans generated with the abovementioned process are referred as the 3D conformal radiotherapy (3DCRT) plans. Although 3DCRT is capable of delivering a uniform dose to the PTV, it cannot generate a complicated dose distribution for tumor regions with concave PTVs that are immediately adjacent to critical normal tissues. For example, in treating nasopharyngeal cancer, the brainstem, whose dose tolerance is 54 Gy, is sometimes adjacent to the PTVs with a prescription dose of up to 70 Gy (see Fig. 2 ).
Intensity-modulated RT (IMRT) and volumetric-modulated arc therapy (VMAT) were developed to address the limitations of 3DCRT. Instead of manual iterative adjustments in 3DCRT, IMRT/VMAT takes user input goals for the PTV and normal tissues and uses an automatic algorithm to generate a sequence of aperture shapes and dose outputs through these apertures to attempt to satisfy the user’s goals ( Fig. 4 B). Compared with 3DCRT, IMRT/VMAT creates sharp dose fall-off gradient from the high-dose region in PTVs to low dose in adjacent OARs in a short physical distance, even for complicated PTV-OARs geometry such as panpelvic radiation of lymph nodes for postoperative cervical cancer treatment (see Fig. 4 ). A critical factor for successful IMRT planning is to have detailed and accurate knowledge of PTVs and OARs so that the inverse planning algorithm can derive an accurate dose distribution.
Treatment delivery
Based on radiobiological principles, RT is normally delivered in multiple fractions (as many as 35). Before each fraction, patient position is verified against the simulation CT using portal radiographic imaging or on-board cone beam CT if critical OARs are adjacent to the PTVs. This can account for day-to-day variations in positioning and organ shifts.
Treatment response evaluation
Imaging also plays an essential role in evaluation of treatment response (see Fig. 1 ). Posttreatment imaging is normally preformed at 2 to 3 months after RT is completed. Currently, the most commonly used evaluation criteria for solid tumors is imaging-guided tumor size measurement following the guidelines first proposed by the World Health Organization in 1981 and further revised as the Response Evaluation Criteria in Solid Tumors (RECIST) in 2000 and as RECIST 1.1 in 2009. In brief, RECIST standardizes target lesion size measurement at the pretreatment imaging (as the baseline) and each follow-up imaging as the sum of their unidimensional size measurements. With comparisons to the baseline, patients are categorized into 4 response groups of complete response, partial response, stable disease, or progressive disease, solely based on target lesion size measured at each follow-up.
Clinical decisions are then made mainly based on different response categories. For example, for the partial response and stable disease groups, potential boost radiation treatment will be carried and, in contrast, different treatment modalities or salvage radiation treatment will be the likely choice for the progressive disease group (see Fig. 1 ).
However, several limitations of RECIST have been well-documented. One fundamental limitation is that RECIST reflects a simplified tumor size measure. Volumetric change in tumor results from a cascade of complicated and progressive pathophysiologic and biological responses to radiation, which normally occurs weeks and months before any detectable anatomic changes. In addition, many new treatment techniques may be cytostatic, which will not result in measurable volume changes in anatomic CT or MR images. On the other but equally important front of RT, radiation-induced normal tissue toxicity is the main dose-limiting factor that affects the total achievable dose to tumor regions. Most of radiation-induced normal tissue injuries will not cause volumetric changes during the acute phase.
From Anatomic Imaging to Functional Imaging
Given the limitations of conventional anatomic imaging, there is a great interest in functional imaging modalities that can provide information on tumor radiobiology, such as angiogenesis and hypoxia, and pathophysiologic processes, including abnormal metabolism and uncontrolled proliferation, both spatially and temporally. These image features, often referred as image biomarkers, should be predictive to guide and optimize treatment strategy. For example, if early functional imaging examination during the treatment detects hypoxic subvolumes, a switch to a more effective treatment, such as simultaneous dose escalation to radiation-resistant hypoxic subvolumes with IMRT techniques, or concurrent prescription of drugs that specifically target hypoxic cells, can be carried out to improve treatment efficacy. For normal tissue toxicity, such functional imaging modalities can detect spatial location and severity of early onset radiation-induced injuries so that early pharmacologic therapies or reoptimization of the treatment plan can take place to prevent or slow down the sequence of biological events that will, if not intervened, lead to permanent radiation-induced injuries.
Molecular imaging modalities, such as PET, provide promising solutions to address these clinical issues. The strength of PET is its high sensitivity, requiring only a very small amount of radiolabeled tracer (picomolar range) injected in vivo. An increasing number of PET tracers are specific to many biological processes that are the hallmarks of cancer cells. For example, uptake of 18 F-2-deoxy- d -glucose ( 18 F-FDG) increases with upregulating glucose transporters owing to abnormal metabolism of cancer cells and sustained proliferative signal, 18 F-fluroromisonidazole ( 18 FMISO) are sensitive and specific to hypoxic tumor cell clusters owing to abnormal perfusion and tumor vasculatures from disordered angiogenesis. Uptake of 18 F-fluoro-3’-deoxythymidine ( 18 F-FLT) increases in tumor cells owing to accelerated synthesis of DNA and increased thymidine kinase 1 in tumor, an imaging marker for uncontrolled proliferation.
In parallel to advances in clinical PET applications in RT, recent developments in MR imaging, especially parallel imaging and parallel RF transmission that improve imaging acquisition efficiency and reduce image artifacts owing to geometric distortion, have made several advanced MR imaging techniques applicable to clinical RT applications. In contrast with conventional anatomic MR imaging, that is, T1, T2, and proton density MR imaging, contrasts in these MR imaging modalities directly or indirectly correlate with the physiologic and biological processes closely associated with tumor biology and radiobiology. For example, quantitative measures derived from dynamic contrast-enhanced MR imaging (DCE-MR imaging) quantify changes in microvascular permeability owing to abnormal angiogenesis in tumor. Changes in oxygen concentration in venous vessels and in extracellular and extravascular space owing to hypoxic condition will result in detectable changes of image intensity of blood oxygenation level–dependent (BOLD) and tissue oxygenation level–dependent (TOLD) MR imaging, respectively. Changes in cell density owing to abnormal proliferation rate in tumor and break-down of cell membranes under radiation will affect microscopic water diffusion in vivo, which will be detected by diffusion-weighted MR imaging (DWI) and diffusion tensor MR imaging (DTI).
With technical advances in both PET and MR imaging ends, the advantages of having a hybrid PET/MR imaging became appealing for RT. (1) Compared with PET/CT, PET/MR imaging provides high-resolution anatomic MR images with superior soft tissue contrast, which may further reduce variations in target delineation. (2) Functional information from MR imaging and PET are complementary and simultaneous acquisitions of both modalities will potentially compensate modeling/technical limitations of each modality and consequently provide better understanding of complexity in tumor pathology and radiobiology. For example, the physiologic causes for increased uptake of 18 F-FDG-PET in tumor cells are multifactorial, including increased metabolism level and local abnormal perfusion conditions near and inside the tumor. With simultaneous acquisition of DCE-MR imaging and 18 F-FDG-PET imaging, it is possible to study the correlation between dynamic changes of tracer uptake and local perfusion dynamics. Information from DCE-MR imaging can be incorporated into the PET tracer kinetic model to improve its overall robustness. 18 FMISO-PET has been an important imaging biomarker for hypoxia. However, with a coarse voxel resolution (commonly a scale of 4 mm to 1 cm), partial volume effects in PET will potentially include both hypoxic and nonhypoxic clusters ( Fig. 5 C). In contrast, TOLD MR imaging has much better image resolution (see Fig. 5 B) and, therefore, can be used to correct partial volume effect in PET data. (3) With simultaneous acquisitions of multiple functional parameters of tumors, metabolism, and hypoxia, perfusion and diffusion maps from PET/MR imaging are naturally fused together with minimal misregistration spatially. For the first time, it may become possible to perform robust multiparametric image analysis to address patient-specific tumor features, such as intratumor heterogeneity. Consequently, these new results can steer RT treatment strategy toward personalized radiotherapy with aids of more accurate delineation of biological target volume and advanced treatment delivery techniques such as IMRT/VMAT. (4) Last, an integrated PET/MR imaging also has several practical advantages. It can provide “one-stop” acquisitions for all PET and MR imaging images necessary for diagnostic and treatment planning purpose instead of separate stops for PET and MR imaging acquisitions in current practice. Minimized radiation exposure with PET/MR imaging is especially important for pediatric patients and young adults.
PET/MR imaging for hallmarks of cancer radiobiology in radiation therapy
Compared with PET/CT, previous comparative studies demonstrated that the combination of PET and anatomic MR imaging can achieve a more accurate delineation of the gross target volumes and better identification of normal tissue boundaries for RT treatment planning, especially for brain tumors, recurrent breast cancer, and prostate and bone metastases. In addition, PET/MR imaging with integration of multiparametric MR imaging beyond anatomic MR imaging, such as DWI, perfusion MR imaging and MR spectroscopy, will further improve sensitivity and specificity of tumor detection and target delineation, for example, multiparametric MR imaging has been recommended as the imaging standard for detecting and staging tumors inside the prostate gland.
More important, the synergy of complementary information from simultaneous PET and MR imaging creates unprecedented opportunities to quantify, both spatially and temporally, pathophysiologic processes that are hallmarks of tumor response to RT. With these quantitative measures, effective early assessment of tumor response or dynamic monitoring of normal tissue toxicity become possible, which will potentially lead to paradigm shift changes in RT treatment strategy for more effective tumor control and minimized radiation injuries to normal tissue.
Hypoxia, accelerated proliferation of tumor cells, and intrinsic radioresistance of cancer stem cells are identified as 3 main mechanisms causing failures of RT. Many key and interrelated biological processes of each mechanism, such as angiogenesis, perfusion, increased metabolism and hypercellularity of tumor cells, can be quantified by PET and MR imaging.
PET/MR Imaging for Metabolism and Proliferation
The 2 most fundamental hallmarks of cancer cell are its capability of deregulating the growth promotion signals and suppress the antiproliferation signals. These are what Hanahan and Weinberg called “sustaining proliferative signaling” and “evading growth suppressors” to maintain the chronic cell proliferation, a so-called “reprogramming energy metabolism,” another hallmark of cancer cell biology, emerges to adjust energy metabolism. Cancer cells prefer aerobic glycolysis, during which the pyruvate is converted into lactate instead of going through the tricarboxylic acid cycle and oxidative phosphorylation process.
Many biological processes associated with tumor metabolism and proliferation can be imaged by specifically designed PET tracers or functional MR imaging. A short summary of imaging principles of these modalities as well as their advantage/disadvantages is provided in Table 1 .
| Imaging Techniques | Biological Processes | Quantitative Measures | Pathophysiologic Correlations | Advantages | Disadvantages |
|---|---|---|---|---|---|
| 18 F-FDG |
| SUV max /TBR/TMR | Accumulation of 18 F-FDG within cells can be used as a surrogate biomarker for glucose uptake to quantify metabolic activity and viability of tumor cells. |
|
|
| 18 F-FLT |
| SUV max /TBR/TMR | The target molecule for FLT is TK1, which can be overexpressed, up to 15 times, at the S phase of tumor cells compared with normal cells. Its concentration is correlated to the TK1 activity. |
|
|
| MET/FET and 11 C-, 18 F-choline | Uncontrolled tumor cell proliferation leads to accelerated synthesis of proteins and synthesis of membrane lipid. This group of PET tracers are building blocks of either protein or membrane lipid. | SUV max /TBR/TMR |
|
|
|
| 68 Ga-PSMA |
| SUV max /TBR/TMR | 68 Ga-PSMA is 68 Ga-labeled small molecules of PSMA inhibitors or antibody, which can bind with PSMA. Most of these tracers will have glutamate and also a zinc-binding component. |
|
|
| DWI/DTI | Water diffusion in vivo is hindered by cell membranes, intracellular and extracellular organelles and microstructures; therefore, reflects the spatial organization of surrounding anatomic structures. | Apparent diffusion coefficient/fractional anisotropy/mean diffusivity | Very sensitive to cell density, intracellular and extracellular volume, which can be used for detection of hypercellularity in tumors owing to aberrant proliferation, for early evaluation of tumor response. |
|
|
| MRS | Many metabolites in vivo are either building block of cell membrane, such as choline, or direct/indirect products of cell metabolism, such as lactate and creatine, or neurotransmitters like NAA. | Area under the peak of each metabolite in MRS |
|
|
|
| Hyperpolarized 13 C-pyruvate | Naturally occurring 13 C in vivo is extremely low, it makes 13 C MRS a unique technique to quantify the rate of glycolysis by following the injection of 13 C-labeled pyruvate. | Area under the peak of metabolite in MRS | Pyruvate is associated with aerobic glycolysis, which is the main metabolic mechanism by tumor cells. |
|
|
| CEST MR imaging |
| Area under the peak of CEST spectrum |
|
|
|
Definition of target volume for radiation treatment planning is one of the most challenging components for modern RT, especially with highly conformal beam delivery techniques, such as IMRT. Integration of functional information from PET, such as increased metabolism from 18 F-FDG-PET, and from MR imaging, such as increased cellular density owing to aberrant cell proliferation from DWI, greatly improved the accuracy of target volume delineation.
Several comparative studies have shown that, compared with a PTV definition based on CT only, integration of 18 F-FDG-PET has decreased interrater variability and improved the accuracy of target definition for a variety of cancer treatments. In many institutions, 18 F-FDG-PET/CT scanning has been used as the standard approach for target definition of lung, cervical, and head and neck cancers. Decreased signal in apparent diffusion coefficient (ADC) maps from DWI has been used as imaging biomarker for grading and volume delineation of glioma and cervix. Multiparametric MR imaging, including DWI and DCE-MR imaging, has been increasingly applied for radiation treatment planning of prostate cancer. With advances in pulse sequence design and fast imaging techniques, whole-body DWI plays more and more important role in oncologic applications, including screening and detection of remote metastases.
Several recent developments in novel PET tracers and MR imaging techniques also open new opportunities of improving sensitivity and specificity of PET and MR imaging for the characterization of tumor metabolism and proliferation. A short summary of these developments is provided in this section.
Among them, application of DWI with high b values (>2000 s/mm 2 ) may have immediate impact on clinical management and radiation treatment of many solid tumor types. Diffusion is very sensitive to cell density, intracellular and extracellular volumes, which can be used for the detection of hypercellularity in tumors owing to aberrant proliferation and for early evaluation of tumor response. For most solid tumors being treated by RT, water diffusion is approximately isotropic. In body temperature, free water diffusion in vivo is about 3 × 10 −6 mm 2 /ms. With a typical b value of 1000 s/mm 2 , clinical DWI will measure the displacement of free water molecules of 30 microns. Simplified illustrations of DWI applications for RT are included in Fig. 6 . In an image voxel of normal brain white matter tissues (see Fig. 6 A), intracellular and extracellular diffusion (represented by yellow and red dots, respectively) do not exchange owing to myelin sheath and both contribute to measured diffusion in DWI. In tumor tissue, cells are highly packed with a slightly increased cell size (see Fig. 6 B). Hypercellularity reduces extracellular diffusion dramatically and increases intracellular diffusion mildly. It leads to an overall decrease in diffusion. After RT, radiation-induced injury, such as necrosis, may damage/destroy intracellular organelles and cell membrane, which will open gates for free diffusion between extracellular and intracellular space (see Fig. 6 C). Overall diffusion increases. Using a high b value, all tissues with fast diffusion will attenuate to low signal, except tumor cells, which are highlighted owing to hypercellularity and restricted diffusion (see Fig. 6 D).
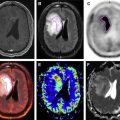
A recent study of high b value DWI for radiation target volume delineation of high-grade glioblastoma by Pramanik and colleagues is one of the examples. Standard MR imaging includes Gd contrast-enhanced T1 and fluid-attenuated inversion recovery T2 MR imaging. DWI images with a b value of 1000 s/mm 2 are often included for assistance of tumor grading. Owing to tumor heterogeneity, many active glioblastomas have non–contrast-enhanced subregions. Edema and postoperative inflammation often lead to overestimation in fluid-attenuated inverse recovery images and inconsistent ADC changes owing to a mixture of high cellular tumor cells, edema, and normal and scar tissues. This study applied DWIs of high b values of up to 3000 s/mm 2 to 21 patients with glioblastoma underwent postresection chemoradiation. PTV definition was based on contrast-enhanced T1-weighted images. Among 15 patients with posttreatment progression, 14 patients had incomplete dose coverage for the pretreatment hypercellularity volumes, which was defined based on DWIs with a b value of 3000 s/mm 2 ( Fig. 7 ). The nonenhanced hypercellularity volumes and the subvolume of hypercellularity volume that was not coverage by the prescription dose were significant negative prognostic indicators for the progression free survival. High b value DWI increases the sensitivity and specificity for detection of hypercellular components in high-grade glioblastoma and will improve accuracy of target delineation. High b value DWI is quick, typically 2 to 3 minutes, and can be readily implemented in most clinical MR imaging scanners.
For prostate cancers, multiparametric MR imaging has shown promising results for prostate cancer detection. Meanwhile, clinical applications of 68 Ga-PSMA PET showed improved detection of recurrent prostate cancer and better image contrast between tumor and normal regions with comparison to commonly used PET with 18 F-choline. A recent comparative study that acquired simultaneous 68 Ga-PSMA PET and multiparametric MR imaging on a PET/MR imaging for a group of 53 patients with prostate cancer have shown statistically significant improvements in detecting prostate cancer. Compared with biopsy results ( Fig. 8 ), simultaneous PET/MR imaging outperformed multiparametric MR imaging alone (area under curve, 0.88 vs 0.73; P <.001) and PET imaging alone (area under curve, 0.88 vs 0.83; P = .002). This study is an excellent example of synergies of PET/MR imaging.
Meanwhile, recent developments in 13 C-pyruvate MR imaging show promising results that increased 13 C-pyruvate and 13 C-lactate concentrations can be image biomarkers for an increased level of aerobic glycolysis in tumor cells with good sensitivity and specificity. Such regions could be escalated to higher RT doses. A recent clinical study using hyperpolarized 13 C-pyruvate MR imaging has proven its feasibility for clinical imaging of patients with prostate cancer. The feasibility of simultaneous 13 C-pyruvate MR imaging/PET on a clinical PET/MR imaging was also demonstrated by a recent canine study of liposarcoma. In tumors, both 18 F-FDG-PET and 13 C-pyruvate MR imaging showed increased uptake and increased lactate concentration, indicating increased aerobic glycolysis ( Fig. 9 A–C). More interestingly, increased uptake of 18 F-FDG-PET was observed in muscles owing to dog exercise before imaging and, meanwhile, nonenhancement from 13 C-pyruvate MR imaging clearly demonstrate the high specificity of 13 C-pyruvate MR imaging in detection of aerobic glycolysis (see Fig. 9 B vs Fig. 9 D, E).
Recently, studies of glucose chemical exchange saturation transfer (CEST) MR imaging, which uses injection of a few grams of dextrose solution as the exogenous contrast, both in animal studies and in human patients with head and neck cancers have shown significantly increased glucose CEST signal in tumor regions with comparison to normal tissues. These interesting results raise questions about whether CEST MR imaging using endogenous metabolites or exogenous contrast agents can be a viable alternative to PET imaging with specific tracers that target similar metabolites or functional processes, for example, glucose CEST MR imaging versus 18 FDG-PET ( Table 2 ). Several preliminary studies have shown that CEST and PET information are complementary. Although current CEST MR imaging is impractical for initial whole body screening purposes, it is not unrealistic that the glucose CEST MR imaging can be used instead of 18 FDG-PET for the early evaluation of treatment response during RT for tumors of known locations. If using CEST MR imaging for quantification of tumor metabolism, simultaneous PET acquisition of other tracers, such as 18 FMISO or 18 F-HX4 for hypoxia, can be performed. Metabolic information from CEST MR imaging and hypoxic information from PET can be combined for better characterization of tumor heterogeneity and, ultimately, better treatment adaptation.
| Parameters | CEST-MR Imaging | PET |
|---|---|---|
| Spatial resolution | In a scale of 1–2 mm, no intrinsic limitation but trade-off with Z-spectrum resolution and scanning time. | In a scale of 4-5 mm and intrinsic limitations from scatter and detector size. |
| Temporal resolution |
| Typically 2–4 min per bed station. |
| Sensitivity | Intermediate sensitivity and typically micromolar to millimolar concentration. | High sensitivity and picomolar tracer concentration. |
| Selectivity |
| Selectivity defined by PET tracers. |
| Risks |
| Radiation dose from tracer is still a risk factor for pediatric and female patients at child-bearing age. |
| Pitfalls |
|
|
PET/MR Imaging for Angiogenesis and Hypoxia
Tumor angiogenesis is another hallmark biological process of cancer cells. Hypoxia is one of most important biological processes that modulates the outcome of RT and it originates from the tumor microenvironment, where the demand of the oxygen exceeds the supply of the oxygen. The level of tumor hypoxia is a prognostic indicator for the overall treatment of many types of solid tumors.
Angiogenesis and hypoxia are highly interplayed biological processes in tumor. Tumor blood vessels are leaky, highly heterogeneous, and tortuous with complicated branching patterns. All these structural abnormalities lead to impairment of oxygen supply/exchange and consequently hypoxic condition. There are 2 basic types of hypoxia in vivo: chronic and acute hypoxia. Chronic hypoxia usually happens within the distance of 100 to 180 microns around blood vessels and is caused by limited diffusion range of oxygen from tumor vessels to surrounding tissues. Chronic hypoxia lasts from hours to days and regions with chronic hypoxia are highly heterogeneous within the tumor. Acute hypoxia, in contrast, is mainly related to instability of blood flow owing to structural abnormalities in tumor vessels and consequent transient changes in perfusion. The oxygen pressure in acute hypoxic regions fluctuates over time and acute hypoxic regions are highly variant spatiotemporally. Oxygen is an excellent radiosensitizer that makes DNA damage from radiation permanent. Whether chronic or acute, reduction or absence of oxygen significantly increases radioresistance of tumor in hypoxic regions, by up to 3 times. Both hypoxia types contribute to development of more aggressive tumor phenotypes.
Imaging of hypoxia can be important for RT for 2 main reasons. First, it can determine hypoxic status based on functional imaging information to enable stratification of patients for different treatment regimes, for example, targeted therapy or hypoxic radiosensitizers along with RT versus RT alone. Second, imaging can provide spatial distribution of hypoxic subregions within the tumor and can potentially quantify severity as well as monitor dynamic changes of hypoxia. With recent advances in high-precision delivery techniques, such as IMRT and VMAT, and high precision imaging guidance during treatment, including on-board daily cone beam CT, there is a growing interest in hypoxic image-guided radiation dose painting to provide selective dose escalation to radioresistant hypoxic subregions, without overdose surround normal tissues.
PET imaging, using the hypoxia-specific nitroimidazoles derivatives 18 FMISO, 18 F-fluoroazomycin arabinoside ( 18 F-FAZA), and HX4, can play an important role in hypoxia imaging-guided RT. So far, the most studied cancer type with PET hypoxia image–guided dose painting is head and neck cancers. A brief summary of published studies including main results is provided in Table 3 . PET hypoxia image–guided dose painting was recently extended to other cancer types, such as HX4 PET for non–small cell lung cancer. All these studies have shown that hypoxia image–guided radiotherapy is technically feasible and can improve therapeutic ratio.
| Authors | Patient Number | PET Tracer | Hypoxia Criteria | Dose Escalation | Evaluation | Note |
|---|---|---|---|---|---|---|
| Chao et al, 2001 | NA | Cu-ATSM | TMR >2 | 80 Gy | Planning study, no TCP modeling. | First hypoxia image–guided dose painting, showing the feasibility of dose painting. |
| Thorwarth et al, 2007 | 12 | 18 FMISO | DPBN | Up to 20% boost | Planning study. Mean 14.3% increase in TCP. | Quantitative comparison of 2 dose painting approaches: uniform dose painting to subvolume and DPBN. |
| Grosu et al, 2007 | 18 | FAZA | TMR >1.5 | 80 Gy | Planning study, no TCP modeling. | First feasibility study with FAZA imaging of hypoxia in HNSCC. |
| Lin et al, 2008 | 7 | 18 FMISO | TBR >1.3 | 84 Gy | Planning study, no TCP modeling. | Longitudinal 18 FMISO scans with 3 d apart. Change of tumor hypoxia pattern compromised the coverage of hypoxic tumor volumes by dose painting. |
| Lee et al, 2008 | 10 | 18 FMISO | TBR >1.3 | 84 Gy | Planning study, no TCP modeling. | Feasibility study. Dose escalation to 84 Gy was successful for all patients without violate normal tissue tolerance. One patient has escalation up to 105 Gy. |
| Bowen et al, 2009 | 3 | Cu-ATSM | DPBN | Up to 90 Gy | Planning study, no TCP modeling. | Methodology paper about improving accuracy for dose painting. |
| Choi et al, 2010 | 8 | 18 FMISO | Tumor/cerebellum Ratio >1.3 | 78 Gy | Planning study, no TCP modeling. | For 6 of 8 patients, dose painting was feasible without violate normal tissue tolerance. Dose painting was not feasible in 2 patients owing to close vicinity of critical structures. |
| Hendrickson et al, 2011 | 10 | 18 FMISO | NA | 80–90 Gy | Planning study, mean 17% increase on TCP. | Biological model-based evaluation of simultaneous integrated boost with dose painting. |
| Toma-Dasu et al, 2012 | 7 | 18 FMISO | 4 regions based on P o 2 map. | Up to 121 Gy | Planning study, no TCP modeling. | An algorithm was developed to quantify radiosensitivity level of tumor based on the 18 FMISO map. Prescribed dose for dose painting was decided based on image-derived radiosensitivity and a predefined tumor control level. |
| Chang et al, 2013 | 8 | 18 FMISO | TMR >1.5 | 84 Gy | Planning study, mean 20% increase in TCP without changes in NTCP. | Plan evaluation through biological modeling. Dose painting based on 18 FMISO imaging is superior to uniform dose escalation in terms of both TCP and NTCP. |
| Henriques de Figueiredo et al, 2015 | 20 | 18 FMISO | Adaptive Bayesian segmentation | 79.8 Gy | Planning study, 18.1% increase in TCP, 4.6% increase in parotid NTCP. | Automatic local fuzzy Bayesian method to extract hypoxic volume from 18 FMISO map. |
| Servagi-Vernat et al, 2015 | 12 | FAZA | >Background mean + 3 SD | 86 | Planning study, no TCP modeling. | Dose escalation up to 86 Gy to hypoxic volumes did not modify the dose metrics on the surrounding normal tissues. |
Related posts:


Stay updated, free articles. Join our Telegram channel

Full access? Get Clinical Tree


