The interpretation approach should also be tailored to the population being imaged. Patients that are at high risk (≥20–25% lifetime risk) are still recommended to have a breast MRI using a standard full protocol. Breast MRI performed with an abbreviated protocol is geared toward women with dense breasts that are at average to intermediate risk for breast cancer. The threshold for recommending biopsy or a follow-up should be higher with an AB-MR than when interpreting MRIs for high-risk screening as the likelihood of malignancy is less.
7.2 Approach to Interpretation
7.2.1 Assessment of Image Quality
Similar to mammography, the first step in AB-MR image interpretation is to assess image quality ( ▶ Algorithm 1: Approach to MR Interpretation Readout (1)). This includes evaluating for adequate positioning, contrast administration, optimal technique, and motion artifact.
(1) The Society of Breast MRI Interpretation Guidelines suggest a standardized method for abbreviated breast MRI interpretation. These algorithms are not meant to dictate individual case management decisions. The ultimate decision regarding AB-MR interpretation must be made by the interpreting radiologist in light of all the circumstances presented in an individual examination.
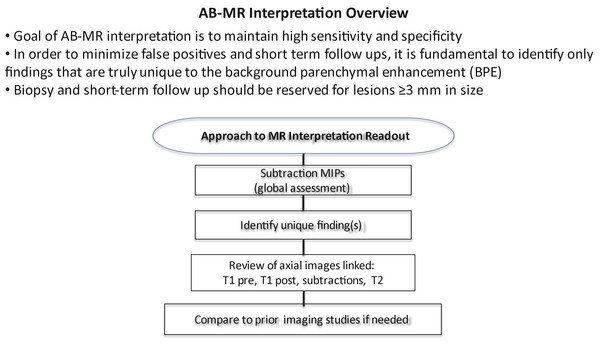
(Reproduced with permission of the SBMR.)
Fig. 7.1 Algorithm 1 Approach to magnetic resonance interpretation readout.
Proper positioning is essential in performing high-quality breast MRI. The MRI technologists should be trained in proper positioning. The patient should be positioned prone and the breast centered in a dedicated breast coil with the nipple in profile. Attention should be paid to include as much of the medial and axillary breast tissue as possible. Efforts should be made to ensure the patient is as comfortable as possible, which will reduce patient motion during the scan.
All breast MRI is based on the administration of intravenous gadolinium contrast in order to show increased relative enhancement of breast cancers relative to the normal parenchyma. Therefore, images should be assessed to confirm successful contrast administration. Contrast should be visible in the heart, blood vessels, and lymph nodes on the postcontrast images.
Fat saturation is highly recommended with the AB-MR protocol. Fat saturation should be uniform to avoid errors in interpretation. On fat-saturated T1-weighted images, the fat should appear gray and glandular tissue should maintain T1 signal. Glandular tissue that appears uniformly dark on the precontrast images suggests water suppression, which occurs if the suppression pulse is inadvertently applied to the water frequency peak and not the fat frequency peak.
Finally, postcontrast images and the subtraction series should be assessed for motion artifact. Many radiologists rely on the subtracted images (postcontrast series minus precontrast series), which display only areas of enhancement in the breast. The subtraction series are less distracting than the postcontrast series where high signal areas may be due to either true enhancement or inherent high T1 signal such as proteinaceous debris or hemorrhage ( ▶ Fig. 7.2). However, the quality of subtracted images is significantly affected by patient motion, causing the unenhanced and contrast-enhanced images to be misaligned, leading to misregistration on the subtraction images. Patient motion may result in areas of pseudoenhancement on subtraction images. Findings on the subtraction images suggesting motion artifact include pseudoenhancement of the skin, areas of signal dropout, or an overall hazy appearance of the glandular tissue. Most MRI computer-aided detection (CAD) systems perform some form of image registration correction to improve alignment of sequences affected by slight patient motion and reduce subtraction artifact. Registration correction is particularly important for breast MRI studies in which fat suppression is not performed and subtraction images are heavily relied upon. Significant patient motion cannot be overcome by MRI CAD registration correction algorithms and may lead to erroneous assessments if interpretation is based on the subtraction images. In cases with significant patient motion, interpretation should be based on the source images rather than the subtracted images.

Fig. 7.2 Utility of subtraction images for magnetic resonance imaging interpretation. Assessment for enhancement by comparing the axial precontrast (a) and postcontrast (b) fat-saturated T1-weighted images may be difficult. A focus of enhancement is more readily apparent when the two images are subtracted (c, arrow). Subtraction images facilitate initial identification for areas of enhancement. However, once identified, the postcontrast source images should be used to assess lesion morphology.
7.3 Global Assessment of Fibroglandular Tissue and Background Parenchymal Enhancement
The fifth edition of the Breast Imaging Reporting and Data System (BI-RADS) Atlas requires that each MR report contain a description of the amount of fibroglandular tissue present, as well as the level of the background parenchymal enhancement (BPE). 4
The amount of fibroglandular tissues (FGT) refers to the amount of nonfatty, noncystic normal breast parenchyma. FGT may best be assessed on a non–fat-saturated T1-weighted image if one is performed. Otherwise, the fat-saturated T1-weighted images may be used. Similar to mammography, the amount of FGT is classified within one of four categories: almost entirely fat, scattered fibroglandular tissue, heterogeneous fibroglandular tissue, and extreme fibroglandular tissue based on the relative proportion of fat and glandular tissue.
7.3.1 Background Parenchymal Enhancement
Once the amount of FGT has been assessed, the next step in MR interpretation is to assess the level of the BPE. BPE refers to the amount and degree of enhancement of the normal breast parenchyma. The BI-RADS recommends that each MRI report contains a description of the level of BPE. BPE is classified as minimal (<25% of glandular tissue demonstrating enhancement), mild (25 to <50% enhancement), moderate (50 to <75% enhancement), or marked (>75% enhancement). The level of BPE does not correlate with the amount of FGT. Therefore, a breast with extreme fibroglandular tissue may demonstrate minimal BPE and a breast composed of scattered fibroglandular tissue may have moderate or marked BPE. 5 Early studies have suggested that BPE is a marker of breast cancer risk, with the odds of breast cancer increasing with increasing levels of BPE. 6
Studies have also shown that BPE is hormonally influenced. BPE typically increases during the 4th week of the menstrual cycle and with hormone replacement therapy and lactational change. Similarly, factors known to decrease the degree of BPE include postmenopausal status, antiestrogen therapy (i.e., tamoxifen and aromatase inhibitors) and radiation therapy ( ▶ Fig. 7.3). 7, 8, 9, 10 BPE may also increase following the cessation of antihormonal therapy. In patients who discontinue tamoxifen, this increase in BPE sometimes is referred to as tamoxifen rebound. Therefore, it is important to know the patient’s history when interpreting breast MRI. Factors such as date of the last menstrual period, prior history of radiation therapy, and use of hormonal and antihormonal therapy should be captured at the time of the MRI to facilitate interpretation. Although it is often recommended the screening breast MRIs be performed during the days 7 to 10 of the menstrual cycle to minimize the degree of BPE, more recent studies have suggested that the degree of BPE does not impact the sensitivity or specificity of MR interpretation.
BPE usually demonstrates slow early initial enhancement, and progressive delayed enhancement kinetics. 11 The classic pattern of BPE is sometimes referred to as a “cortical pattern” where there is symmetric preferential enhancement of the peripheral breast parenchyma ( ▶ Fig. 7.3). However, BPE may also appear scattered foci of enhancement; this was previously referred to as a stippled pattern of nonmass enhancement (NME) in the first edition of the MRI BI-RADS lexicon ( ▶ Fig. 7.3). The term stippled was removed in the second edition of the lexicon as this pattern is now known to represent normal BPE and not a type of NME. 4 BPE may also present as asymmetric, regional, or focal enhancement. One of the most difficult aspects of breast MR interpretation is distinguishing variations of BPE from abnormal NME.
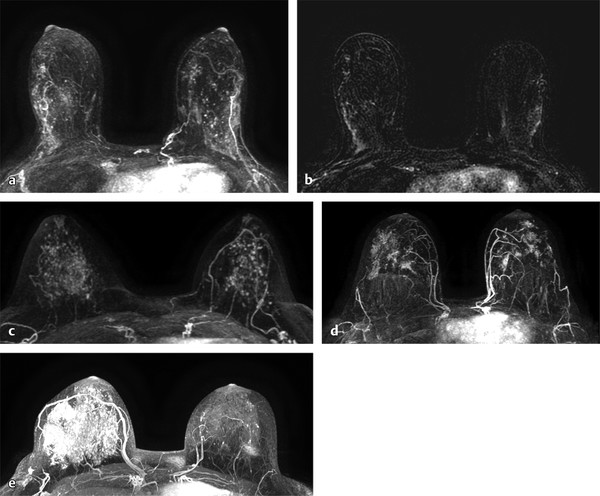
Fig. 7.3 Variations in normal background parenchymal enhancement (BPE). (a,b) Axial subtraction maximum intensity projection (MIP) images demonstrate the most classic appearance of BPE where there is preferential enhancement of the peripheral areas of the glandular tissue especially in the upper outer quadrants. This pattern is sometimes referred to as a cortical pattern of enhancement. (c) Axial subtraction MIP image demonstrates scattered similar-appearing foci, another common presentation of normal BPE. In the prior Breast Imaging Reporting and Data System (BI-RADS) lexicon, this pattern was described as stippled enhancement. (d) Axial subtraction MIP demonstrates bilateral scattered similar-appearing areas of focal NME, also representing a variation of BPE. (e) Axial subtraction MIP image demonstrates asymmetric BPE that is marked in the right breast and minimal in the left breast in this patient with a history of left lumpectomy and radiation therapy. Patient history is important when interpreting breast magnetic resonance imaging.
7.4 Identifying Unique Findings
Once the pattern of BPE has been assessed, the next step is to identify lesions that are unique or distinct from the BPE. The fundamental aspect of AB-MR interpretation is identifying findings that are truly unique to the patient’s overall enhancement pattern. Biopsy of findings that are not clearly unique should be minimized in order to maintain high specificity. MIPs and subtraction MIPs are typically generated from the precontrast and first postcontrast series. MIPs are generated using a processing method that projects the pixel with the highest signal onto a projection plane. The MIP and subtraction MIPS provide an overview of the breast, allowing the reader to have a general sense of the level of BPE and whether there is a truly unique finding distinct from the background enhancement that warrants further analysis ( ▶ Fig. 7.4). Lesion detection at breast MRI is based on identifying lesions with increased vascularity and therefore enhancement relative to normal breast tissue.
Once a unique finding has been identified on the subtraction MIPs and postcontrast images, the enhancing lesion can be classified into one of three general categories: focus, mass, and NME. Characterization of these lesions is based on a combination of lesion morphology on the postcontrast images and the internal signal characteristics on the precontrast T1- and T2-weighted images. While the subtraction series is useful in identifying areas of enhancement, the source images should be used for lesion characterization. Appropriate window and leveling of the postcontrast images are necessary to appreciate a lesion’s internal features. When evaluating the T2 signal intensity, it is important to define high T2 signal intensity as signal higher than that of the normal glandular tissue and equivalent to the signal of cyst fluid or normal lymph nodes. The window and level should be adjusted so that differences in signal intensity between fat, tissue, and fluid can be appreciated. If the window and level are set at too narrow of a range, then areas may falsely appear as being bright on T2 images.
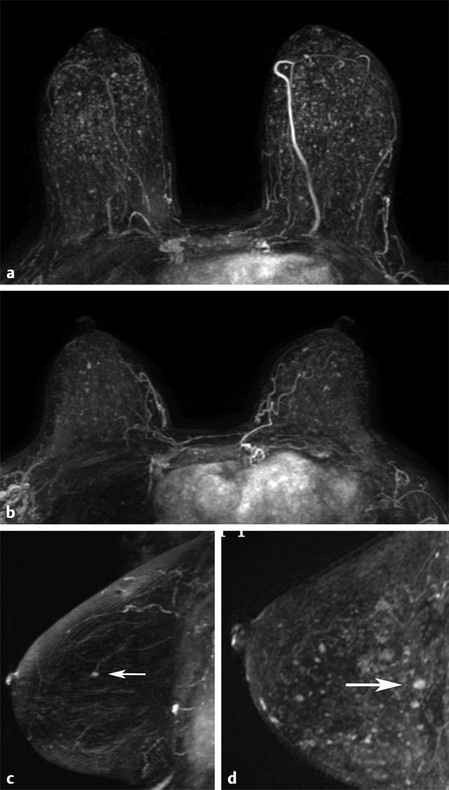
Fig. 7.4 Nonunique versus unique focus. (a,b) Axial subtraction maximum intensity projection (MIP) images demonstrates multiple bilateral similar-appearing foci consistent with normal background parenchymal enhancement. No unique focus is present. (c) Sagittal subtraction MIP image demonstrates a unique focus (arrow) in the central left breast. (d) Sagittal subtraction MIP image demonstrates multiple scattered foci. However, there is a unique focus in the posterior central breast (arrow) that is larger in size, enhances to a greater intensity, and is distinct from the background enhancement.
7.5 Focus
A focus is historically defined as a dot of enhancement less than 5 mm in size that is too small to further characterize in terms of its margins or internal enhancement pattern due to insufficient spatial resolution or volume averaging. With improved imaging protocols and spatial resolution, one is often able to distinguish between a small <5 mm mass and a true focus which is a tiny dot of enhancement. Biopsy should not be recommended for foci <3 mm in size on a baseline study due to the low probability of malignancy in lesions this size particularly in average- and intermediate-risk women.
Multiple scattered foci are almost always a manifestation of normal BPE. Multiple scattered similar-appearing foci are one appearance of BPE and require no additional analysis. In this situation, the AB-MR should be interpreted as normal.
In the past, due to their small size, low predictive value, and the inability to accurately characterize their morphology, a focus detected on breast MRI was routinely disregarded as being either benign or probably benign. Liberman et al found that the frequency of malignancy increased significantly with lesion size. In their cohort of 666 consecutive lesions identified on breast MR images alone, <1% of all cancers detected were due to a focus and only 3% of foci (lesions <5 mm in size) represented a malignancy. 12 Similarly, Eby et al reported that foci comprised 46% of BI-RADS 3 lesions and only 1 focus out of 168 was found on follow-up to represent malignancy. 13 Therefore, the majority of foci are benign. However, if a focus of enhancement is unique or distinct from the BPE, then further analysis of the lesion characteristics and morphology is required. Often the subtraction MIP images are useful in putting a potentially unique focus into the context of the normal BPE. If a focus is unique to the background pattern, then further analysis should be performed to determine whether it is benign, probably benign, or suspicious.
On a full MR protocol, enhancement kinetics are not routinely used to characterize a focus. Eby et al reported that the one focus that was found to represent a malignant lesion demonstrated washout kinetics. 13 However, Ha et al subsequently reported that of four malignant foci, two demonstrated benign progressive kinetics and two demonstrated washout kinetics. 14 Evaluation of a focus should be based on the internal composition and morphology and not on kinetics.
The first step in evaluating a focus is to confirm that it is truly a unique finding and distinct from the BPE. No other similar focus should be present elsewhere in that breast or in the contralateral breast. Once a focus is confirmed to be unique, the next step is to evaluate its morphology ( ▶ Algorithm 2 (2)). The subtraction images are useful in identifying unique findings such as a unique focus, but analysis of the morphology of any finding should always be made on the source (i.e., postcontrast T1-weighted) images and not on the subtraction series.
(2) The Society of Breast MRI Interpretation Guidelines suggest a standardized method for abbreviated breast MRI interpretation. These algorithms are not meant to dictate individual case management decisions. The ultimate decision regarding AB-MR interpretation must be made by the interpreting radiologist in light of all the circumstances presented in an individual examination.
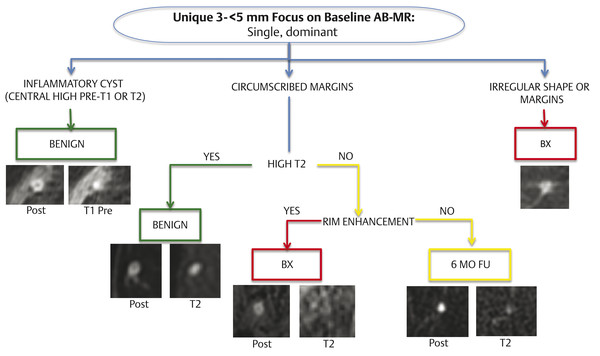
Algorithm 2 Interpretation guidelines for a unique focus on baseline abbreviated breast magnetic resonance imaging (AB-MR). (Reproduced with permission of the SBMR.)
If there is a unique focus, the first step in evaluation is to determine whether it represents a small inflammatory cyst, a unique focus with circumscribed margins, or a unique focus with noncircumscribed margins.
Small inflammatory cysts/cysts with pericystic inflammation have high signal on either the precontrast T1 or the T2 images that match the size and shape of the central dark area on the postcontrast images ( ▶ Fig. 7.5). Inflammatory cysts are benign and routine follow-up should be recommended.
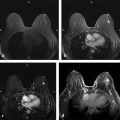
Any unique focus with an irregular shape or margin requires biopsy ( ▶ Fig. 7.6). However, as previously mentioned, biopsy should be reserved for a focus ≥3 mm in size on a baseline AB-MR.
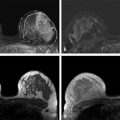
A unique focus with a circumscribed margin should then be evaluated to determine if there is a high T2 signal intensity correlate. The high T2 signal intensity correlate should also be circumscribed and match the size and shape of the focus. A unique focus on a baseline MRI that is a smooth circumscribed dot of enhancement with a smooth high T2 signal intensity correlate is benign ( ▶ Fig. 7.7). This characterization of such a focus as benign uses a combination of benign morphology (circumscribed dot of enhancement) and benign intrinsic characteristics (high signal on T2-weighted images).
If there is a unique ≥3 mm focus with circumscribed margins and no high T2 signal correlate on a baseline AB-MR, the focus should be evaluated to determine whether rim enhancement is present. Biopsy should be recommended for a circumscribed unique ≥3 mm circumscribed, low T2 rim-enhancing focus ( ▶ Fig. 7.8). The combination of low T2 signal intensity and the presence of rim enhancement are suspicious enough to warrant biopsy.
▶ Algorithm 2 applies to a unique ≥3 mm focus on a baseline AB-MR. If comparison studies are available, biopsy should be recommended for any discrete unique focus that is new or increasing in size. In addition, the threshold for biopsy of a focus in a patient with a history of lumpectomy and radiation therapy should be lowered especially if that focus is in the treated irradiated breast.
In some cases, there is not a unique single focus but multiple foci. As discussed earlier, multiple bilateral scattered similar-appearing foci represent normal BPE and do not require additional analysis or workup. However, there may be a group of foci that are more concentrated or grouped in one area compared to the background. If these foci are in a linear distribution, then biopsy should be recommended, as this may represent an early area of clumped or linear NME. If this group of foci is not in a linear distribution, then a recommendation for a 6-month follow-up MRI would be appropriate.
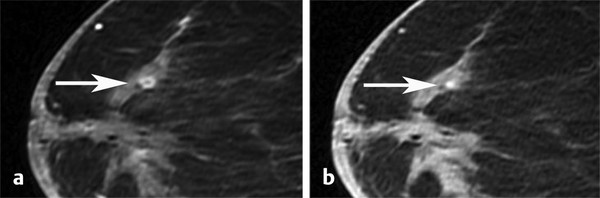
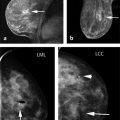
Fig. 7.5 Examples of small inflammatory cyst. Axial postcontrast fat-saturated T1-weighted image demonstrates a rim-enhancing focus (a, arrow) with a corresponding central dot of high signal intensity on the precontrast images (b, arrow) consistent with a proteinaceous cyst.
Related posts:
 Current Clinical Evidence on Abbreviated Breast Magnetic Resonance Imaging
 Abbreviated Breast Magnetic Resonance Imaging Protocols and Clinical Implementation
 Introduction to Abbreviated Breast Magnetic Imaging
 Techniques for Performing Abbreviated Breast Magnetic Resonance Imaging
 Technical Aspects of Abbreviated Breast Magnetic Resonance Imaging: The Original Approach
 Magnetic Resonance Imaging-Guided Biopsy Techniques
Stay updated, free articles. Join our Telegram channel

Full access? Get Clinical Tree


