Introduction to Medical Imaging
Radiological imaging of the intact human body requires some form of energy to enter the body, interact, and then deliver a signal to a detector, typically located outside of the body. While visible light is used in dermatology and other disciplines of medicine for observation, the primary role of radiological imaging is to produce images, which depict anatomy or physiological function well below the skin surface. In diagnostic radiology, the electromagnetic spectrum is used extensively for medical imaging, including x-rays in mammography, radiography, fluoroscopy, and computed tomography (CT); radiofrequency (RF) waves are used in magnetic resonance imaging (MRI); and γ rays in nuclear medicine. Mechanical energy from a rapidly vibrating transducer, in the form of high-frequency sound waves, is used in ultrasound imaging.
Except for nuclear medicine, all medical imaging requires that the energy used to penetrate the body’s tissues also interacts with those tissues. If energy were to pass through the body and not experience some type of interaction (e.g., absorption or scattering), then the detected energy would not contain any useful information regarding the internal anatomy, and thus it would not be possible to construct an image of the anatomy using that information. In nuclear medicine imaging, radioactive substances are injected or ingested, and it is the physiologically mediated biodistribution of the agent that gives rise to the information in the images.
The diagnostic utility of a medical image relates both to the technical quality of the image and to the conditions of its acquisition. In most cases, the image quality that is obtained from medical imaging devices involves compromise—better x-ray images can be made when the radiation dose to the patient is high, better magnetic resonance images can be made when the image acquisition time is long, and better ultrasound images result when the ultrasound power levels are high. However, patient safety and comfort must be considered when acquiring medical images; thus, excessive patient dose in the pursuit of a perfect image is not acceptable. This means that the power and energy levels used to make medical images require a compromise between patient safety and image quality.
1.1 THE MODALITIES
Different types of medical images are produced by varying the types of energies used to interrogate the patient, the acquisition geometry, and the scanning methods used. The different modes of making images in radiology are referred to as modalities. Each modality has its own niche in diagnostic and interventional radiology. One crucial aspect of medical imaging is related to how long it takes to produce the image(s). Because of patient motion, short acquisition time frames are desirable. However, the acquisition time of some imaging procedures are fundamentally limited by physics. For example, in nuclear medicine, radioactive isotopes are injected into the patient and the imaging system captures the radiation that is emitted from
radioisotope decay. Because specific radioisotopes have decay constants, which are long, the scan time to produce the images is necessarily long—for example 10 minutes (min). Because the patient has involuntary motion of the lung, heart, and esophagus over this time frame, the ability to achieve high resolution will be compromised simply due to patient motion. Thus, there is a general trend that imaging modalities that require minutes for acquisition have lower resolution than modalities that can scan the patient in a few seconds.
radioisotope decay. Because specific radioisotopes have decay constants, which are long, the scan time to produce the images is necessarily long—for example 10 minutes (min). Because the patient has involuntary motion of the lung, heart, and esophagus over this time frame, the ability to achieve high resolution will be compromised simply due to patient motion. Thus, there is a general trend that imaging modalities that require minutes for acquisition have lower resolution than modalities that can scan the patient in a few seconds.
1.1.1 Radiography
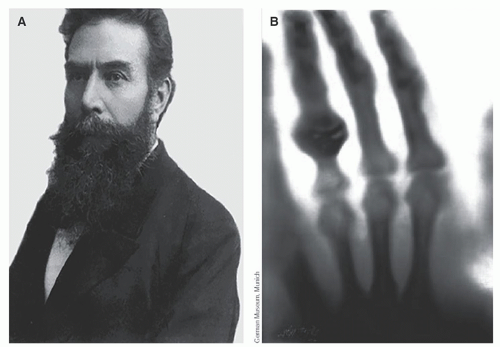
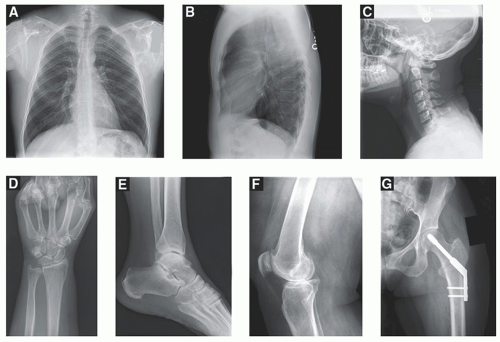
Radiography was the first medical imaging technology, made possible when the physicist Wilhelm Roentgen discovered x-rays on November 8, 1895. Roentgen also made the first radiographic images of human anatomy (Fig. 1-1). Radiography defined the field of radiology, which ultimately gave rise to radiologists, physicians who specialize in the interpretation of medical images. Radiography is performed with an x-ray source on one side of the patient and an x-ray detector on the other side. A short-duration pulse of x-rays is emitted by the x-ray tube, a large fraction of the x-ray beam interacts in the patient, and the remaining primary x-rays that pass through the patient reach the detector, forming a radiographic image (Fig. 1-2). The spatially homogeneous distribution of x-rays that enters the patient is modified by interactions
in the patient—both scattering and absorption events, resulting in a heterogeneous distribution of x-rays that emerges from the patient, which produces the subject contrast that is recorded by the radiographic image. Attenuation is a term that includes both absorption and scattering, and the attenuation properties of the anatomic structures inside the patient such as bone, liver, and lung are very different. These different attenuation levels provide the contrast to produce a two-dimensional image of the patient’s anatomy, encoded into the radiograph. The radiographic detector of choice for a century was the screen-film cassette, but digital detector systems have now replaced screen-film radiography in most regions of the world.
in the patient—both scattering and absorption events, resulting in a heterogeneous distribution of x-rays that emerges from the patient, which produces the subject contrast that is recorded by the radiographic image. Attenuation is a term that includes both absorption and scattering, and the attenuation properties of the anatomic structures inside the patient such as bone, liver, and lung are very different. These different attenuation levels provide the contrast to produce a two-dimensional image of the patient’s anatomy, encoded into the radiograph. The radiographic detector of choice for a century was the screen-film cassette, but digital detector systems have now replaced screen-film radiography in most regions of the world.
1.1.2 Fluoroscopy
Fluoroscopy systems provide image sequences over time resulting in a real-time x-ray movie of the patient. Fluoroscopic systems use x-ray detector systems capable of producing images in rapid temporal sequence, typically up to 30 frames per second. The detectors are also very sensitive to low levels of radiation given that so many images are used over the course of a fluoroscopic procedure—for example, 10 min of fluoroscopy results in 18,000 images at 30 frames per second. Fluoroscopy is used for positioning intravascular catheters, visualizing contrast agents in the GI tract, and image-guided intervention including arterial stenting, placement of drainage catheters, and image-guided biopsy procedures. Fluoroscopy is used when real-time feedback is required for the medical task. While most fluoroscopy images are not recorded, recorded sequences of fluoroscopy images are used for the assessment of various motion studies, such as swallowing studies to assess peristaltic motion of the esophagus, assessment of joint movement of the knee or elbow, and several other applications.
1.1.3 Mammography
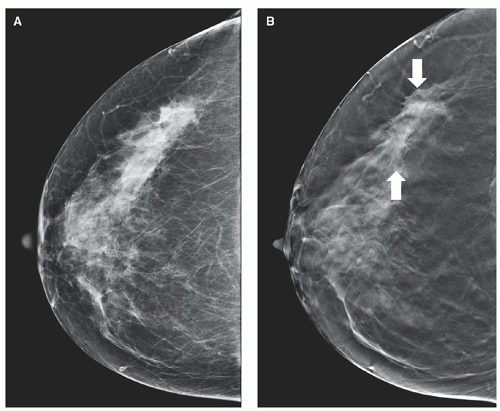
Mammography is radiography of the breast. To increase the relatively low subject contrast in breast tissues, mammography uses much lower x-ray energies than general purpose radiography, and consequently the x-ray and detector systems are designed specifically for breast imaging. A conventional screening mammogram of a compressed breast is shown in Figure 1-3A. Screening mammography is used to routinely evaluate asymptomatic women for breast cancer. Diagnostic mammography is used to facilitate the diagnosis of women with suspected breast pathology, often following a positive screening mammogram or in women with a palpable lesion.
Most digital mammography systems are capable of tomosynthesis, where the x-ray tube moves in an arc over a limited range of angles around the breast. Nine to 25 images acquired over an angular range of 15° to 50° constitute the raw data for tomosynthesis. The projection images are reconstructed in 1-mm increments through the compressed breast to yield the tomosynthesis image data set. The tomosynthesis images are parallel to the plane of the detector and reduce the superimposition of anatomy above and below the focal plane. Scrolling through the tomosynthesis images can assist the radiologist in finding patterns correlated with cancer that are otherwise hidden, as shown in Figure 1-3B. A synthetic projection mammogram can be generated by rearranging and combining the tomosynthesis data set to eliminate the need to acquire a conventional projection mammogram,
thereby reducing the overall radiation dose of the exam. This is becoming the standard of practice at many clinics.
thereby reducing the overall radiation dose of the exam. This is becoming the standard of practice at many clinics.
1.1.4 Computed Tomography
CT changed the practice of medicine 50 years ago by essentially eliminating the use of exploratory surgery, which was widely used as a diagnostic procedure prior to the 1970s.
CT images are produced by acquiring numerous (˜1,000) x-ray projection images over a large angular swath (typically 360°) by rotating the x-ray tube and detector around the patient. A CT detector array, opposite the x-ray source, collects the transmission projection data, and these data are synthesized by a computer into tomographic images of the patient using a reconstruction algorithm. CT results in high resolution thin-slice images of individual slabs of tissue along the length of the patient. CT has the ability to display three-dimensional (3D) images of the anatomy of interest, eliminating the superposition of anatomical structures, which occurs in radiography. CT images depict detailed anatomy to the physician unobstructed by normal anatomical structures, which can obscure image interpretation. While whole body CT scanners generate trans-axial images as the native image reconstruction, the thin-slice transaxial image data set can be reconfigured to produce high resolution coronal, sagittal, and multi-planar images as well.
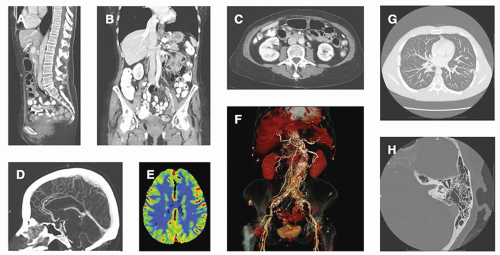
Typical whole-body CT scanners can acquire ˜0.50-mm-thick tomographic images over the desired field of view along the length of the patient. For example, a 500-mm length of the patient (1,000 × 0.5 mm images) can be imaged in less than 4 seconds (s) (40 mm wide detector array, helical acquisition with pitch = 1.0, and 0.30-s gantry rotation time). The CT image data set can reveal the presence of cancer, ruptured disks, subdural hematomas, aneurysms, and a huge assortment of other pathologies (Fig. 1-4). The CT volume data set is essentially isotropic, and coronal and sagittal CT images are routinely produced in many protocols, in addition to the traditional axial images in CT. Newly introduced high-resolution CT scanners extend the typical CT image matrix of 512 × 512 with ˜0.7 mm pixel dimensions (in the axial plane) in the thorax to a 1,024 × 1,024 with 0.25 mm pixel dimensions, or even a 2,048 × 2,048 image matrix with 0.15 mm pixel dimensions (Fig. 1-4). The pixel dimensions along the length of the patient (the z dimension in coronal and sagittal images) can be adjusted from 0.5 to 5 mm in conventional CT scanners, and the high-resolution system is capable of a 0.25 mm section thickness.
Compared to standard CT image dimensions, as voxel dimensions get smaller at the same radiation dose levels, the images will become noisier—hence there is always a compromise between image noise, radiation dose, and spatial resolution. Iterative reconstruction techniques have been successful at reducing image noise using mathematical techniques, and new artificial intelligence techniques are making inroads in producing high resolution images with manageable noise levels at acceptable radiation dose levels.
There are many different acquisition modes available on modern CT scanners, including dual-energy imaging, axial and helical imaging, perfusion imaging, and prospectively gated cardiac CT. While CT is routinely used for anatomic imaging, the intravenous injection of iodinated contrast allows functional assessment of organ vascularity, perfusion, and physiological status. Because of the speed of CT acquisition and widespread availability of CT in many countries, CT has replaced radiography for many clinical indications. This trend continues. For example, intravenous pyelography (contrast radiography of the kidney) has largely been replaced by renal CT. While the radiation dose is higher, the diagnostic accuracy is improved considerably.
1.1.5 Cone Beam Computed Tomography
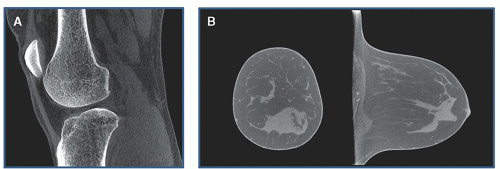
The development of large field of view flat-panel x-ray detectors has led to the development of cone beam CT (CBCT) scanners, where the wider (˜300 mm) flat panel detector is used in the design of the scanner instead of the relatively narrow (˜40 mm) CT detector arrays of conventional CT scanners. The wide panel allows the entire CT image dataset to be acquired in one rotation of the gantry. CBCT systems are used in several specialty imaging applications, including dental imaging, orthopedic imaging (e.g., knees), image-guided radiation therapy, breast imaging, and CT in angiography suites. CBCT has the advantage of being less expensive than whole body CT systems, as they are designed for niche imaging applications (Fig. 1-5). While the image quality suffers from an increase in scattered radiation to the detector and from so-called cone beam artifacts, CBCT systems often have better three-dimensional spatial resolution than most whole-body CT scanners.
1.1.6 Magnetic Resonance Imaging
MRI scanners use magnetic fields that are about 10,000 to 60,000 times stronger than the earth’s magnetic field, and these fields are generated in a large cylindrical enclosure. For most imaging studies, MRI utilizes the nuclear magnetic resonance (NMR) properties of the proton—that is, the nucleus of the hydrogen atom, which is very abundant in biological tissues (each cubic millimeter of tissue contains about 1018 protons). The proton has an extremely small magnetic moment, and when placed in a magnetic field the magnetic moment precesses about its axis at an angular frequency proportional to the field strength. For a 3 T field, the precession frequency is about 128 million cycles per second (megahertz—MHz). Thermal energy in the tissues causes protons from unbound water to align against (antiparallel) or along (parallel) the magnetic field direction, with a slight excess of about 2-3 protons per million aligned in the parallel direction (i.e., 499,999↓ to 500,002↑). Despite this small difference, a net magnetic moment is observable simply due to the enormous numbers of protons present in even a small sample of tissue.
Stay updated, free articles. Join our Telegram channel

Full access? Get Clinical Tree


