Fig. 1
Fundamental morphologic alterations of the kidney in the elderly patient. Grayscale ultrasound (US), longitudinal scan. Reduction of renal cortical thickness and increase of the renal sinus fatty tissue, in particular evident at the renal hilum
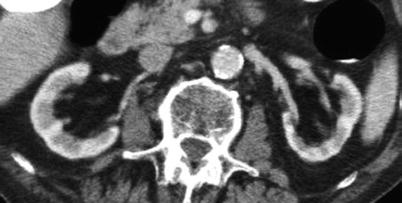
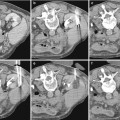
Fig. 2
Kidney in a 80-years old patient. Contrast-enhanced CT, transverse plane. Reduction of renal cortical thickness and increase of the renal sinus fatty tissue at the renal hilum
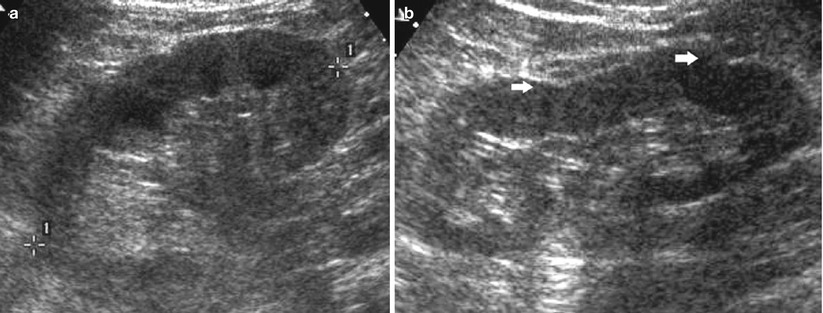
Fig. 3
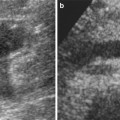
(a, b) A 66-year-old patient with normal creatinine levels. Longitudinal grayscale US scan of the right (a) and of the left kidney (b). Increased corticomedullary differentiation due to the increased echogenicity of the renal cortex (a, b) with clear marginal irregularities (arrows) in the left kidney
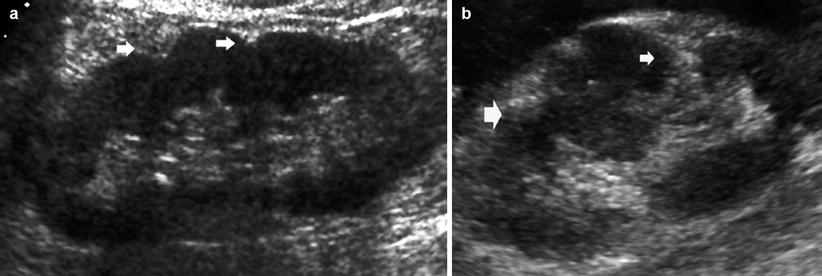
Fig. 4
(a, b) Different grades of renal margin irregularities. Longitudinal grayscale US scan. (a) Reduction of the renal parenchymal thickness with renal contour irregularities (arrows) and increased corticomedullary differentiation. (b) Diffuse renal margin irregularities also with evidence of renal parenchymal scars (arrows) due to previous regional infarctions. The interposed renal parenchyma presents a pseudolobar appearance
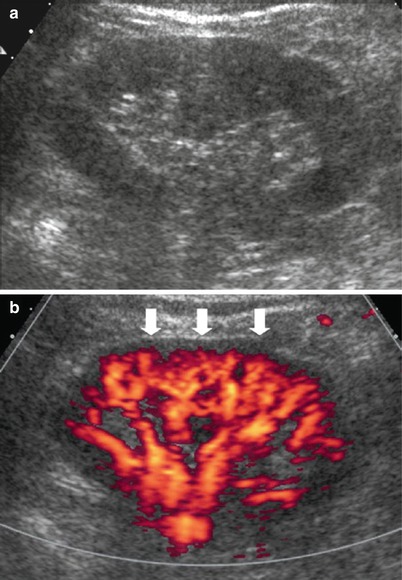
Fig. 5
(a, b) Fundamental morphologic alterations of the kidney in the elderly patient. (a) Grayscale US. Increased echogenicity of the renal parenchyma with reduced corticomedullary differentiation. (b) Power Doppler US. Reduced renal parenchymal vascularization at the level of the subcapsular region (arrows)
On contrast-enhanced CT a typical diffuse irregularity of margins is identified (Fig. 6), often associated to a reduced cortical thickness or to renal parenchymal scarring due to previous renal infarcts (Fig. 7). Renal parenchymal retention cysts (Fig. 8) and renal sinus cysts (Fig. 9) are frequently identified and probably develop because of inflammatory reactions and infections that occur in the distal tract of the tubuli (Pozzi Mucelli et al. 2008). On CT urography these fundamental morphologic changes are frequently associated with calyceal alterations with narrowing of the first-order calyces and multiple cysts of the renal sinus (Fig. 10).
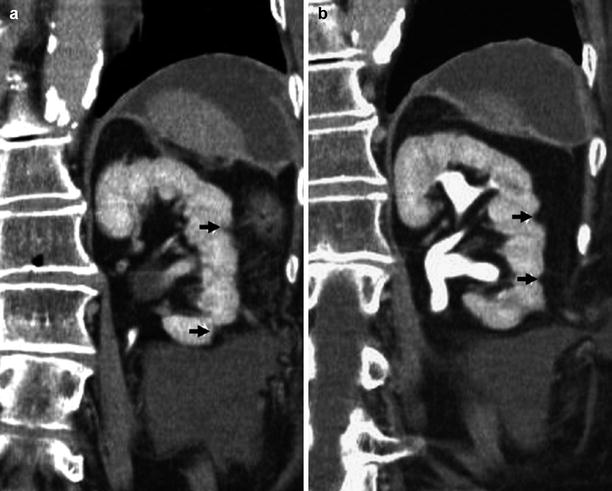
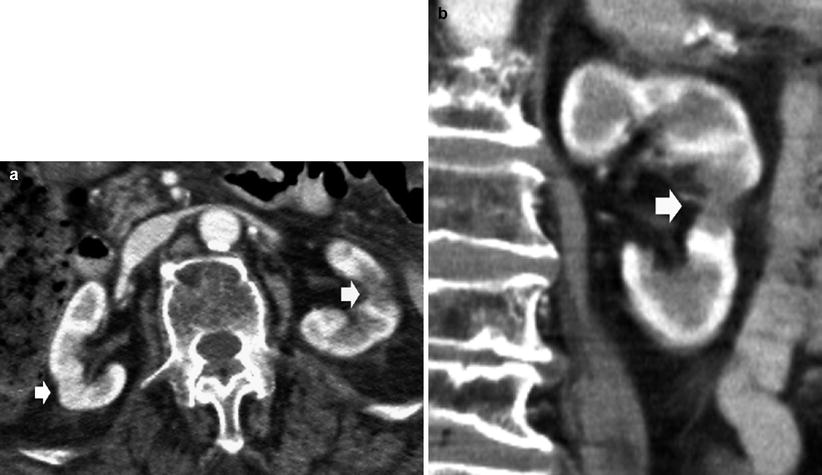
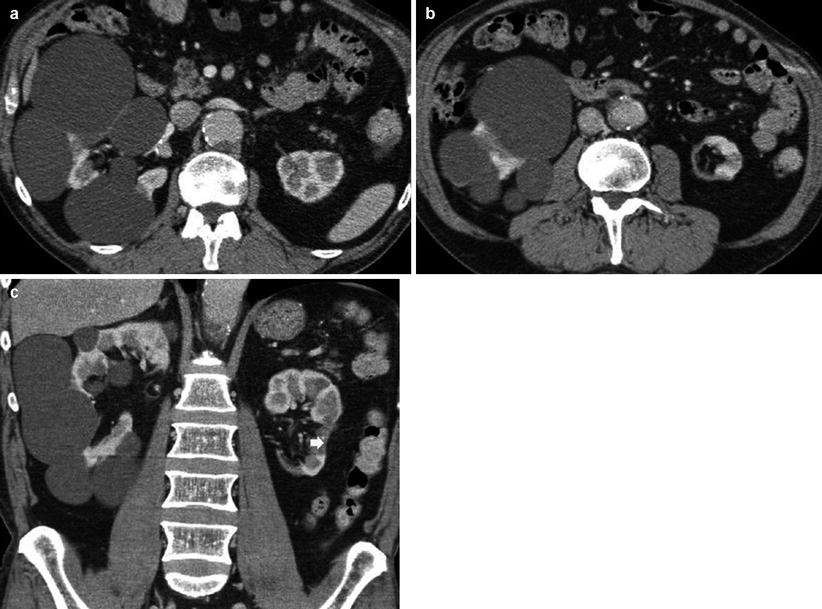
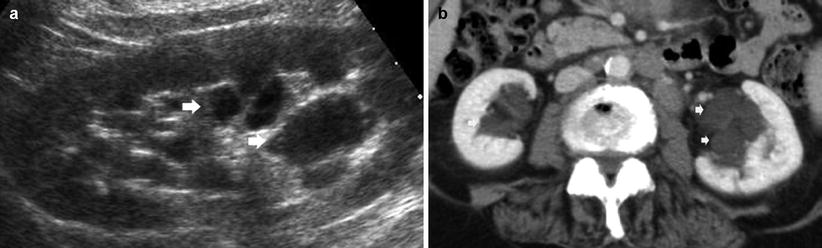
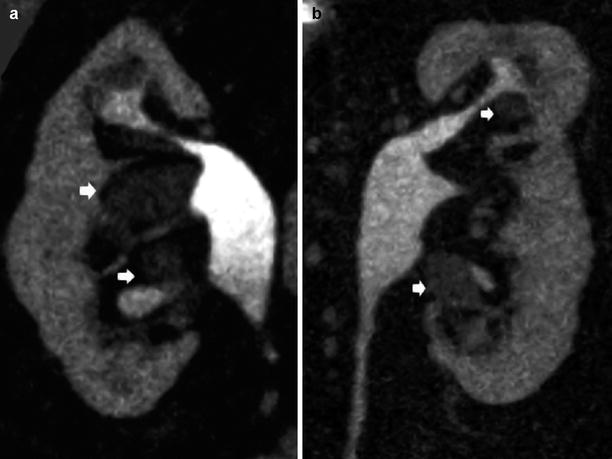
Fig. 6
(a, b) Fundamental morphologic alterations of the kidney in the elderly patient. Contrast-enhanced CT, excretory phase. Coronal reformation. Diffuse reduction of the renal cortical thickness with overt focal irregularities of renal margins (arrows)
Fig. 7
(a, b) Multiple renal scarring due to previous vascular infarcts in the kidneys of an 80-year-old patient. Contrast-enhanced CT, corticomedullary phase. (a) Transverse plane. Both kidneys present irregular margins due to underlying nephrosclerosis and overt renal parenchymal scarring due to previous renal infarctions (arrows). (b) Coronal reformation. The left kidney presents overt parenchymal scarring (arrow)
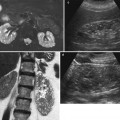
Fig. 8
(a–c) Fundamental morphologic alterations of the kidney in the elderly patient. Contrast-enhanced CT. (a, b) Multiple renal cortical cysts are evident on the right kidney with a reduced cortical thickness of the left kidney. (c) The left kidney presents also a cortical scar (arrow) due to a previous vascular infarct
Fig. 9
(a, b) Fundamental morphologic alterations of the kidney in the elderly patient. (a) Grayscale US. Longitudinal scan of the left kidney. Multiple cysts of renal sinus (arrows). (b) Contrast-enhanced CT, nephrographic phase. Multiple renal sinus cysts (arrows) are evident on both kidneys
Fig. 10
(a, b) Fundamental morphologic alterations of the kidney in the elderly patient. Contrast-enhanced CT, excretory phase. Coronal reformation. Multiple cysts of renal sinus (arrows) with narrowing of the renal calyces, associated to irregular margins due to underlying nephrosclerosis and previous renal infarctions
2 Nephrosclerosis
Nephrosclerosis is the term used for the renal pathology associated with sclerosis of renal arterioles and small arteries due to medial and intimal thickening as a response to hemodynamic changes, aging, genetic defects, or some combination of these and to hyaline deposition in arterioles (Alpers 2005). The resultant effect is focal ischemia of the renal parenchyma supplied by vessels with thickened walls and consequent narrowed lumen (Alpers 2005). Some degree of nephrosclerosis is present at autopsy with increasing age preceding or in the absence of hypertension. Hypertension and diabetes mellitus increase the incidence and severity of the lesions. In nephrosclerosis, there is a general hardening of the kidney due to overgrowth and contraction of interstitial connective tissue. Nephrosclerosis may be compared to the arteriosclerosis of the small renal arteries, and it is due to renovascular disease, mainly chronic hypertension. The renal vascular alterations of hypertension depend on the severity of the blood pressure elevation and whether the process accelerates to malignant hypertension. Arteriolosclerosis of small cortical renal arteries, interlobar, arcuate, and interlobular, is a common feature of the kidney in patients with systemic arterial hypertension and particularly in elderly patients (Quaia and Bertolotto 2002).
In nephroangiosclerosis, both kidneys are usually symmetrically reduced in their diameters with cortical scars. Cortical echogenicity is increased with increased or reduced corticomedullary differentiation according to the grade of echogenicity of the renal medulla. Color and power Doppler US reveals nonspecific reduction of vascularization (Fig. 11). If compared to the younger population, renal RIs are typically increased (>0.7 and frequently around 0.8) (Figs. 12 and 13). Renal perforating arteries and veins (Bertolotto et al. 2000) are much more visible in the kidneys of nephroangiosclerotic patients in comparison with normal subjects, since they enlarge in nephroangiosclerosis and present normally directed flows from the kidney toward the renal capsule.
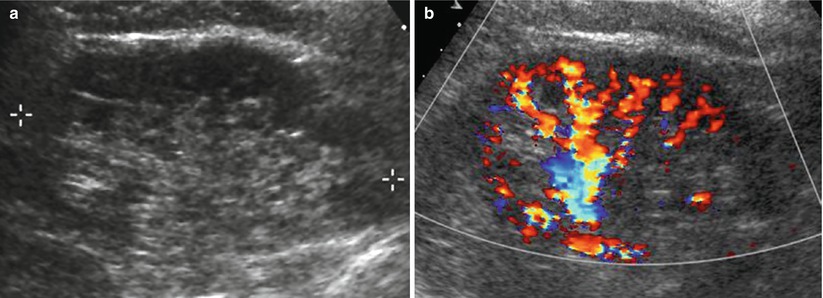
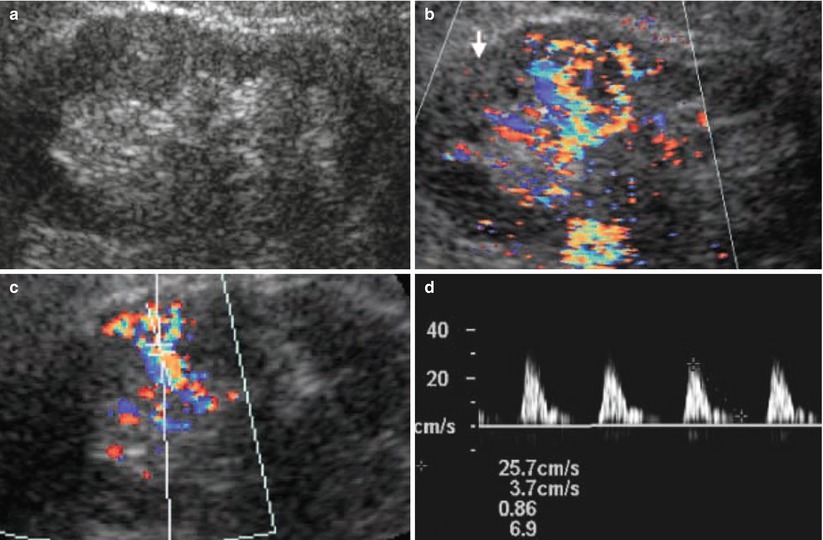
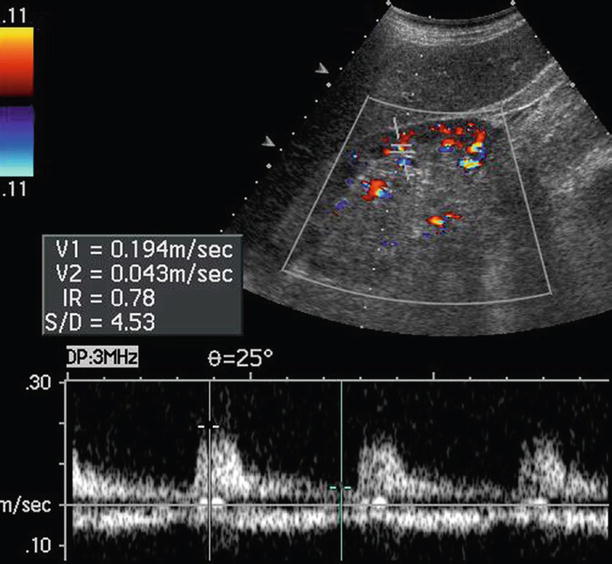
Fig. 11
(a, b) Fundamental morphologic alterations of the kidney in the elderly patient. Renal morphologic changes due to nephrosclerosis. (a) Grayscale US, longitudinal scan. Reduction of renal cortical thickness with diffuse irregularities of renal margins. (b) Color Doppler. Reduction of renal cortical vascularization at color Doppler analysis due to nephrosclerosis
Fig. 12
(a–d) Fundamental morphologic alterations of the kidney in the elderly patient. Reduction of the renal parenchymal thickness, margin irregularities, and increased corticomedullary differentiation are evident on grayscale US (a). (b) Color Doppler US, longitudinal scan. Reduction of renal cortical vascularization. (c, d) Doppler interrogation of the intrarenal segmental arteries with increased arterial resistive indices
Fig. 13
Fundamental morphologic alterations of the kidney in the elderly patient. Color Doppler US with Doppler interrogation of renal segmental artery. Increased arterial resistive index measured at the level of one renal segmental artery of the lower renal pole
3 Renovascular Disease
The geriatric population is affected by many vascular diseases, since the incidence of atherosclerosis increases with age. Generally, the imaging of vascular diseases in the elderly is complicated by the presence of coexisting diseases, while the image quality is degraded due to obesity and limited patient compliance. Renovascular hypertension accounts for 0.5–5 % of patients who have hypertension. The renovascular disease may manifest as asymptomatic renal artery stenosis, intractable or uncontrollable hypertension requiring multiple medications, or ischemic nephropathy with progressive loss of renal function (Kalva and Mueller 2008). In young patients, the most common cause of renovascular hypertension is fibromuscular dysplasia, while in the elderly the most common cause is atherosclerosis mainly localized in the ostial or proximal tract of the renal artery.
Color Doppler US, helical computed tomographic (CT) angiography, angiotensin converting enzyme (ACE) inhibitor scintigraphy with captopril, and magnetic resonance (MR) angiography have been assessed in the diagnosis of renal artery stenosis (see chapter “Renal vascular abnormalities”). Digital subtraction angiography remains the gold standard for the diagnosis of renal artery stenosis, and it is part of any endovascular intervention. Contrast-enhanced CT and MR imaging angiographic techniques have improved in their detection of renal artery stenosis, and MR angiography is generally considered more sensitive for renal artery stenosis than US (Zhang and Prince 2004). Anyway, kidney disease limits the use of contrast agents during CT and MR imaging examinations, and this is particularly true in elderly patients. Moreover, coexistent cardiopulmonary diseases, such as congestive heart failure, arrhythmias, and chronic obstructive lung diseases, limit the ability of the elderly to hold breath during image acquisition (Kalva and Mueller 2008). Additionally, the cardiopulmonary diseases may preclude the use of some of the imaging modalities because of the inherent contraindications, such as pacemakers in MR examinations. Consequently, color Doppler US is the principal imaging technique employed in the elderly for renovascular disease diagnosis.
The velocitometric analysis of Doppler trace derived from renal arteries is of primary importance to identify renal artery stenosis. Direct Doppler criteria have been proposed for the detection of renal artery stenosis, including an increased peak systolic velocity (>150–180 cm/s) (Fig. 14) and end-diastolic velocity at the level of the stenosis (Correas et al. 1999; Grant and Melany 2001), a poststenotic flow disturbance resulting in spectral broadening and reversed flow (Correas et al. 1999), an increased ratio (≥3.5) of peak systolic velocity in the renal artery and aorta (renal-aortic ratio), and the presence of turbulence within the renal artery (Desberg et al. 1990; Helenon et al. 1995). Although this technique is easy to perform, its accuracy is questionable because the lack of an early systolic peak has a low sensitivity for moderate stenoses, and the waveform is dependent on the maintenance of vessel compliance, which limits its effectiveness in elderly patients and patients with atherosclerosis (Bude et al. 1994; Bude and Rubin 1995).
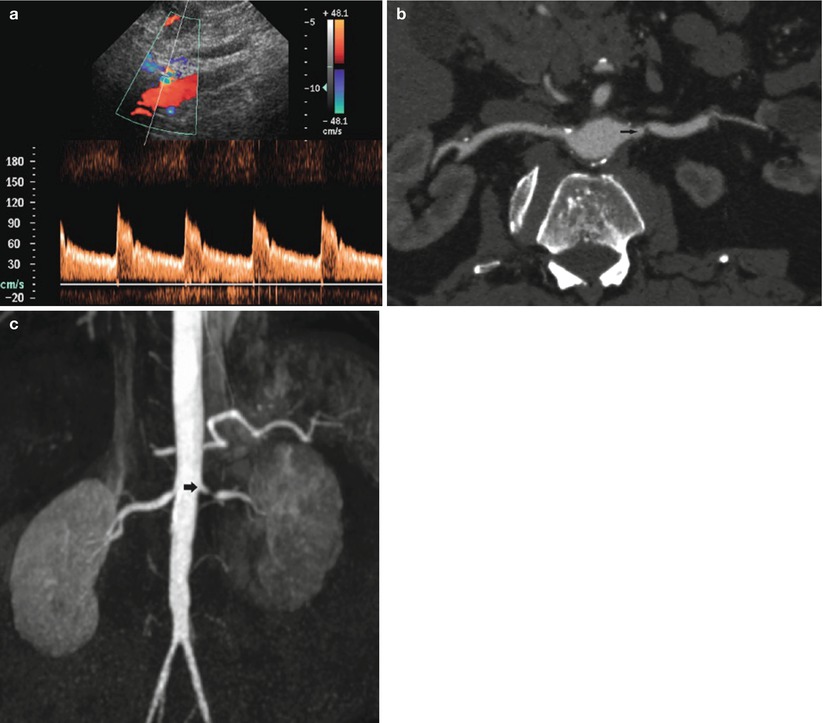
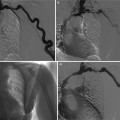
Fig. 14
Renal artery stenosis in an 80-year-old male patient. Worsening renal function was precipitated by the treatment of hypertension with angiotensin converting enzyme (ACE) inhibitors. (a) Doppler interrogation reveals aliasing at the level of the ostial tract of the left renal artery with spectral broadening of the Doppler trace. (b) CT angiography (CTA). Stenosis of the left renal artery is confirmed (arrow). (c) MR angiography. 3D maximum intensity projection. Stenosis of the left renal artery is confirmed (arrow)
Downstream hemodynamic repercussions of renal artery stenosis in the distal intrarenal arterial bed may be identified by Doppler US and may provide an indirect diagnosis of renal artery stenosis. Numerous parameters are still debated (Correas et al. 1999), except in cases of critical stenosis (>80 %). In fact, even though intraparenchymal arterial examination is technically easier than the evaluation of the main renal artery, Doppler US findings in interlobar-arcuate renal cortical arteries are less reliable than Doppler US findings on stenotic site, since downstream repercussions are absent in 20 % of principal renal artery tight stenosis (>80 %), for a well-developed collateral blood supply. In the presence of a hemodynamically significant renal artery stenosis, the Doppler trace reveals a “tardus et parvus” profile at poststenotic or intrarenal tract of the renal artery (Stavros et al. 1992; Bude et al. 1994), consisting of an increased time to reach the peak of the trace (acceleration time >70 ms) with loss of early systolic peak and decreased acceleration index (<300 cm/s2). Poststenotic pulsus tardus is caused by the compliance of the poststenotic vessel wall in conjunction with the stenosis, which produces the tardus effect by damping the high-frequency components of the arterial waveform. This information allows to identify those conditions, which may produce false-positive or false-negative results when the tardus phenomenon is used to predict hemodynamically significant upstream stenosis (Bude et al. 1994). This is the case of the loss of vascular compliance in severe diffuse atherosclerosis of elderly patients, which may prevent the tardus-parvus phenomenon decreasing the sensitivity of color Doppler US (Grant and Melany 2001). Other findings that may be observed in the intraparenchymal arteries in the presence of renal artery stenosis are decreased resistive indices in interlobar-arcuate renal cortical arteries with increased side difference higher than 10 % (Correas et al. 1999).
Contrast-enhanced CT angiography (CTA) and MR imaging angiography (MRA) are also very sensitive and specific for the demonstration of renal artery occlusion. Additional views provided by CTA allow for display of the renal arteries in multiple planes and projections, often necessary for the depiction of stenosis (Fig. 14). Calcified plaques limit the CT evaluation of luminal narrowing. In particular, in cases with extensive calcification, as is frequently observed in elderly patients, renal artery stenosis can be obscured by MIP technique and requires careful evaluation with the volume-rendered images. CTA can also depict secondary signs of renal artery stenosis, including poststenotic dilatation and renal parenchymal changes of atrophy and decreased cortical enhancement. CTA is also very helpful in the posttreatment evaluation of renal stent grafts and can usually delineate between the highly attenuating graft material and the intraluminal contrast material.
MRA is well suited for the evaluation of renal artery stenosis in the elderly. Calcified atheromatous plaques do not hamper the assessment of the arterial lumen. MR angiography provides information about the size of the kidney, collateral vessels, and poststenotic dilatation. Contrast-enhanced axial MR imaging can directly show the narrowing of the stenosis, and reformatted multiplanar imaging is often used. Both MIP and volume rendering are useful and complimentary in the evaluation of renal artery stenosis. Axial images alone are not sufficient for the evaluation of renal artery stenosis because the renal arteries often have a tortuous course especially in elderly patients. Multiplanar reformations are very useful, in particular to show renal artery occlusion.
4 Renal Infarction
Nontraumatic acute renal infarction is quite common in elderly patients, and it may present the same symptoms of stone colic or acute pyelonephritis. Renal infarction may be caused by tight stenosis or occlusion of segmental or of the main renal artery or by renal artery embolization due to renal angioplasty, atrial fibrillation, and cardiac valvular defects. Other causes of renal infarction are vasculitis, systemic lupus erythematosus, drug-induced vasculitis, paraneoplastic syndrome, hypercoagulable state, or acute venous occlusion (Kawashima et al. 2000). Both CT and angiography are reference imaging techniques in renal infarct detection, whereas US presents a lower sensitivity. Even though large renal infarcts may be hypoechoic in comparison with the viable renal parenchyma, segmental renal infarcts are usually isoechoic or rarely hyperechoic if hemorrhagic component is present.
Renal infarcts often reveal a wedge shape with capsular base. Even though baseline color Doppler US and power Doppler US present overt limitations to detect renal perfusion defects due to the low sensitivity to low-velocity and low-amplitude flow states, they may increase diagnostic capabilities of US in detecting renal infarcts, especially in elderly or obese patients and in patients with renal diseases. In renal infarct, color Doppler US and power Doppler US reveal absolute absence of renal cortical flows, even though it is very difficult to differentiate renal segmental infarct from areas which appear poorly perfused due to underlying parenchymal disease, deep renal position, and artifacts. Moreover, color Doppler US presents a low accuracy in the detection of small renal infarcts in the subcapsular region for limited spatial resolution and in the superior renal pole for the high Doppler angle and for the depth position (Correas et al. 2003).
Recent advances in microbubble-based contrast agents, and dedicated contrast-specific modes, have determined the achievement of increased image contrast in tissues. By transmitting at the fundamental frequency and receiving selectively harmonic frequencies, the background signal from stationary tissues is markedly suppressed resulting in a greater signal-to-noise ratio and a better visibility of renal infarcts. Blooming and flash artifacts are eliminated, shadowing artifacts are lessened, both spatial and temporal resolutions are improved, and the brightness of grayscale pixel does not depend on angle-dependent frequency shift estimates. Differently from iodinated contrast agent and gadolinium-based contrast agents, microbubbles are pure intravascular agents which are not excreted in renal tubules and may be safely employed in patients with advanced chronic renal failure, which is frequently observed in the elderly. Microbubble-based contrast agents and contrast-specific imaging techniques improve significantly the diagnostic confidence level in identifying nonperfused renal parenchymal zones and allow a reliable depiction of renal perfusion defects (Fig. 15). Renal perfusion defects due to renal parenchymal infarction appear as single or multiple focal wedge-shaped areas of absent, diminished, or delayed contrast enhancement in comparison to the adjacent renal parenchyma after microbubble injection (Bertolotto et al. 2008).
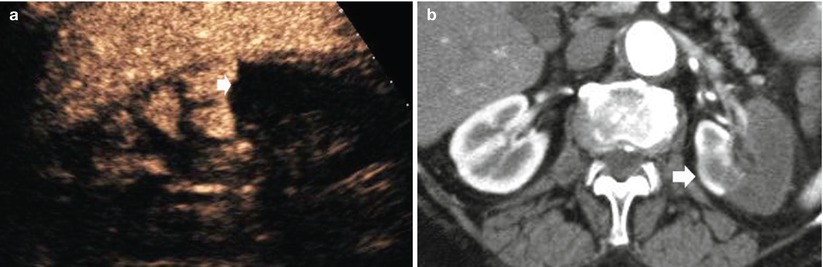
Fig. 15
(a) Contrast-enhanced US after sulfur hexafluoride-filled microbubble injection. (b) Contrast-enhanced CTA, corticomedullary phase. The left kidney shows partial parenchymal infarction (arrow) in a 72-year-old woman with atrial fibrillation
Contrast-enhanced CT is the reference imaging technique in renal infarct detection. The parenchymal appearance of renal perfusion defects depends on the site of arterial occlusion, if segmental (Fig. 15) or the main renal artery is involved (Fig. 16), and on thrombus age (Kawashima et al. 2000). Contrast material-enhanced CT shows the absence of enhancement in the affected renal tissue. Acute renal infarctions typically appear as wedge-shaped areas of decreased attenuation, while after the acute phase of renal infarction, atrophy begins and the infarcted tissue contracts, leaving a cortical scar. Chronic renal artery stenosis with persistent renal parenchymal hypoperfusion leads to progressive shrinkage of the parenchyma with absent residual function (Fig. 17).
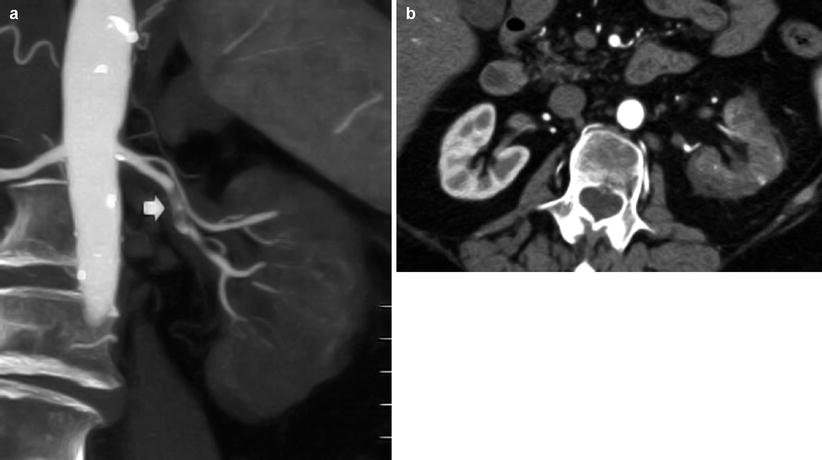
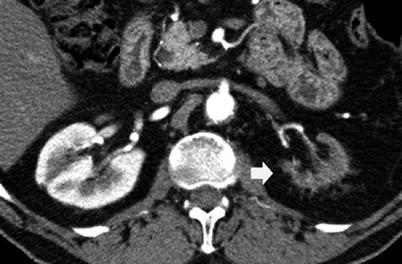
Fig. 16
(a, b) Renal artery thrombosis in a 75-year-old male patient. (a) Contrast-enhanced CTA. Coronal reformation. The left renal artery is occluded by a complex thrombus (arrow) with relative avascularity of the left kidney. (b) Contrast-enhanced CT. Corticomedullary phase shows a complete renal infarction
Fig. 17
Renal shrinkage due to chronic vascular hypoperfusion due to the tight stenosis of the left renal artery. Contrast-enhanced CT. Corticomedullary phase. The left kidney (arrow) appears small and without any sign of function (contrast excretion)
5 Atheroembolic Renal Disease
Atheroembolic renal disease (renal artery atheroembolization) is a complication of severe ulcerative atheromatosis of the abdominal aorta (Cohen 1992) or may be due to renal angioplasty, atrial fibrillation, and cardiac valvular defects. Atheroemboli localize in vessels smaller than the interlobular arteries, so that renal infarction does not occur and clinical picture is frequently bland (Cohen 1992) even though acute renal failure is the mode of presentation in most cases. Atheroembolic renal disease with acute renal failure may develop during or immediately after intravascular surgical intervention, intravascular interventional procedures (e.g., renal angioplasty), or anticoagulation due to atheroemboli detached from the renal artery wall. The most common clinical manifestation is the sudden onset of flank or back pain with or without hematuria, proteinuria, fever, and leukocytosis.
Color and power Doppler US is a first-line imaging procedure to detect renal perfusion defect but presents clear limitations due to the relative insensitivity to low-velocity and low-amplitude flow states (Taylor et al. 1996). Coley et al. (1991) found a global accuracy of color Doppler US for the detection of partial renal infarction of 20 %. Contrast-enhanced color and power Doppler US is limited by blooming and flash artifacts, which may be attenuated by reducing the instrument gain settings, also diminishing the detection of focal abnormalities in renal blood flow (Taylor et al. 1996). Contrast-enhanced CT (Fig. 18


Related posts:
Stay updated, free articles. Join our Telegram channel
Full access? Get Clinical Tree
