and Vincent L. Sorrell2
(1)
Division of Nuclear Medicine and Molecular Imaging Department of Radiology, University of Kentucky, Lexington, Kentucky, USA
(2)
Division of Cardiovascular Medicine Department of Internal Medicine Gill Heart Institute, University of Kentucky, Lexington, Kentucky, USA
Electronic supplementary material
The online version of this chapter (doi: 10.1007/978-3-319-25436-4_19) contains supplementary material, which is available to authorized users.
There are many conditions that can be identified in the liver (Table 19.1). The liver is the primary route of clearance of the99mTc MPI radiopharmaceuticals and should be visualized to some degree on all SPECT MPI raw data. The degree of visualization depends on liver function, interval between radiopharmaceutical administration and imaging, and type of stress.
Table 19.1
Differential diagnosis of “hot” and “cold” imaging findings related to the liver
Organ system | “Hot” finding | “Cold” finding | References |
|---|---|---|---|
Liver | Slow physiologic clearance Hepatomegaly Misshapen dome (elevated right hemidiaphragm) Intrahepatic gallbladder Pericholecystic rim sign (acute cholecystitis) Neoplasm,primary (hepatocellular carcinoma) Neoplasm,metastasis (e.g.,colon carcinoma) | Rapid physiologic clearance Cyst/hydatid cyst Post-thermal ablation cyst Polycystic disease Neoplasm,primary Neoplasm,metastasis Postoperative change | Burrell and MacDonald (2006) Chamarthy and Travin (2010) Chatziioannou et al. (1999) Fukushima et al. (1997) Gedik et al. (2007) Ghanbarinia et al. (2008) Hardebeck et al. (2013) Howarth et al. (1996) Joy et al. (2007) Lamont et al. (1996) Tallaj et al. (2000) |
The liver may be diffusely “hot” when there is poor physiologic clearance due to underlying liver disease (Fig.19.1). An enlarged liver (often accompanied by splenic enlargement) is seen in a variety of liver diseases and may displace other organs (Fig.19.2) (Ghanbarinia et al.2008; Raza et al.2005a,b; Shih et al.2005). A diffusely “hot” liver, especially when associated with a high right hemidiaphragm, may create processing artifacts, particularly affecting the inferior or inferoseptal myocardial walls, and may require waiting and re-imaging to allow for liver clearance (Fig.19.3) (Burrell and MacDonald2006; Howarth et al.1996). Left ventricular uptake may be falsely increased by “bleeding in” or falsely decreased by normalization of the processed image data (Fig.19.3) (Burrell and MacDonald2006).
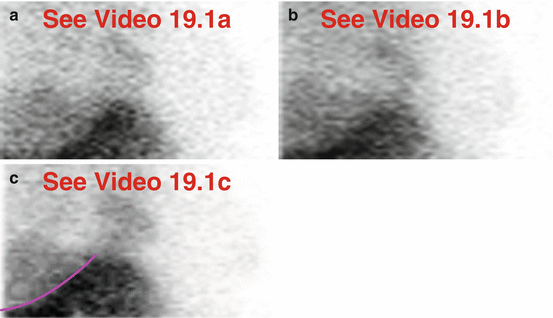
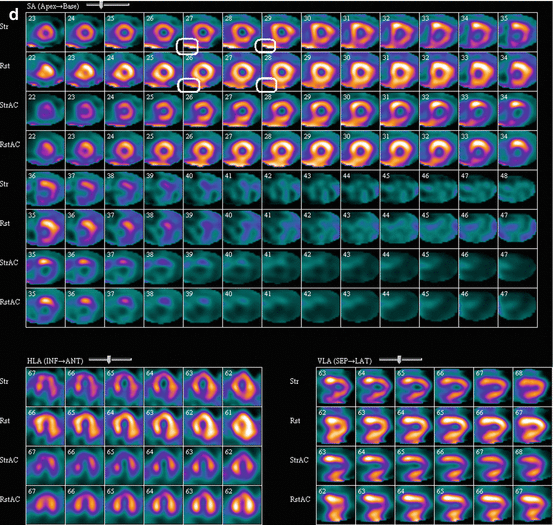
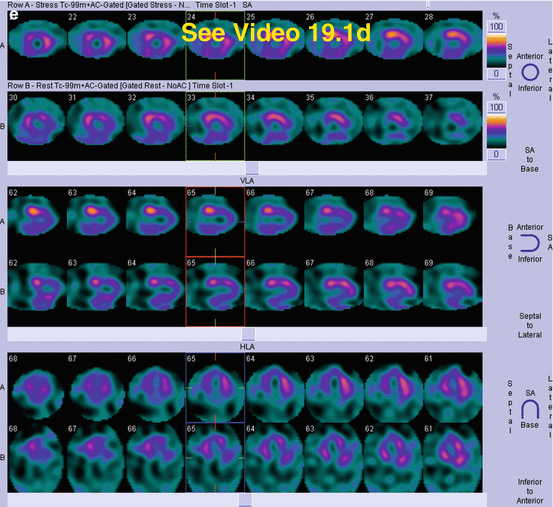
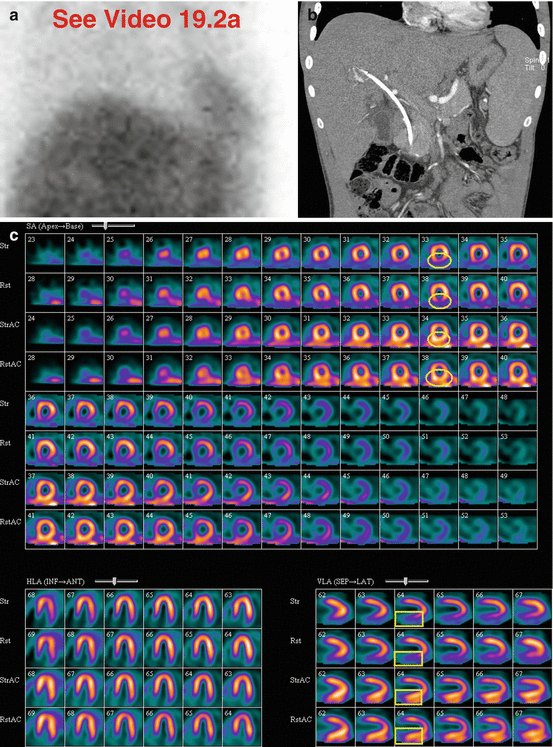
Fig. 19.1
Diffusely “hot” liver. An obese 42-year-old female has hepatitis C and abnormal liver function tests. The liver is diffusely “hot” without focal lesions (a–c). Note that the right breast overlying the liver creates a characteristic curvilinear “cold” artifact (a–c). The “hot” liver activity can be seen adjacent to the inferoseptal wall on the processed data but does not create a “hot” or “cold” artifact (d,e). The left breast overlies the entirety of the heart on both image sets (a,b).(a) Day 1: stress raw projection images (Video 19.1a, frame 1),99mTc sestamibi. (b) Day 2: rest raw projection images (Video 19.1b, frame 1),99mTc sestamibi. (c) Day 1: stress raw projection image (Video 19.1c, frame 6),99mTc sestamibi, right breast (pink arc). (d) Stress/rest processed SPECT images (SA, HLA, VLA) (without and with AC), selected stress and rest non-AC SA images, liver activity (white boxes). (e) Gated stress and rest SPECT images (Video 19.1d, frame 1) (SA, VLA, HLA)
Fig. 19.2
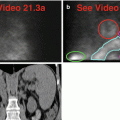
Hepatosplenomegaly due to autoimmune hepatitis and sclerosing cholangitis. A 22-year-old male awaits liver transplant. The enlarged liver and spleen fill the upper abdomen (a). Note skeletal activity consistent with chronic anemia. On correlative imaging, there is a biliary stent in place; note splenomegaly (b). There is no “cold” pleural effusion or “cold” ascites in this patient. There is a fixed inferior wall defect that normalizes with AC; thus, it is not a scar but rather can be attributed to diaphragmatic attenuation artifact (c). The liver activity is only apparent on the AC images (c).(a) Stress “black-on-white” raw projection images (Video 19.2a, frame 1),99mTc sestamibi. (b) Coronal CT of the abdomen through biliary stent and enlarged spleen. (c) Stress/rest processed SPECT images (SA, HLA, VLA) (without and with AC), representative SA and VLA images, inferior wall defect (yellow circles, SA, andyellow boxes, VLA)
Fig. 19.3
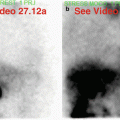
“Hot” liver causing processing artifact. This 75-year-old female underwent uneventful regadenoson stress. On both the rest (a) and initial stress (b) acquisitions, the liver has pronounced activity. Particularly on both sets of SA and VLA images, there is marked liver activity immediately adjacent to the inferior myocardial wall (c). Towards the apex, there is a tiny defect and towards the base, there may be “added” activity. Stress imaging repeated 30 minutes later mitigated the artifactual effect to considerable advantage, and the apical defect is barely perceptible (d,e). The case illustrates how it may be strategic to repeat imaging with a longer interval between injection and imaging in some patients; note how the inferior wall can be more confidently interpreted after repeat imaging.(a) Rest raw projection images (75 minutes injection-to-imaging) (Video 19.3a, frame 1),99mTc sestamibi. (b) Initial stress raw projection images (60 minutes injection-to-imaging) (Video 19.3b, frame 1),99mTc sestamibi. (c) Initial stress/rest processed SPECT images (SA, HLA, VLA), liver activity adjacent to inferior wall (yellow boxes on representative SA images), liver activity and adjacent inferior wall (yellow boxes on representative VLA images), tiny apical defect adjacent to “hot” liver (blue box on stress SA image). (d) Repeat stress raw projection images (90 minutes injection-to-imaging) (Video 19.3c, frame 1),99mTc sestamibi. (e) Repeat stress/rest processed SPECT images (SA, HLA, VLA), liver activity, and adjacent inferior wall (yellow boxes on representative VLA images)
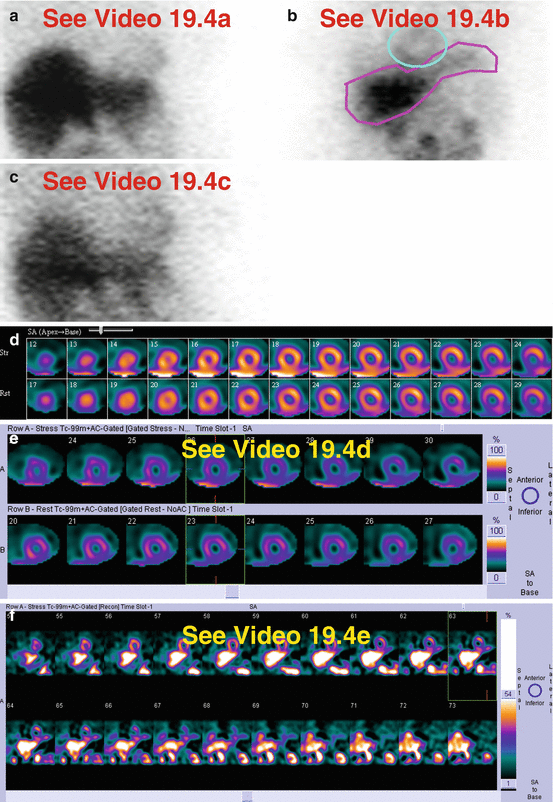
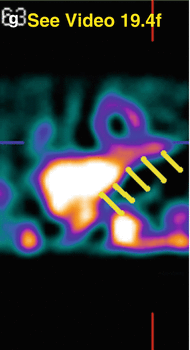
The shape and size of the liver can be readily evaluated. The right lobe can have an unusual configuration due to elevation of the right hemidiaphragm (Shih et al.2002). Conversely, a flattened dome (depressed right hemidiaphragm) suggests hyperinflation of the lungs (see Chap.10, Figs.10.3,10.4, and10.5) (Shih et al.2002). The left lobe can normally extend into the left upper quadrant (Fig.19.4); in such cases, it may be misconstrued as gastric activity and it may create processing artifacts.