Normal Anatomy
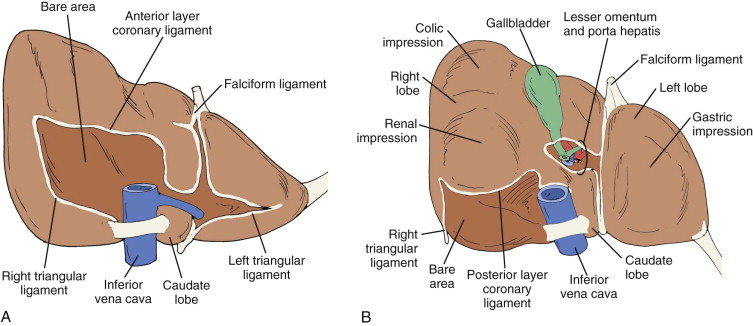
The liver is the largest abdominal organ and occupies the majority of the upper right quadrant of the abdomen. The diaphragm borders the liver superiorly, laterally, and anteriorly. The stomach, duodenum, and transverse colon border the liver medially; the hepatic colonic flexure, inferiorly; and the right kidney and adrenal gland, posteriorly. The liver is encapsulated by a dense layer of connective tissue, eponymously named Glisson’s capsule. Peritoneum covers the liver, except in the regions of the gallbladder fossa, the fossa for the inferior vena cava (IVC), and the bare area. The surface morphology of the liver features a convex diaphragmatic surface and a concave visceral surface. The bare area abuts the diaphragmatic surface posteriorly and is demarcated by the coronary ligament. The coronary ligament itself is formed by folds of parietal and visceral peritoneum. The superior and inferior limbs of the coronary ligament fuse to form the right and left triangular ligaments laterally ( Fig. 83-1 ). The right and left limbs of the coronary ligament fuse ventrally and extend as the falciform ligament that contains the ligamentum teres, which extends from the umbilicus to the superior surface of the liver.
The porta hepatis is a transverse slit in the hilum of the liver that is perforated by the right and left hepatic ducts, hepatic artery, and portal vein. The common bile duct, hepatic artery, portal vein, nerves of the liver, and lymphatics lie enclosed within the layers of the hepatoduodenal ligament (free edge of lesser omentum). The gastrohepatic ligament, which forms the superior aspect of the lesser omentum, attaches the liver to the lesser curvature of the stomach.
Hepatic Blood Supply
The liver has a dual blood supply from the hepatic artery, which provides systemic arterial circulation, and the portal vein, which returns blood from the gastrointestinal tract and spleen. Hepatic arterial flow provides about 25% of the hepatic blood supply. The majority of the blood supply of the liver comes from mesenteric portal drainage because of the liver’s role in gastrointestinal physiologic activity. Factors that influence the relative contribution of arterial and portal venous blood flow include hormonal, autonomic neural, and nutritional factors. The balance of blood supply may also become dysregulated by disease, such as hepatic parenchymal disease.
Portal Vein
The portal vein arises from the confluence of the superior mesenteric and splenic veins and is located posterior to the neck of the pancreas ( Figs. 83-2 and 83-3 ). The portal vein courses superiorly and toward the right, just posterior to the common bile duct and hepatic artery, within the hepatoduodenal ligament. At the porta hepatis, the portal vein divides into left and right branches. The right branch courses horizontally and bifurcates into anterior and posterior branches. The left branch is horizontal initially but then courses cranially and terminates into ascending and descending branches. The left portal vein joins the obliterated umbilical vein within the fissure of the ligamentum teres hepatis. In embryonic life, the umbilical vein is patent and blood from the umbilical vein drains into the left portal vein, where much of it is shunted through the ductus venosus.


Many anatomic variations of the portal vein exist. Most common is absence of the right portal vein with anomalous branches from the main portal vein and the left portal vein. Absence of the horizontal segment of the left portal vein is more rare.
Hepatic Artery
The celiac axis divides into the common hepatic, splenic, and left gastric arteries at the level of T12-L1. The common hepatic artery courses along the upper border of the pancreatic head, anteriorly and to the right, behind the posterior layer of peritoneum of the lesser sac. After giving off the gastroduodenal artery, the common hepatic artery becomes the proper hepatic artery. The proper hepatic artery enters the subperitoneal space of the hepatoduodenal ligament at the upper margin of the duodenum. The proper hepatic artery ascends to the liver, anterior to the portal vein and medial to the common bile duct. After entering the porta hepatis, the proper hepatic artery divides into the right, left, and occasionally middle hepatic arteries. The right and left hepatic arteries supply the right and left lobes of the liver, respectively. The middle hepatic artery, if present, supplies the medial segment of the left lobe, augmented by branches of the left hepatic artery. Branches of the right hepatic artery supply the caudate lobe; but in some variations, the left or middle hepatic artery may make perfusional contributions. The right hepatic artery also gives off the cystic artery to the gallbladder.
This classic arrangement of the hepatic arterial anatomy is seen in only 55% of patients ( Figs. 83-4 and 83-5 ). Common variants include the right hepatic artery partially (18%) or completely (14%) replaced by a branch from the superior mesenteric artery, the entire hepatic artery arising from the superior mesenteric artery (2%-4%), a partially or completely replaced origin of the left hepatic artery from the left gastric artery (18%-25%), and the left hepatic artery giving rise to the middle hepatic artery (45%).


Hepatic Veins
The right, middle, and left hepatic veins lie within the posterosuperior aspect of the liver. These veins course through the liver superiorly and obliquely and drain into the IVC. Several small emissary hepatic veins drain the caudate lobe independently into the IVC. The diameter of the hepatic veins is variable and may increase transiently with the Valsalva maneuver. Persistent dilation of the IVC and hepatic veins may be seen with right-sided congestive heart failure.
Duplication of the right, middle, and left hepatic veins is seen in 20%, 5%, and 15% of subjects, respectively. Absence of the main hepatic veins occurs in 8% of subjects. Accessory hepatic veins may also be seen in the liver. In one third of the population, the most common accessory hepatic vein drains the anterosuperior segment of the right hepatic lobe, which empties into the middle hepatic vein or occasionally into the right hepatic vein. Rarely, a separate inferior right hepatic vein drains directly into the IVC.
Lobar and Segmental Hepatic Anatomy
The liver can be divided into the right, left, and caudate lobes. The interlobar fissure separating the right and left lobes is oriented along a line passing through the gallbladder fossa inferiorly and the middle hepatic vein superiorly. Although this fissure is well formed in some patients, it may be incomplete in others. The fissure for the ligamentum teres forms the left intersegmental fissure, which divides the left lobe into medial and lateral segments. The fissure for the ligamentum venosum separates the left lateral hepatic segment from the caudate lobe.
Advances in surgical techniques of liver lesion resection have made conventional hepatic lobar anatomy obsolete, however. Surgeons need precise localization of liver lesions in the functional segments rather than in lobes for planning resection. The functional segmentation of the liver is based on surgical definition of feasible intrahepatic boundaries for resection. The segmental anatomy of the liver is primarily based on vascular anatomy that can be illustrated on cross-sectional imaging ( Fig. 83-6 ). Each segment has an independent vascular supply and biliary drainage. The portal venous, hepatic arterial, and bile duct branches course through the segments (intrasegmental). The main hepatic veins course in between the segments (intersegmental). The segmental nomenclature most commonly followed is the Bismuth-Couinaud system ( Fig. 83-7 ).


The Bismuth-Couinaud system serves as the anatomic basis for localizing focal hepatic lesions. In this system, the liver is divided into one segment and eight subsegments. The vertical divisions along planes of the main hepatic veins are maintained and are further divided by a horizontal plane passing through the right and left portal veins. The plane through the middle hepatic vein separates the right lobe from the left lobe. By these vascular landmarks, segmental localization of liver lesions can be performed with cross-sectional imaging.
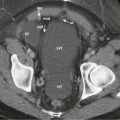
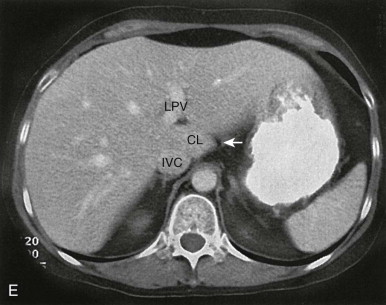
Segment I is the caudate lobe. The caudate lobe is a pedunculated portion of the liver extending medially from the right lobe between the portal vein and the IVC ( Fig. 83-8 ). It has some unique features. Functionally, the caudate lobe is an autonomous part of the liver, with a separate blood supply, bile drainage, and venous drainage. The right border of the caudate lobe is continuous with the parenchyma of the right hepatic lobe by an isthmus. Posteriorly, the IVC borders the caudate lobe. Inferiorly, the caudate lobe forms the superior margin of the foramen of Winslow and divides into a left-sided anterior prominence called the papillary process and a transverse caudate process that protrudes laterally to join the right hepatic lobe. The papillary process can be prominent and penetrate the lesser sac behind the gastric antrum close to the hepatic artery and the portal vein. In some cases, it may simulate a pseudolesion, misinterpreted as an enlarged lymph node or pancreatic mass on cross-sectional images.

The next consecutive segment numbers are given to segments of the left lobe, followed by the right lobe, in a clockwise fashion as seen in the frontal projection, with the exception of segment IVa. The lateral segments II and III of the left lobe lie lateral and to the left of the left hepatic vein. Segment II lies above and segment III lies below the plane of the portal vein. Segment IV lies between the middle and left hepatic veins. Segment IVa and segment IVb lie above and below the plane of the portal vein, respectively. In the right lobe, the right hepatic vein separates the anterior segments (V and VIII) from the posterior segments (VI and VII). The superior segments (VII and VIII) and the inferior segments (V and VI) lie above and below the plane of the portal vein, respectively. Segmental localization, however, is difficult in patients with variant hepatic vascular anatomy. Hepatic vein landmarks may be unreliable in patients with duplication of hepatic veins. The dorsal portion of segment IV is supplied by a branch from the right hepatic artery in 8% of subjects. Accessory portal segments with independent blood supply from the main portal vein or its right branch may be seen in 30% of subjects. Riedel’s lobe is an inferiorly positioned portion of the right hepatic lobe extending below the expected confines of the liver. After segmental hepatic resection, the remaining segments hypertrophy and distort the segmental anatomy by displacing the vessels.
Porta Hepatis
The porta hepatis is the hilum of the liver through which the portal vein, hepatic artery, common hepatic duct, nerves, and lymphatics enter the liver ( Fig. 83-9 ). The portal vein is the most consistent anatomic landmark. The common hepatic duct is a 3- to 5-mm thin-walled structure that lies anterior to the portal vein and lateral to the common hepatic artery. The right hepatic artery lies posterior to the common hepatic duct in 75% of patients and anterior in 25% of patients.

Bile Ducts
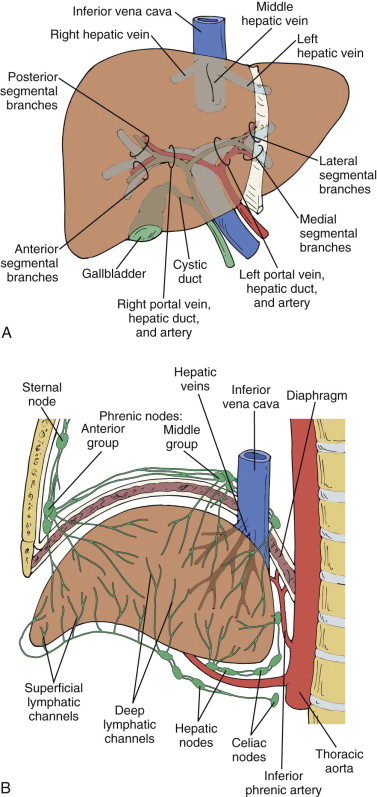
The segmental distribution of bile ducts closely follows the course of hepatic arterial branches ( Fig. 83-10A ). The ducts draining the right and left lobes communicate only at the porta hepatis. There is no communication between the bile ducts of the anterior and posterior segments of the right lobe.
Hepatic Lymphatics
Superficial lymphatics originate from subperitoneal tissue of the liver surface. The visceral surface drains into lymph nodes at the porta hepatis. The diaphragmatic surface drains toward the IVC and aortic lymph nodes near the celiac axis ( Fig. 83-10B ). Some lymphatics penetrate the diaphragm to enter retrosternal, cardiohepatic nodes that ascend as high as the neck along the right thoracic artery. The deep lymphatics of the liver form a major and a smaller trunk. The major trunk passes through the porta hepatis nodes, through the cisterna chyli, and, finally, into the thoracic duct. The smaller trunk courses along with hepatic veins and terminates in lymph nodes near the IVC. Lymphatics of the liver dilate secondary to cirrhosis, portal hypertension, veno-occlusive disease, right-sided heart failure, pericardial effusion, hypoproteinemia, liver transplant rejection, and glycogenesis.
Nerve Supply
The anterior hepatic nerve plexus surrounds the hepatic artery. It consists primarily of branches of the left celiac plexus, the right and left vagus nerves, and the right phrenic nerve. The posterior hepatic nerve plexus is located around the portal vein and the bile ducts. The hepatic arteries are innervated by the sympathetic nervous system. Pain from the gallbladder and the liver capsule may be referred to the right shoulder by the third and fourth cervical nerves.
Radiologic Techniques
Plain Radiography
Plain abdominal radiography has a limited role in the evaluation of the liver, both grossly and for focal lesions, because of the homogeneous soft tissue density of the liver. The superior border of the liver is outlined by the lung and the diaphragm. Other borders are seen only if they are outlined by intra-abdominal fat, gas-filled bowel loops, or free air. The lateral border of the liver is outlined by extraperitoneal fat continuous within the posterior pararenal space. This fat is also interposed between the inferior surface of the right hemidiaphragm and the parietal peritoneum. It may appear as a thick black line between the diaphragm and the hepatic dome radiographically. Retroperitoneal fat in the anterior pararenal space outlines the posteroinferior margin of the liver. Fluid in Morison’s pouch may obscure this interface, resulting in nonvisualization of the edge of the liver. The anteroinferior liver edge is less commonly seen because the amount of omental and pericolic fat that outlines the margin is more variable. The left hepatic lobe extends to the left of midline, ventral to the stomach and superior to the transverse colon.
Radiographic estimation of liver size is highly unreliable because of inconsistent visualization of borders, although it is more accurate than clinical palpation. Radiography may aid in detection of portal or hepatic venous and biliary tract air or calcified liver lesions, although sensitivity for these indications remains low. Plain abdominal radiography has become obsolete for evaluation of liver lesions with the advent and availability of cross-sectional imaging modalities like magnetic resonance imaging (MRI), computed tomography (CT), and ultrasound.
Ultrasound
The liver has a broad area of contact with the abdominal wall, making it an ideal organ for evaluation with real-time ultrasonography. Sonography is a safe, noninvasive, quick, and relatively inexpensive means of evaluating the liver and can be performed at the bedside, requiring little cooperation of the patient.
Evaluation Techniques
The liver is ideally examined after a 6-hour fast so that the gallbladder is not contracted. The highest possible transducer frequency should be chosen while maintaining the penetration through the posterior aspect of the liver. Near and far gain settings should be adjusted for uniform representation of echotexture of the liver parenchyma. A small footprint transducer may improve visualization of liver for an intercostal approach. Both supine and right anterior oblique views with the patient rotated on the left side should be used. Breath hold after deep inspiration causes caudal displacement of the liver and improves the visualization of the dome of the liver. Sagittal, transverse, coronal, and subcostal oblique views complete the examination. Focal lesions are easily identified on the real-time study and may be less well appreciated on the hard copy films or static images.
Sonography is an excellent modality for evaluating the course of the hepatic and portal veins. The portal vein divides at the porta hepatis into the right and left main branches. The portal veins are anechoic structures with echogenic walls. The bile ducts run with the portal veins and are too small to be seen except at the hilum, unless they are dilated. Contrary to common belief, there is no constant anteroposterior relationship between the intrahepatic bile ducts and the corresponding portal veins. The hepatic arteries also run with these structures but are usually too small to be seen except with the aid of color flow Doppler imaging.
The hepatic veins course posteriorly and superiorly through the liver to the IVC. They are intersegmental, whereas portal veins are intrasegmental with the exception of the ascending segment of the left portal vein. The walls of the hepatic veins are usually less echogenic than those of the portal veins.
Size and Architecture
Ultrasound of the liver is commonly used for evaluation of size of the liver. However, no single measurement of the liver reflects true size because of its variable shape. On longitudinal scans obtained through the midhepatic line, if the liver measures 13 cm or less, it is normal in 93% of individuals. If this measurement is 15.5 cm or more, the liver is enlarged in 75% of cases. Liver size should be evaluated in at least two planes to compensate for variable hepatic configuration. In the midclavicular line, the normal liver measures 10.5 ± 1.5 cm in longitudinal diameter and 8.1 ± 1.9 cm in the anteroposterior projection, with 12.6 cm and 11.3 cm being the 95th percentile. In the midline, the normal liver measures 8.3 ± 1.7 cm (95th percentile = 10.9 cm) and 5.7 ± 1.5 cm (95th percentile = 8.2 cm) in longitudinal and anteroposterior dimensions. Subjective evaluation of the configuration of the inferior border of the liver can be used to predict liver enlargement. An inferior angle of more than 45 degrees in the left lobe and more than 90 degrees in the right lobe indicates hepatic enlargement. When the liver is enlarged, its area of contact with the anterior border of the right kidney extends below the superior two thirds of the right kidney.
The normal liver is homogeneous with fine echoes that appear as moderately small dots or lines. The liver has an even brightness and texture interrupted only by the hepatic veins, portal vein, and fissures. The echogenicity of hepatic parenchyma depends on the equipment, transducer, and gain settings. Hence, the parenchymal echogenicity is judged by comparison with internal references. The right renal cortex, body of the pancreas, and portal vein walls are used for internal reference. The liver is either minimally hyperechoic or isoechoic compared with the adjacent normal right renal cortex in parasagittal or lateral coronal scans ( Fig. 83-11A ). Compared with the liver, the pancreas is hypoechoic in the young, isoechoic in adults, and hyperechoic in the elderly because of increasing fatty infiltration of the pancreas with age ( Fig. 83-11B ). The liver is hypoechoic to the spleen. The lateral segment of the left hepatic lobe may extend to the left and abut the spleen, mimicking a subphrenic or subcapsular splenic fluid collection ( Fig. 83-11C ). The portal vein wall is echogenic in the normal liver. All these architectural comparisons assume that the kidney and pancreas are normal. When these structures are diseased, internal sonographic references are less useful. In acute hepatitis, the parenchyma is hypoechoic to the right renal cortex, and the portal vein walls appear exceptionally bright. Conversely, in fatty infiltration and cirrhosis, the liver is markedly hyperechoic to the right renal cortex, and the portal vein walls are “silhouetted out” by the echogenic hepatic parenchyma.

Artifacts
Sonographic artifacts observed in the liver can mimic abnormalities. Focal fatty infiltration and focal fat sparing of the liver can appear as hyperechoic and hypoechoic pseudolesions, respectively. These lesions commonly involve the periportal region of the medial segment of the left lobe. Focal subcapsular fat infiltration may occur in diabetic patients treated with insulin in the intraperitoneal dialysate. The caudate lobe may appear as a hypoechoic mass because of attenuation of the sound beam by the fissure for the ligamentum venosum. The ligamentum teres, surrounded by collagen and fat of the falciform ligament, can simulate an echogenic mass. However, this can be recognized by its typical location. Ascites can increase sound transmission to a nodular portion of the liver, simulating an echogenic mass. Accessory fissures and folding of the diaphragm into the liver can also cause echogenic pseudolesions.
Intraoperative Ultrasound
Transabdominal ultrasound of the liver is limited by scattering and attenuation of the sound beam by subcutaneous fat and bowel gas. A high-frequency probe directly placed on the liver surface is without any beam scattering interfaces. Hence, with intraoperative ultrasound, high-resolution images of the liver can be obtained. Intraoperative ultrasound is an expanding field that can provide critical information to the surgeon and enable the surgeon to choose the appropriate surgical technique. The examination should be tailored to the specific needs of the surgeon to avoid undue prolongation of total duration of the surgical procedure. Intraoperative ultrasound can be performed during open laparotomy as well as during laparoscopy. Small, superficially focused, high-frequency, linear array transducers are used for ultrasound during laparotomy. These transducers have a wide field of view in the near field with improved near-field resolution. Intraoperative ultrasound can be employed for diagnostic evaluation as well as for imaging guidance for intraoperative ablation of focal hepatic masses ( Fig. 83-12 ).

The most common application of intraoperative ultrasound is during surgery in patients undergoing segmental resection for hepatic metastases from colorectal carcinoma. Intraoperative ultrasound can provide information about the relationship of normal vascular anatomy to pathologic masses, vascular invasion or thrombosis caused by tumors, and small, nonpalpable lesions that are difficult to detect on preoperative imaging studies. Intraoperative ultrasound can accurately detect cysts as small as 1 to 3 mm and solid focal lesions of 3 to 5 mm. Brower and colleagues reported that the sensitivity, specificity, and accuracy of intraoperative ultrasound (78%, 100%, and 84%, respectively) are superior to those of arteriography, CT, preoperative ultrasound, and palpation for detection of liver lesions.
Intraoperative ultrasound can detect additional liver lesions and modify the surgical management of patients with liver metastases from colorectal carcinoma. Intraoperative ultrasound has also been extended to use in identifying primary hepatic tumors during resection, in particular, hepatocellular carcinoma. Multiple studies have now shown that intraoperative ultrasound has increased sensitivity for detection of lesions compared with contrast-enhanced CT and MRI. Some have even advocated for intraoperative ultrasound as an imaging “gold standard” for focal hepatic lesion detection. Intraoperative ultrasound can be used to guide interstitial radiotherapy and cryotherapy for the treatment of liver metastases. The combination of intraoperative ultrasound and ultrasound contrast agents has also been shown to increase sensitivity for metastases not otherwise seen on preoperative CT or MRI. One study showed that the operative course of more than a quarter of patients was changed because of additional findings with intraoperative ultrasound. The combination, however, of preoperative imaging and intraoperative ultrasound remains of highest detection value.
During laparoscopic ultrasound, the transducer is introduced through the laparoscopic port, usually periumbilical or right lower quadrant. A multifrequency 5-, 6.5-, or 7.5-MHz curvilinear laparoscopic ultrasound probe with a flexible tip is used. A substantial pitfall in visualization during laparoscopic ultrasound has been poor near-field visualization. Laparoscopic ultrasound can demonstrate more liver lesions compared with CT and CT portography. Laparoscopic ultrasound identified liver tumors not seen at laparoscopy in 33% and provided additional staging information to laparoscopy alone in 42% in a study of patients with potentially resectable liver lesions by preoperative imaging.
Doppler Ultrasound
Duplex and color flow Doppler imaging improve the diagnostic capabilities of ultrasound by enabling the evaluation of complex circulatory dynamics of the liver. Thrombosis, reversal of flow, aneurysms, and fistulas are better demonstrated with duplex and color flow Doppler sonography than with gray-scale ultrasound. Doppler settings need to be optimized to achieve the greatest sensitivity to allow the detection of low flow, and power Doppler may be helpful in this setting. Color gain must be increased to a level just below the level that would create artifacts. In addition, Doppler imaging can be used for detection of vascularity and vascular invasion of focal lesions of the liver. Color and spectral Doppler are unable to detect the vascularity of the majority of focal lesions of the liver because of low intensity of the signals. Tumor vascularity is better evaluated with power Doppler and ultrasound contrast agents.
Doppler tracing of the hepatic artery demonstrates a high diastolic flow that indicates low impedance ( Fig. 83-13A ). Doppler sonography is most often used to differentiate the hepatic artery from a bile duct in the porta hepatis. Color flow images may be needed to localize the hepatic artery. The intrahepatic branches of the hepatic artery are usually not visualized on gray-scale ultrasound. When there is compensatory dilation of intrahepatic branches of the hepatic artery in cirrhosis, Doppler ultrasound can differentiate this from dilation of intrahepatic biliary radicals.

In liver transplant recipients, survival of the allograft depends on patency of the hepatic artery. Changes in the normal hepatic artery waveform may suggest stenosis or thrombosis in these patients. These changes include slow rise to peak systole, diminished amplitude, and prominent diastolic flow, referred to as a tardus-parvus waveform. The normal marked increase in postprandial hepatic artery resistive index seen in normal individuals is generally not seen with severe liver disease.
The flow pattern of the hepatic veins ( Fig. 83-13B ) is similar to that of the IVC and other large systemic veins, undulating with cardiac and respiratory motion. Normal hepatic venous flow is directed toward the vena cava. With tricuspid regurgitation, there is a pronounced systolic reversal of hepatic venous blood flow. The triphasic pattern is lost in cirrhosis as the liver, which encases the hepatic veins, becomes less compliant.
The portal vein has a characteristic continuous flow pattern ( Fig. 83-13C ) modulated by respiratory variations. This normal respiratory variation is either attenuated or lost in portal hypertension. Portal vein pulsatility is increased in patients with right-sided heart failure, as cardiac pulsations are transmitted to the portal vein.
Tissue Harmonic Imaging
Conventional gray-scale ultrasound transmits and receives the sound beam at the same frequency. In tissue harmonic imaging (THI), the second harmonic signal is received by filtering out the fundamental echoes from the tissue being evaluated. Body wall artifacts, side lobes, and scatter are minimized and signal-to-noise ratio is improved with THI as the harmonic signals are generated in the tissues. The shorter wavelength of the sound beam used in THI results in improved axial resolution. THI can detect additional liver lesions and alter the clinical management compared with conventional ultrasound.
Ultrasound Contrast Agents
The availability of ultrasound contrast agents has extended the clinical applications of sonography to primarily aid in the display of parenchymal microvasculature. An ultrasound contrast agent is defined as an exogenous substance that can be administered either in the blood pool or in a cavity to enhance sonographic signals. Contrast agents increase the backscattered signal intensity, resulting in improved gray-scale echogenicity on sequences such as harmonic imaging and pulse inversion as well as increased color and spectral Doppler signal strength. Agents are injected intravenously, and imaging proceeds immediately thereafter. The advantages of contrast-enhanced ultrasound are the ability to assess contrast enhancement in real time and the excellent temporal resolution. Contrast agents generally also have a strong safety profile. The limitations of contrast-enhanced ultrasound include a relatively narrow time window available for scanning after administration of the contrast agent and limited evaluation if the baseline ultrasound is also limited.
Ultrasound contrast agents for evaluation of the liver are microbubbles stabilized by a shell. The most prevalently used include SonoVue (Bracco SpA, Milan, Italy), a sulfur hexafluoride encased in a phospholipid shell, introduced in 2001 and available in Europe, China, India, Korea, Hong Kong, New Zealand, Singapore, and Brazil; Definity (Lantheus Medical, Billerica, MA), a perflutren in a lipid shell, introduced in 2001 and available in Canada and Australia; Sonazoid (Daiichi-Sankyo, GE, Tokyo, Japan), a perfluorobutane in a phospholipid shell, introduced in 2007 and available in Japan and South Korea; and Levovist (Bayer Schering AG, Germany), a granule of galactose and palmitic acid, for which production is halted. At the time of this writing, none of these agents or any ultrasound contrast agent has been approved by the Food and Drug Administration for clinical use in the United States.
Most agents have similar vascular behavior, with rapid enhancement of the vasculature after injection and slow dissipation during 5 to 10 minutes. Sonazoid is an exception and has an extended late phase, known as the post-vascular phase, and can persist up to a couple of hours in the liver because of phagocytosis by Kupffer cells.
Harmonic imaging detects microbubbles as they resonate at their characteristic frequencies. Microbubble contrast agents are better demonstrated and detected longer in various organs as well as in tumor vessels with harmonic imaging than with color Doppler imaging. Quaia and associates reported that pulse inversion harmonic imaging with ultrasound contrast agents detected additional liver metastases in 47% of patients compared with conventional gray-scale ultrasound. Liver metastases even as small as 2 mm can be detected by pulse inversion harmonic imaging with ultrasound contrast enhancement. Tissue canceling ultrasound techniques can provide a microbubble-only image that can be helpful for making lesions more prominent than by superimposition of microbubble and B-mode images; however, users must be careful about understanding unique artifacts in this mode.
Ultrasound contrast agents generally have a good safety profile. Unlike with CT and MR agents, there is no associated known nephrotoxicity. The risk of severe allergic and anaphylactic response is similarly low to that of MR contrast agents. Although the risks are low, emergency response and a trained clinician should be immediately available, just as with all administrations of contrast agents.
Computed Tomography
Advances in multidetector CT (MDCT) technology have revolutionized liver imaging. MDCT enables fast scan coverage and acquisition of submillimeter section thickness images of isotropic volume resolution. Faster image acquisition enables multiphasic CT acquisition through the liver with injection of a single bolus of contrast material, and the isotropic image data set improves the conspicuity of small lesions and the quality of three-dimensional (3D) reformations. The multiplanar reformations can better demonstrate the anatomic relationship of hepatic focal lesions with the blood vessels, which can help surgeons plan segmental resection of the liver. The 3D reformations enable illustration of hepatic vascular anatomy for evaluation of liver donors. Emerging techniques like dual-energy CT (DECT) and CT perfusion imaging have added new horizons of capabilities to CT with lesion detection, characterization, and treatment monitoring.
Unenhanced Computed Tomography
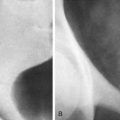
Noncontrast CT scans of the liver are inferior to contrast-enhanced studies for lesion detection and thus are not routinely performed except in certain specific situations. Liver disorders that diffusely alter hepatic attenuation, such as fatty change, hemochromatosis, glycogen storage diseases, chemotherapy, amiodarone administration, and gold therapy, should be evaluated with noncontrast CT. Patients with cirrhosis should also undergo noncontrast scans to search for iron in dysplastic and siderotic nodules. Noncontrast liver CT may be indicated for evaluation of lesion calcification, hemorrhage (in lesions like hepatocellular adenomas; Fig. 83-14 ), and metastases from hypervascular tumors like carcinoid, renal, thyroid, insulinoma, pheochromocytoma, and breast. These hypervascular metastases may become isodense after contrast enhancement. However, DECT with the capability to reconstruct virtual unenhanced images similar to true noncontrast CT can preclude acquisition of separate noncontrast series as further discussed later.

Contrast-Enhanced Computed Tomography
Iodinated Contrast Dynamics.
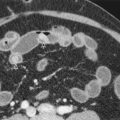
The goal of contrast enhancement is to improve lesion visibility by increasing the relative attenuation difference between the lesion and normal hepatic parenchyma. This difference is a fundamental factor in lesion conspicuity and characterization. Many factors affect the timing and degree of hepatic enhancement and thus the contrast difference between normal hepatic parenchyma and lesions. Hepatic enhancement is most dependent on the phase of the contrast delivery during which scanning occurs. These phases can be divided into vascular, redistribution, and equilibrium. During the vascular phase, there is a rapid increase in aortic enhancement and a slow increase in hepatic enhancement. This phase is short because iodinated contrast material diffuses rapidly from the vascular blood pool to the extravascular or interstitial space of the liver, thus beginning the redistribution phase. During this time, there is a rapid decrease in aortic enhancement and an increase in hepatic enhancement. This represents the ideal time for detecting most lesions ( Fig. 83-15 ). In the equilibrium phase, there is decline in aortic and hepatic enhancement. Hence, lesions may become isoattenuating to hepatic parenchyma.

Helical CT technology allows multiphase CT acquisition with the administration of a single bolus of contrast material. An initial acquisition can be obtained during the hepatic arterial phase, so that highly vascular lesions are highlighted against a background of nonenhanced normal liver parenchyma. These lesions may become isodense with remaining liver if scanning is performed later. A later, portal venous (redistribution) phase scan is obtained when most of the contrast material bolus enhances the normal hepatic parenchyma. Because metastases receive primarily arterial blood supply, most metastases are hypodense compared with normal liver (see Fig. 83-15 ). These phases are further discussed in the section on biphasic scanning.
The timing of these different phases and peak enhancement is directly affected by the way in which contrast material is delivered. The volume, type, concentration, and rate of injection of contrast material used affect the time to peak enhancement. Several studies suggest that the time to peak contrast enhancement is dependent on the duration of contrast material injection. Higher injection rate or lower volume injections produce an earlier peak enhancement because of the short duration of the injection.
The amount of hepatic enhancement is determined by technical and patient-related factors. Technical factors include concentration of the contrast material, volume, and injection rate. These factors have interdependent effects. Hepatic enhancement increases with higher volume, injection rate, and concentration of the contrast material. Increasing the injection rate from 2 to 3 mL/s results in 16% increase in peak hepatic enhancement. However, increasing the injection rate above 4 to 5 mL/s does not result in substantial increase in peak hepatic enhancement.
Patient-related factors that affect enhancement include weight and cardiac output. There is decreasing hepatic enhancement with increasing weight. In thin patients undergoing spiral CT, the dose of the contrast agent may be reduced by up to 40%. Megibow and associates reported that a weight-based dose of 1.5 mL/kg of 300 mg I/mL contrast material can provide acceptable contrast enhancement in most patients, with a significant cost savings. Although faster image acquisition with MDCT has enabled considerable reduction of the dose of the contrast agent for CT angiography studies, enthusiastic reduction of the contrast material dose for CT evaluation of the liver is limited by the minimum iodine dose required for optimum liver enhancement. The iodine dose required to achieve a hepatic enhancement of 50 HU has been reported to be 521 mg I/mL. Decreased cardiac output delays hepatic enhancement.
Faster image acquisition with MDCT mandates high iodine influx rate for optimum enhancement. High-concentration contrast material is a valuable option for this because of the limited range of possible fast injection rates. Increased enhancement of hepatocellular carcinoma in arterial phase CT and improved lesion conspicuity with high-concentration contrast material (370 mg I/mL) have been reported. This improved enhancement with high-concentration contrast material is visually significant in patients weighing more than 65 kg. The use of a chaser bolus of 20 mL of saline has been reported to increase the enhancement of liver, portal vein, and aorta.
Automated methods of timing delivery of the contrast material have been advocated to achieve a greater and more consistent level of hepatic enhancement from patient to patient than with the use of a conventional fixed delay time. These methods make use of a region of interest placed on the aorta, portal vein, or liver parenchyma. During delivery of the contrast material, multiple images are obtained at a fixed level at 3- to 5-second intervals. When a preselected threshold of 50 HU is reached, the scan is initiated. Automated bolus tracking can increase the mean liver parenchymal enhancement substantially compared with empirical time delay scanning. In addition, automated bolus tracking can improve the liver-to-lesion conspicuity.
Helical Portal Venous Phase Scan (Single-Phase Scan).
This is the preferred CT technique for routine hepatic evaluation. With helical CT, the entire liver can be scanned during peak parenchymal enhancement, further improving diagnostic accuracy. This is accomplished by imaging the liver beginning at about 55 to 70 seconds after the start of the contrast material bolus, depending on injection rate. Reduced cardiac output can delay the peak hepatic enhancement. Most centers use 100 to 150 mL of 300 to 370 mg I/mL contrast material injected at a rate of 3 mL/s or more.
Biphasic Helical Scan.
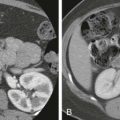
Biphasic CT using a hepatic artery dominant phase technique and a portal venous phase technique is more efficacious than conventional CT using a single portal venous phase technique to detect hypervascular lesions, including hepatocellular carcinoma and metastases from renal, breast, carcinoid, and pancreatic islet cell tumors. Attenuation differences between an intensely enhancing hypervascular metastasis supplied by hepatic arterial flow and the remainder of the liver are maximized during the arterial phase scan ( Fig. 83-16A ). Portal vein flow would render the hypervascular metastases isoattenuating ( Fig. 83-16B ). Arterial phase images are acquired by scanning 20 to 30 seconds after the start of injection of the contrast material. The time at onset of arterial phase is dependent on the injection rate of the contrast material. With a fixed injection rate, small changes in volume do not affect the duration of the arterial phase. Faster injection rates increase the amount of arterial enhancement as well as the length of time between peak aortic enhancement and the end of the arterial phase, which might increase detection of hypervascular tumors. A second acquisition is then obtained during the portal venous phase, after a delay of 55 to 65 seconds from the beginning of the injection of the contrast material. Contrast material is delivered at a faster rate of 4 to 5 mL/s for biphasic CT study, instead of 3 mL/s, which is used for single-phase CT study.

Biphasic helical scanning has been found especially helpful in hepatocellular carcinoma, in which the addition of an arterial phase scan improves lesion detection compared with portal phase scans alone or CT arterial portography. In addition, arterial phase data enable vascular road mapping for oncologic liver surgery planning. Detection of a hypervascular hepatic lesion in a patient with cirrhosis is suggestive of hepatocellular carcinoma. Biphasic technique for the detection of hypervascular metastases has had more mixed results. Several studies have found that 21% to 37% of lesions 2 cm or smaller either are visible only or are more conspicuous on arterial phase images. Another study, however, found that nonenhanced and portal venous phase images detected significantly more hypervascular metastases than did hepatic arterial phase and portal venous phase or portal venous phase images alone. Hepatic arterial phase scanning does not need to be performed for evaluation of hypovascular hepatic lesions as they do not show enhancement during the hepatic arterial phase. Although multiphase liver imaging with MDCT improves sensitivity and specificity of liver imaging, the risk of radiation exposure increases with this. Application of automatic exposure control may result in substantial reduction of radiation dose to the patient while maintaining acceptable image quality.
Delayed Iodine Scanning.
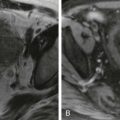
Delayed scanning has been employed to improve detection of intrahepatic cholangiocarcinoma ( Fig. 83-17 ) and metastases. Cholangiocarcinoma appears hyperdense on delayed scans in 74% of patients. Studies assessing whether delayed scanning is helpful in detecting hepatocellular carcinoma have produced conflicting results. In one study, the sensitivity of detection of hepatocellular carcinoma increased by 4% by addition of delayed phase scanning (180 seconds) to the hepatic arterial and portal venous phase scanning. In addition, the filling in of hemangioma with contrast material can be demonstrated on delay phase scans.

Computed Tomography Angiography and Portography.
In this technique, an arterial catheter is placed selectively in the hepatic, splenic, or superior mesenteric artery in the angiography suite and contrast material is injected through this catheter. Hence, during CT arterial portography (CTAP), there is dense enhancement of liver parenchyma receiving portal venous blood. Liver lesions that receive primarily arterial rather than portal venous blood supply appear as hypodense defects on CTAP.
Perfusion defects and other artifacts diminish the specificity of CTAP. CTAP has a false-positive rate of 15% to 17%. An additional delayed phase acquisition can improve the specificity of CTAP. CTAP is seldom performed now because of its invasive nature and increasing use of noncatheter CT angiography and intraoperative ultrasound.
Computed Tomography Liver Protocol Optimization and Radiation Dose Reduction
Protocol Optimization.
When it is necessary to perform CT, the radiologist should aim to reduce the CT dose but yet maintain diagnostic image quality. To achieve this, the single most important step is protocol optimization. Optimization of CT technique involves careful selection of scan length and manipulation of several modifiable parameters during the scan, including slice thickness, pitch, tube current, peak tube potential, gantry rotation speed, and noise reduction reconstruction algorithms.
Adjustments to tube current and peak tube potential are among the most common strategies in optimizing CT protocol. Tube potential should be optimized more carefully because unlike tube current, it affects not only the image noise but also the tissue contrast. For a given image noise, higher peak kilovoltage techniques require lower tube current and vice versa. The patient’s size should serve as an appropriate guide. Most routine adult abdomen CTs performed at 120 kVp rather than at 140 kVp achieve 20% to 40% reduction in radiation dose. For patients with a larger body habitus, however, 140 kVp tube potential should be employed to avoid loss of diagnostic quality. For smaller subjects, such as pediatric patients, peak kilovoltage may be decreased to 100 or 80 as smaller body habitus leads to minimal attenuation of the x-ray beam, allowing adequate image quality without significant increase in tube currents. A low peak kilovoltage approach at 100 kVp for CT hepatic angiography in organ donor patients may be used; this has been shown to achieve 30% to 35% dose reduction compared with 120 kVp, without affecting diagnostic quality ( Fig. 83-18 ).

The tube current on modern CT scanners is determined by automatic modulation of tube current (ATCM). Many studies have shown that ATCM can significantly decrease radiation dose. The basic principle behind the ATCM techniques is to customize the tube current on the basis of the patient’s thickness along the z-axis or axial plane derived by orthogonal scout projections. This reduces the radiation dose compared with a fixed tube current across the entire rotation. ATCM relies on user-specified image quality in terms of image noise or tube current–time product value. In scanning younger patients, particularly children, lower tube currents with radiation doses as low as reasonably achievable and lower than those for most adult patients should be employed. One may also consider lower fixed tube current settings, based on patient weight or body girth. Because there is wide variation in weight, varying from less than 5 kg up to 100 kg, selection of tube current as well as peak tube potential factors should be carefully done by categorizing into different weight groups. A prospective study exhibited that a mean dose reduction in the abdomen and liver of 38% with angular modulation and 18% with z-axis modulation can be achieved with no compromise in image noise or quality. The selection of image noise level is based on the clinical indication of the liver CT. For example, CT angiography should be undertaken at a relatively higher image noise level compared with portal phase CT for detection of low-contrast liver metastases. Automatic selection of peak tube potential, which functions on the basis of the patient’s tissue attenuation profile, has also been implemented recently.
Although it is possible to achieve submillimeter imaging on current MDCT scanners, thinner slice images require an increase in radiation dose to maintain an adequate signal-to-noise ratio. In clinical practice, typically 2.5- to 5-mm prospective slices are reconstructed. When thinner slice images are required, for example, in hepatic CT angiography requiring 1-mm slice especially for 3D reconstruction, a reasonable approach would be to obtain thicker slice images but then to retrospectively reconstruct at the desired thickness from the volumetric data. This is a feature that is available on most modern MDCT scanners.
Keeping other CT parameters constant, faster table speed, for a given collimation, results in higher pitch with reduced radiation dose and vice versa. Modern MDCT scanners have mechanisms to automatically recommend the appropriate tube current to maintain a given image noise level when the pitch is changed. A pitch factor of approximately 1.0 to 1.3 can be used for CT of the abdomen and pelvis in patients weighing up to 300 pounds and a lower pitch of 0.7 for large patients (>300 pounds). Higher pitches should be avoided because they are associated with worsening helical artifacts and may also potentially miss some data.
Noise Reduction Techniques.
Filtered back projection algorithms are inherently sensitive to low-dose examinations, resulting in increased image noise. Image noise reduction algorithms include conventional noise reduction filters and newer techniques based on iterative reconstruction. These techniques primarily do not decrease radiation dose but enhance image quality by decreasing image noise and improving contrast from low-dose CT. On the other hand, noise reduction filters, popularly the adaptive CT filters using linear processing techniques, result in homogeneous decrease in image noise across all pixels, thereby reducing image contrast and conspicuity of smaller lesions. This potential drawback limits the dose-saving capability of CT image filters.
By using nonlinear processing, iterative reconstruction techniques have been able to avoid an unacceptable tradeoff between image contrast/resolution and image noise, especially at substantially reduced doses. Because conventional iterative reconstruction methods required long computational times, shorter partial reconstruction algorithms applied in projection or the image space domain were initially introduced by different vendors. More recently, robust full iterative reconstruction algorithms have been made available for clinical use by different vendors. Such techniques include adaptive statistical iterative reconstruction (ASIR) and model-based iterative reconstruction (MBIR) by GE HealthCare and iterative reconstruction in image space (IRIS) and sinogram-affirmed iterative reconstruction (SAFIRE) by Siemens Medical Solutions. Investigators have tested and validated the utility of such techniques, which have enabled dose reduction to as much as 40% to 60% lower than with standard-dose CT ( Fig. 83-19 ). By synergistic use of these described strategies with noise reduction filters with iterative reconstruction methods, CT protocols at significantly lower dose can be implemented while minimizing compromising diagnostic capability.