4 Liver
 Organ Boundaries
LEARNING GOALS
 Locate the liver.
 Clearly delineate the liver from its surroundings.
 Survey the total liver volume in multiple planes.
 Recognize portions of the liver that are difficult to scan.
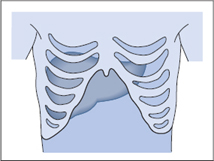
The liver is the dominant organ of the right upper abdomen. It is protected by ribs and is covered mainly by the right costal arch. These simple anatomical facts are widely known, but they have special significance and implications for ultrasound scanning.
1 The liver is so large that cannot be scanned adequately from one approach. A complete examination of the liver requires scanning from multiple angles and directions.
2 The liver cannot be scanned by the shortest route, but only from beneath the costal arch or between the ribs (Fig. 4.1). This means that while performing serial scans, you will view many sections of the liver more than once but are apt to miss blind spots if you are not fully familiar with the extent of the organ. Figure 4.2 illustrates this problem with an analogy.
Locating the liver
Barriers to scanning
 Ribs
Ribs
 A high diaphragm
Optimizing the scanning conditions
To make the liver more accessible, have the patient raise the right arm above the head to draw the rib cage upward. Place the patient in the supine position and have him or her take a deep breath and hold it to expand the abdomen. One disadvantage of holding the breath is that it is followed by a period of hyperventilation, especially in older patients.
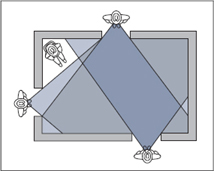
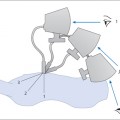
Fig. 4.2 Difficulties of liver scanning.
In this analogy, an observer is looking into a room through three windows. Moving from window to window, he views the center of the room several times and sees corners a total of five times. Even so, he is unable to see the man sitting in one corner of the room.
Organ identification
TIPS
To define the inferior border of the liver in longitudinal sections, press the caudal end of the transducer a little more firmly into the abdominal wall than the cranial end.
By varying the pressure on the transducer, you can keep the inferior border of the liver at the right edge of the image.
If there is intervening gas in the right colic flexure, have the patient take a deep breath to expand the abdomen.
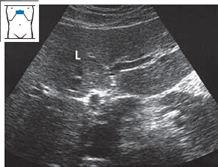
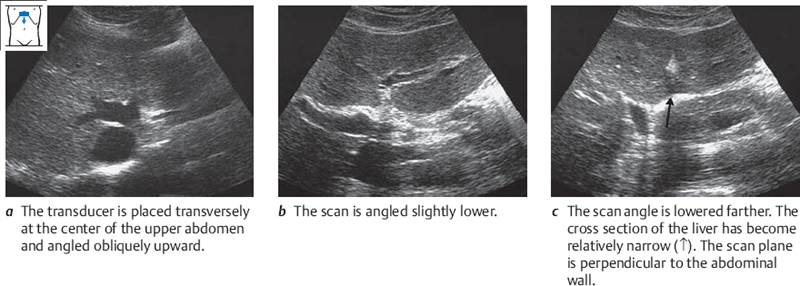
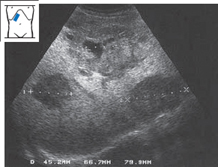
Start with the transducer placed transversely against the right costal arch, at the level where you would palpate the inferior border of the liver. Mentally picture the liver lying beneath the ribs, and angle the scan upward. Now ask the patient to take a deep breath, expanding the abdomen, and the liver will appear on the screen as a region of homogeneous echo texture. Figure 4.3 illustrates the view of the liver that is acceptable for organ identification.
Imaging the liver in its entirety
Because the liver is so large, it is best to proceed in steps when learning how to scan the entire organ.
1 Learn the outlines of the liver:
– the inferior border,
– the superior border,
– the left border.
2 Survey the liver volume:
– in longitudinal sections,
– in subcostal transverse and oblique sections,
– in intercostal sections.
Outlines of the liver
Defining the inferior border of the liver
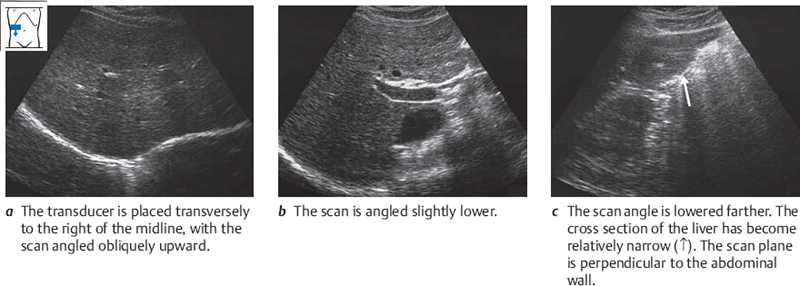
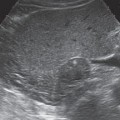
The liver tapers inferiorly to a more or less sharp-angled border. This inferior border is easy to demonstrate with ultrasound. Place the transducer longitudinally on the upper abdomen, slightly to the right of the midline. Press the caudal end of the transducer a bit more deeply into the abdominal wall than the cranial end, so that the scan is directed slightly upward. This should bring the sharp inferior hepatic border into view (Fig. 4.4a).
Now slide the transducer to the left, keeping it in a longitudinal plane while following the line of the costal arch as closely as possible. Also, make sure that the inferior border of the liver stays at the right edge of the image. You can do this by varying the pressure on the transducer as needed.
As the transducer moves farther to the left, the cross section of the liver diminishes in size. Its roughly triangular outline becomes progressively smaller and finally disappears. The image is now dominated by a chaotic pattern of highly contrasting light and dark areas with no discernible shape, caused by the gas and liquid contents of the stomach.
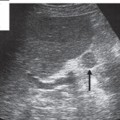
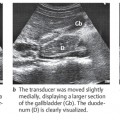
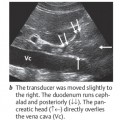
Now return to the starting point and scan past it toward the right side. As you track across the abdomen, you will recognize the aorta and then the vena cava. As you scan past the vena cava, the gallbladder can be identified as a “black” structure in the fasted patient. With luck, the right kidney may also be seen. As the transducer moves farther to the right, the angle of the inferior hepatic border becomes increasingly blunted (Fig. 4.4b,c).
Visualization often becomes poor at this point, especially in obese patients and when there is interposed gas in the right colic flexure. It can be helpful to have the patient breathe in deeply and inflate the abdomen.
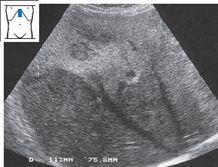
The series of images in Fig. 4.4 were selected to illustrate good scanning conditions. You should keep this in mind if you do not achieve the desired result right away. Figure 4.5 shows the appearance of a liver that is difficult to scan. This scan corresponds to the section in Fig. 4.4b.
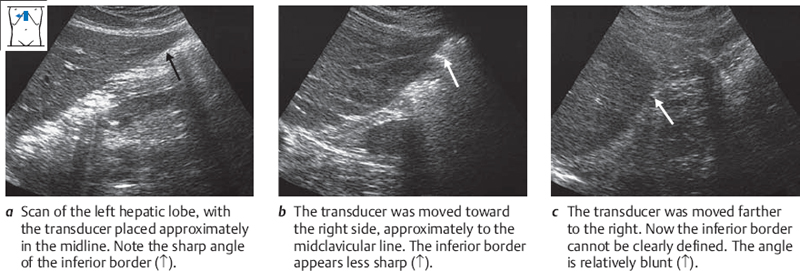
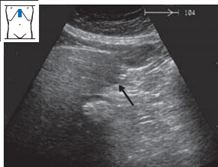
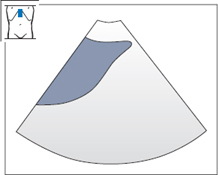
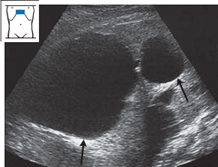
Fig. 4.6 Shape of the inferior border.
Note that the posterior surface of the liver is concave below (toward the inferior border) and convex above.
After you have scanned across the inferior border of the liver once for orientation, make a second pass while giving attention to details. You have already seen that the inferior border has an approximately triangular shape in the ultrasound image. The anterior surface of the liver, which lies against the abdominal wall, is flat and smooth. The posterior surface is slightly concave in its lower portion and becomes slightly convex superiorly (Fig. 4.6). The angle between the anterior and posterior surfaces is 30–45° on the left side and 45–70° on the right side (Fig. 4.7). The posterior surface has several concavities that interrupt its triangular shape: the porta hepatis and the impressions from the gallbladder and right kidney.
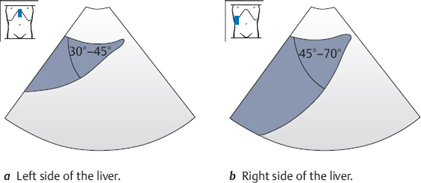
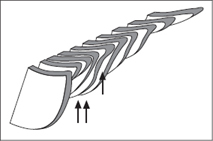
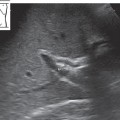
Fig. 4.8 Longitudinal serial scans of the inferior border. The posterior surface of the liver bears impressions from the gallbladder (↑) and right kidney (↑↑).
Figure 4.8 illustrates a series of longitudinal sections of the inferior hepatic border obtained by scanning across the liver from left to right. Notice the changes in the liver outline caused by the gallbladder and kidney.
Abnormalities and variants of the inferior border
Fatty liver. Besides increased echogenicity (see p. 53ff.), fatty infiltration of the liver leads to rounding and broadening of the inferior border (Figs. 4.9, 4.10).
Cirrhosis of the liver. The normal liver presents a smooth inferior surface contour. With cirrhosis, regenerative nodules in the liver produce a lobulated contour (Fig. 4.11).
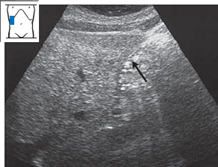
Fig. 4.9 Fatty liver. The angle between the anterior and posterior surfaces of the liver is broadened (↑).
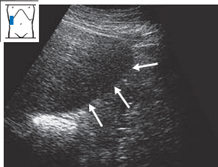
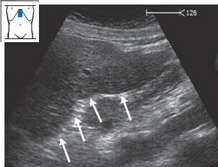
Fig. 4.11 Alcoholic cirrhosis of the liver. The inferior surface of the liver has a nodular appearance (↑↑↑).
Riedel’s lobe. Riedel’s lobe is a tongue-like inferior projection of the right lobe that extends well past the lower pole of the kidney (Fig. 4.12).
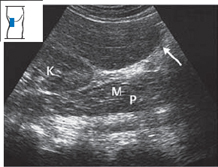
Fig. 4.12 Riedel’s lobe. A tongue-like projection of the right lobe (↑) extends down past the inferior pole of the kidney. Mp = psoas muscle, K = kidney.
Defining the superior border of the liver
Press firmly with the transducer along the right costal arch so that you can scan beneath the ribs at a relatively flat angle.
KEY POINT
Anterior and superior portions of the liver near the diaphragm are often poorly visualized in longitudinal scans.
The superior border of the liver is flat on the left side and convex on the right side. The scanning technique is similar to that for the inferior border. Place the transducer longitudinally to the right of the midline just below the costal arch. Angle upward until the superior border of the liver appears on the left side of the screen. Notice the bright echo return from the diaphragm. The pulsating heart can be seen cranially (left side of the image).
Now scan toward the left in parallel longitudinal sections, following the line of the costal arch, until you reach the end of the liver. Then return to the right and continue the scan along the right costal arch (Fig. 4.13). You will need to apply firmer transducer pressure in this region in order to scan beneath the ribs at a relatively flat angle.
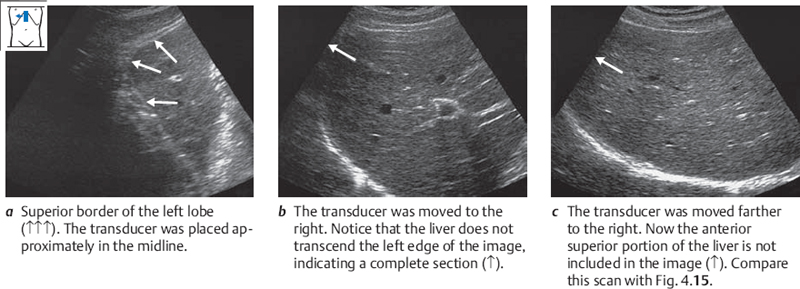
Repeat the longitudinal pass along the superior border of the liver, this time noticing the shape of the hepatic cross section. The superior border of the liver is flat on the left side. The heart rests upon the diaphragm in this area. The superior surface of the liver forms a right angle with its anterior surface (Fig. 4.14). The farther the transducer is moved toward the right, the more convex the surface becomes. At this point you will have to press harder on the transducer and scan beneath the ribs at a relatively steep angle to view the part of the diaphragm that borders the liver. Even so, it is often not possible to define the full cross section of the liver on the left side of the screen, and a portion of the liver will appear cut off (Fig. 4.15).
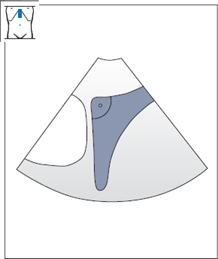
Fig. 4.14 Superior border of the left lobe. Notice the right angle formed by the anterior and diaphragmatic surfaces of the liver.
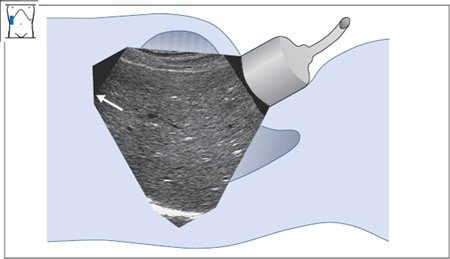
Fig. 4.15 Superior border of the right lobe. Notice that the anterior border cannot be adequately defined.
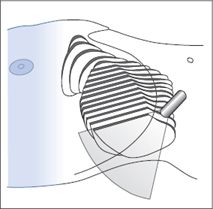
Fig. 4.16 Scanning across the superior border of the liver. Notice that the anterior portions of the right lobe are not visualized.
Try to picture mentally which portion of the liver is not seen. Recall that in a longitudinal scan, the left side of the screen is cranial and the right side is caudal. But as the transducer is angled cephalad, the angle of the scan becomes more horizontal and this rule becomes less valid. With a flat scanning angle, anterior portions of the liver are displayed on the left side of the screen. For our purposes, this means that the hidden, “truncated” portion of the liver cross section is anterior and superior. This blind spot is shown schematically in Fig. 4.16.
Defining the left border of the liver
The left border of the liver was already seen in the longitudinal sections of the superior and inferior borders. Now you will also scan down the left border in transverse sections. Place the transducer in a transverse or slightly oblique position along the costal arch, a little to the left of the midline. Scan up toward the liver beneath the costal arch, angling the probe upward until you see the pulsating heart. Scan at a very steep angle so that the left border of the liver is just visible on the screen. Now scan down the left border by angling the transducer. Notice how the shape of the liver section changes as the scan moves downward, changing from trapezoidal above (Fig. 4.17a) to triangular below (Fig. 4.17b,c).
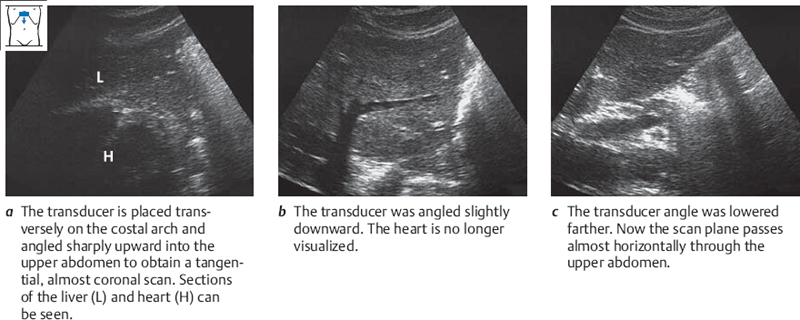
This phenomenon is somewhat difficult to understand, since the left border of the liver does not have a trapezoidal shape even in a high transverse section. But it can be explained by the position of the transducer. Angling up into the liver produces a very tangential scan that does not portray a true upper abdominal transverse section; instead, it produces an almost coronal section. Figures 4.18 and 4.19 explain this phenomenon.
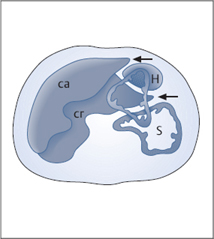
Fig. 4.18 Two transverse sections of the left border of the liver: caudal (ca) in front and cranial (cr) behind. In the cranial section, the stomach (S) and heart (H) are displayed along with the liver. Notice that the left border of the liver forms a sharp angle (←) in both sections.
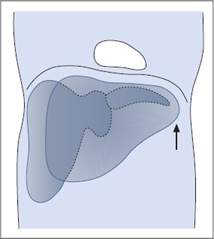
Fig. 4.19 Two coronal sections of the liver: anterior in front and posterior behind. Notice the blunted appearance of the hepatic border (↑) in the anterior coronal section.
In summary, the two figures show the following: As you scan down the hepatic left border, the liver is first imaged in anterior coronal sections. The section of the liver has a trapezoidal shape at this level. But as the scan is angled lower, the more posterior and inferior portions of the liver are displayed in transverse planes. These sections show a more triangular, sharply angled border.
Systematic survey of liver volume
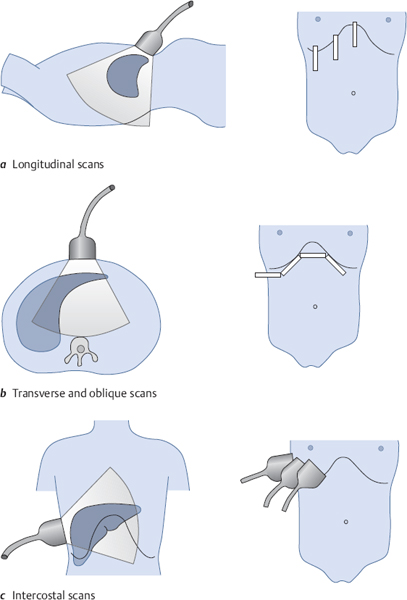
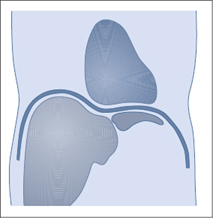
Now that you have acquired a feel for the boundaries of the liver, you will learn how to survey the total liver volume. You should get to know the liver in three dimensions. Recall that three basic scanning approaches are available: longitudinal (Fig. 4.20a), subcostal transverse or oblique (Fig. 4.20b), and intercostal (Fig. 4.20c).
Scanning across the liver in longitudinal sections
The first step in defining the inferior and superior borders of the liver has already been taken: scanning across the organ in longitudinal sections, making one pass over the inferior portions and another over the superior portions (Figs. 4.4 and 4.13). Remember that the superior portions of the right lobe are a “blind spot” in the longitudinal liver survey.
Scanning the liver in subcostal oblique and transverse sections
Whereas the longitudinal liver sonography is done in parallel planes, subcostal scans are swept through the liver in a fan-shaped pattern. Four or five of these sweeps are necessary for a complete survey. The scans proceed from left to right, following the costal margins.
Place the transducer in the epigastrium to the left of the midline, as for imaging the left hepatic border, and sweep the scan in a fan-shaped pattern as you did before (Fig. 4.21).
You can also hold the transducer in a slightly oblique position, parallel to the costal margin. The liver can be scanned in the same fashion from other probe placements (Figs. 4.20b, 4.22).
KEY POINTS
Follow a three-step routine for intercostal scanning:
1 Scan through the liver in a fan-shaped pattern.
2 Slide the transducer along the ICS and repeat step 1.
3 Move the transducer to the next ICS, repeat steps 1 and 2.
Repeat this pass and notice that the dome of the left lobe can be seen relatively clearly while that of the right lobe is indistinct, especially anteriorly. The left lobe is easier to visualize because it is being scanned through the epigastrium and because the left hemidiaphragm is lower than the right (Fig. 4.23).
Scanning the liver in intercostal sections
The third scanning approach to the liver is the one through the intercostal spaces. Picture the course of the ribs in the lateral and anterior portions of the costal arch. Reinforce this by palpating the subject’s ribs. The scan planes are directed between adjacent ribs.
Intercostal scans are part of every upper abdominal ultrasound examination. To help you learn this approach, we shall describe it here in considerably more detail than is usually done.
Intercostal scanning follows a three-step routine:
1 Scan through the liver in a fan-shaped pattern.
2 Slide the transducer along the intercostal space and repeat step 1.
3 Move the transducer to the next intercostal space and repeat steps 1 and 2.
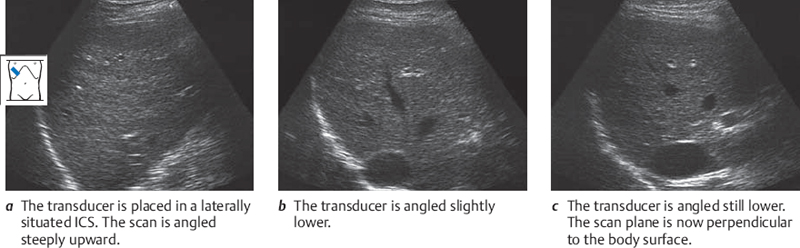
Place the transducer in a laterally and somewhat posteriorly situated intercostal space (ICS). Take care to direct the scan plane parallel to the ribs. Define the liver, and angle the transducer to sector the scan through the accessible liver segment (Fig. 4.24). Then slide the transducer cranially and caudally within the same ICS and repeat the sectoring maneuver. Next, move the transducer to the medially adjacent ICS and carefully repeat the process. Stick to this routine in the beginning, even if it seems somewhat tedious.
When you have done this exercise, picture the portions of the liver that you have scanned. The areas located close to the chest wall and transducer are the areas that are poorly visualized in subcostal longitudinal, oblique, and transverse scans. The posterior portions of the liver located farther from the transducer were already visualized through the subcostal approach.
 Organ Details
LEARNING GOALS
 Evaluate the shape of the liver.
 Determine the size of the liver.
 Evaluate the parenchymal pattern.
 Evaluate the veins, portal vessels, ligaments, and fissures within the parenchyma.
Shape
The outlines of the liver were covered in the previous section. Deviations from normal findings include an increased angle at the anterior border of the liver, blunting of the hepatic border, and irregularities in the normally smooth liver contour (see p. 46).
Size
The craniocaudal extent of the right lobe is generally said to be 12–13 cm at the midclavicular line, although the normal liver is quite variable in size.
Parenchymal pattern
The parenchyma of the liver shows a moderately dense, homogeneous echo pattern. The renal parenchyma, which is slightly hypoechoic to the liver, is used as a reference for evaluating hepatic echogenicity (Fig. 4.25).
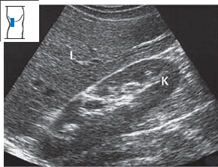
Fig. 4.25 Normal echo pattern of the liver. The parenchyma of the liver (L) has approximately the same echogenicity as the renal parenchyma (K).
Abnormalities of the liver parenchyma: diffuse changes
Fatty liver. One of the most common findings at ultrasound is increased echogenicity of the liver due to fatty infiltration. This may be caused by overeating, alcohol abuse, hepatitis, diabetes mellitus, disorders of lipid metabolism, or medications. The fatty liver is characterized by increased echogenicity relative to the renal parenchyma (Fig. 4.26) and distal sound attenuation (Fig. 4.27). Scans may also show rounding of the inferior hepatic border (see p. 46) and narrowing of the hepatic veins (see p. 61).
Bright portal vessels. Occasionally, cross sections of the portal vessels appear as very bright echoes in a completely healthy liver (Fig. 4.28).
KEY POINT
The leading criterion in the differential diagnosis of focal hepatic lesions is echogenicity.
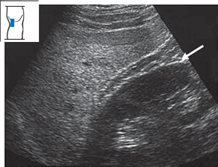
Fig. 4.26 Fatty liver. The echo pattern of the liver is markedly denser than that of the kidney. Note also the conspicuous perirenal fat (←).
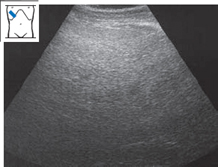
Fig. 4.27 Fatty liver. The sound is markedly attenuated in the deep part of the field. Vessels are poorly delineated. Hypertriglyceridemia.
Cirrhosis of the liver. Cirrhosis of the liver is characterized by an unsettled parenchymal pattern with fine or coarse granularity (see also p. 61) (Fig. 4.29).
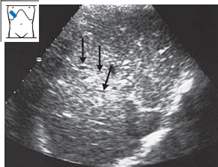
Hepatic metastases. Extensive metastatic deposits can create a very nonhomogeneous pattern that involves the entire liver and may be difficult to interpret (Fig. 4.30).
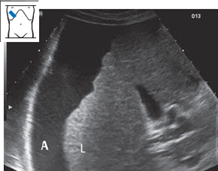
Fig. 4.29 Cirrhosis of the liver. The echo pattern shows increased density. The liver (L) is small and surrounded by ascites (A).
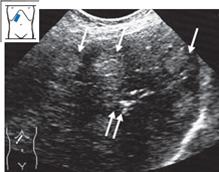
Fig. 4.30 Liver permeated by metastases. Ultrasound shows a very nonhomogeneous pattern, consisting of echogenic areas (↓) and calcifications (↑↑) in a very unsettled parenchyma.
Abnormalities of the liver parenchyma: circumscribed changes
Circumscribed changes in the liver parenchyma are often challenging for the sonographer. Many findings can be adequately interpreted based on their ultrasound features, whereas others will require additional studies. When a circumscribed change is discovered in the liver, the examiner should systematically evaluate the following features:
 Echogenicity: echo-free, hypoechoic, isoechoic, echogenic, highly echogenic, posterior enhancement, shadowing.
 Shape: round, oval, scalloped, irregular, triangular, polygonal.
 Margins: sharp, ill-defined.
 Size: measured in at least two dimensions.
 Internal structure: homogeneous/nonhomogeneous, hypoechoic/hyperechoic border, hypoechoic/hyperechoic center.
 Number: solitary, multiple, numerous.
 Location: intrahepatic (right, left, segment), perivascular.
 Relation to surroundings: expansile, infiltrating.
Echo-free lesions
Solitary nonparasitic cysts. These lesions are clearly visible when approximately 5mm or larger. Solitary hepatic cysts, usually congenital, are found in up to 4% of the adult population. They are characterized by a round or oval shape, smooth margins, a thin wall, no internal echoes, posterior acoustic enhancement, and lateral edge shadows (Figs. 4.31, 4.32). They can be diagnosed sonographically. Multiple cysts are much less common (Fig. 4.33).
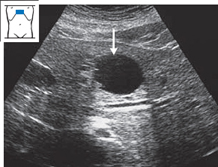
Fig. 4.31 Hepatic cyst (↓). Notice the smooth, round margins, the echo-free cyst wall, the posterior acoustic enhancement, and the lateral edge shadows.
| Nonparasitic hepatic cyst | |
| Hydatid cyst | |
| Concentric biliary tract dilatation (Caroli syndrome) | |
| Liver abscess | |
| Liquefying metastasis | |
Cystic liver. Hereditary cystic liver disease is characterized by cysts of varying size that permeate the liver (Figs. 4.34, 4.35).
Parasitic cysts. The cysts caused by infection with Echinococcus granulosus are characterized by an echogenic wall. It is common to find septations and adjacent daughter cysts (Fig. 4.36).
The differential diagnosis of echo-free hepatic lesions is reviewed in Table 4.1.
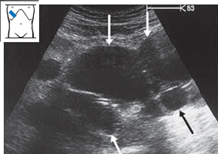
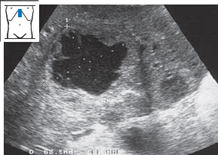
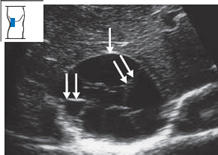
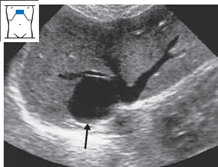
Fig. 4.36 Echinococcus granulosus infection. Large, loculated cyst (↓) with conspicuous septa (↓↓). Note the relatively bright wall echoes.
Hypoechoic lesions
Hypoechoic lesions in the liver can be difficult to interpret in some cases. Lesions with a round or oval shape are always suspicious for metastasis. Other causes are listed in Table 4.2.
| Metastasis | |
| Adenoma | |
| Focal nodular hyperplasia | |
| Atypical hemangioma | |
| Hepatocellular carcinoma | |
| Abscess | |
| Focal sparing from fatty infiltration | |
| Hematoma | |
Metastases (Figs. 4.37–4.42). Hepatic metastases may appear as hypoechoic lesions (Figs. 4.37, 4.38), or they may be isoechoic or hyperechoic. They may be relatively homogeneous, especially when small, but typically appear as a target lesion with a hypoechoic rim (Figs. 4.40, 4.41).
Related posts:
Stay updated, free articles. Join our Telegram channel

Full access? Get Clinical Tree


