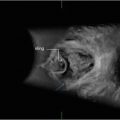
Fig. 2.1
This image displays the characteristics of a good quality image by virtue of technical settings of user-controlled variables as well as proper labeling
Transducer Selection
The first step in performing ultrasound is to select the transducer with the optimal shape. A linear-array transducer produces a rectangular image and is generally used for scrotal ultrasound (Fig. 2.2). A curved-array transducer produces an image which is trapezoidal in shape and is generally used for abdominal and pelvic ultrasound (Fig. 2.2). The curved nature of the probe allows gentle pressure on the patient’s abdomen or flank resulting in contact of the entire transducer face with the skin. Endocavitary probes (transvaginal and transrectal probes) are curved array probes with trapezoidal image displays.

Fig. 2.2
(a) The linear array transducer produces a rectangular image field. (b) The curved array transducer produces a trapezoidal or pie-shaped image. The shape of the transducer affects the divergence of the wave as the wave propagates in the body
Transducers are usually multifrequency, meaning the frequency can be switched electronically over a range of frequencies (e.g. 3.5–5.0 mHz for transabdominal pelvic ultrasound). It is important to select the highest frequency which has adequate depth of penetration for the anatomic area of interest. The higher the frequency the greater the axial resolution and the better the anatomic representation of the image. However, the higher the frequency the lower the depth of penetration (Fig. 2.3).
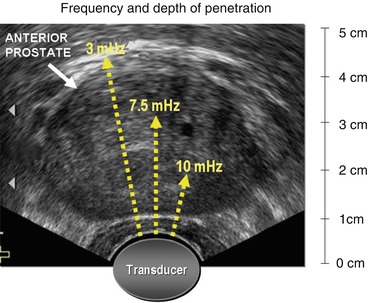
Fig. 2.3
The selection of a transducer with the frequency of 7.5 mHz reflects the trade off between depth of penetration and good axial resolution. In this axial image of a large prostate, a lower scanning frequency may be needed to adequately visualize the anterior prostate
Scanning Environment
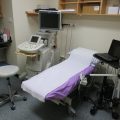
To produce the best quality image the sonographer should arrange the scanning environment so that access to the patient and equipment are optimized (Fig. 2.4). The table should be positioned at a height which allows the sonographer to stand or sit in a comfortable position so that the sonographer is able to stabilize the transducer against the patient’s body. This minimizes unwanted movement of the transducer and allows the sonographer to maintain the orientation and position of the transducer while adjusting machine features.
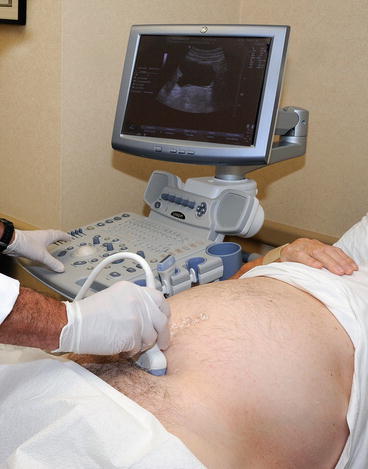
Fig. 2.4
The configuration of the equipment and proximity to the patient are critical in maximizing comfort, efficiency, and accuracy during scanning and documentation
The sonographer should be positioned so they are able to comfortably reach the physical console or touch screen in order to adjust the machine settings. Many ultrasound units provide the ability to freeze and unfreeze the transducer via a button on the transducer itself or by a footswitch. In either case the sonographer must be able to scan the patient with one hand while manipulating the console and documenting with the other hand.
The sonographer must have a clear direct view of the monitor. The angle of the monitor should be adjusted for viewing by the sonographer. The brightness settings on the monitor need to be adjusted for the conditions under which the scan is being performed. In general, dimming the room lights improves the ability to evaluate the image on the monitor.
Monitor Display
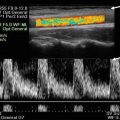
It is important when performing an ultrasound examination to understand the information that is being displayed on the monitor. Patient demographic information, type of exam and facility should be entered. The monitor will usually display information regarding which probe is active, the frequency of the probe, and the magnification of the image (Fig. 2.5). Information regarding overall gain and other settings is available on the monitor. Typically there will be a TGC (time-gain compensation) curve displayed on one side of the image as well as color bar which demonstrates the range of pixel brightness or hues available. In addition, there will be gradient markings on one side so that depth of field can be appreciated.
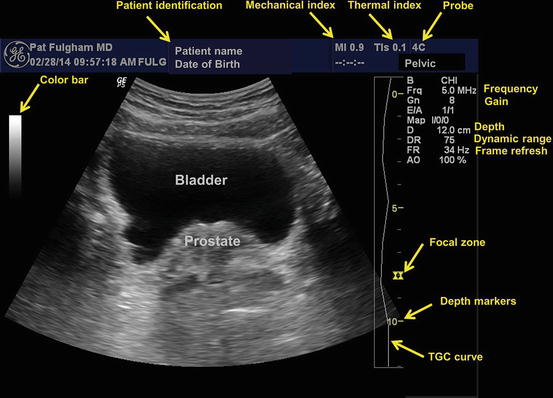
Fig. 2.5
Machine settings and icons displayed on the monitor help with adjusting machine settings to optimize image quality
Orientation
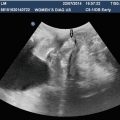
By convention, when scanning organs in the sagittal view, the upper pole of the organ (e.g. kidney or testis) is to the left of the screen and the lower pole is to the right of the screen (Fig. 2.6).
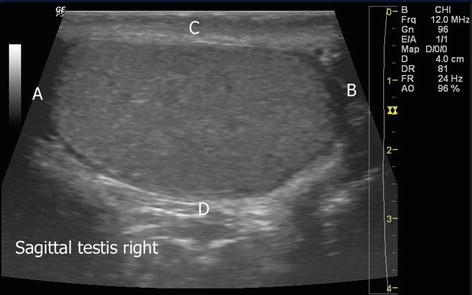
Fig. 2.6
In this sagittal image of the right testis, the superior pole of the testis (A) is to the left, the inferior pole of the testis (B) is to the right. The anterior aspect of the testis (C) is at the top of the image and the posterior aspect (D) at the bottom. Without the label (Sagittal testis right) there would be no way to distinguish the right from the left testis
In transverse scanning the right side of an anatomic structure is displayed on the left side of the image just as it would be when evaluating a conventional radiograph. These conventions should always be followed when documenting an ultrasound examination; however, it may be useful to also demonstrate the orientation of the probe using graphics or icons. When paired structures such as the kidneys or testes are imaged it is particularly important to designate the organ as right or left.
User-Controlled Variables
One of the most commonly required adjustments during ultrasound scanning is an adjustment to the overall gain. The gain is a control which determines the degree to which the electrical signal produced by a returning sound wave when it strikes the transducer will be amplified for display. This needs to be differentiated from acoustic output which is defined as the power or amplitude of the afferent wave which is generated by the transducer.
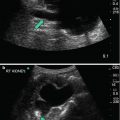
Both gain and acoustic power can be controlled by the operator; however, acoustic output is limited by the manufacturer in compliance with industry safety standards [1]. In general, when the gain is increased the resulting image is brighter. When there is excessive overall gain the image often appears bright and washed out. When there is insufficient overall gain the image is often dark and it is difficult to distinguish between adjacent structures (Fig. 2.7).
 Essentials for Setting Up Practice in Clinician Performed Ultrasound
 Practical Application of Ultrasound in the Assessment of Pelvic Organ Prolapse
 Pelvic Ultrasound in the Assessment of Female Voiding Dysfunction
 Endoanal Ultrasound of Pelvic Floor
 Principles and Applications of 3D Pelvic Floor Ultrasound
 The Physics and Technique of Ultrasound


Related posts:
Essentials for Setting Up Practice in Clinician Performed Ultrasound
Practical Application of Ultrasound in the Assessment of Pelvic Organ Prolapse
Pelvic Ultrasound in the Assessment of Female Voiding Dysfunction
Endoanal Ultrasound of Pelvic Floor
Principles and Applications of 3D Pelvic Floor Ultrasound
The Physics and Technique of Ultrasound
Stay updated, free articles. Join our Telegram channel
Full access? Get Clinical Tree
