Abstract
Cardiovascular magnetic resonance (CMR) is a noninvasive cardiac imaging modality that can perform multiparametric evaluation of the heart and blood vessels, including structure, function, tissue characterization, perfusion, flow and metabolism. This chapter reviews the basic principles of CMR and expands on some of the developing techniques that hold promise for clinical application, including fast data acquisition, combining perfusion imaging with tissue characterization techniques in the assessment for ischemia, novel quantitative techniques such as T1- and T2-mapping, 4-dimensional flow imaging to assess flow dynamics within cardiac chambers and great vessels, and how CMR may assess cardiac metabolism without radioactive tracers using magnetic resonance spectroscopy (MRS) and hyperpolarized carbon-13 ( 13 C) imaging.
Keywords
Cardiovascular magnetic resonance and spectroscopy, Perfusion, Mapping techniques, 4D flow, Hyperpolarization
Acknowledgments
The authors of this chapter acknowledge BioMed Central as the original publisher of selected figures in this chapter as indicated by references to the original authors and publications. The authors also acknowledge Oxford University Press as the original publisher of Figure 6.16 reproduced with permission from Schroeder et al., hyperpolarized C-13 magnetic resonance reveals early- and late-onset changes to in vivo pyruvate metabolism in the failing heart [ ].
VMF is funded by the National Institute for Health Research (NIHR) Oxford Biomedical Research Centre based at The Oxford University Hospitals NHS Trust and the University of Oxford. MDR is funded by the Medical Research Council. DT is funded by a British Heart Foundation Senior Research Fellowship (FS/14/17/30634). SN acknowledges support from the British Heart Foundation Centre of Research Excellence, Oxford, and from the Oxford NIHR Biomedical Research Centre.
6.1
Introduction
The nuclear magnetic resonance (NMR) phenomenon was first demonstrated in 1938 and applied to imaging in the early 1970s, with the first clinical scanners available from the late 1980s. Owing to the challenges of imaging the moving heart, cardiovascular magnetic resonance (CMR) only emerged as a clinical tool in the 1990s when high-performance gradient systems and advances in pulse sequence design allowed for the acquisition of high-quality static and cine images of the heart. A key property of CMR is its unique ability to perform multiparametric tissue characterization, including edema, scar, viability, perfusion, and blood flow. Thus, CMR has the capability to distinguish among acute, chronic, ischemic, and nonischemic etiologies, making it an attractive clinical tool to evaluate the cardiac patient.
In this chapter, we will review the basic principles of NMR and expand on some of the developing techniques that hold promise for clinical applications as the field continues to advance. Clinical applications will continue to stipulate shorter examination times for efficient workflow, so the section on fast imaging techniques will explore technical advances that aim toward this goal. Assessment for coronary artery disease (CAD) and ischemia is currently the top indication for CMR, and we shall discuss how combining perfusion imaging with tissue characterization techniques provides comprehensive information in aiding decision making for the patient with CAD. Novel techniques such as T1- and T2-mapping allow direct quantification of myocardial characteristics and comparisons within and between individuals and are sensitive to a wide range of myocardial pathologies, promising to provide additional disease detection beyond conventional CMR techniques. Four-dimensional flow imaging can assess flow patterns and hemodynamics within cardiac chambers and great vessels, which may be useful in the evaluation of congenital heart disease and diseases of the aorta. Finally, we will review how CMR may assess cardiac metabolism without the need for radioactive tracers using magnetic resonance spectroscopy (MRS) and hyperpolarized carbon-13 ( 13 C) imaging.
6.2
Basic principles of NMR
The principle of NMR is that when subjected to a magnetic field, nuclei with different spin states are split into different energy levels, allowing them to absorb and re-transmit electromagnetic radiation [ ]. The frequency of the electromagnetic radiation and the amplitude of the signal both increase with the applied field strength. At the field-strengths used in clinical imaging, this electromagnetic radiation is in the radiofrequency (RF) range (e.g., approximately 63 MHz at 1.5 tesla (T) for the protons of hydrogen in water). Because of their biological abundance, hydrogen nuclei ( 1 H or protons) are the dominant nuclei used in CMR.
Other than 1 H, all nuclei with an odd number of protons or neutrons have net nuclear spin and can be used to generate NMR signal. For human cardiac applications, these are typically limited to phosphorus ( 31 P) [ ], carbon (via its low natural abundance isotope 13 C), and sodium ( 23 Na). The NMR phenomenon is also sensitive to air and the elements, gadolinium, dysprosium, iron, and manganese, for example, but this is by their influence on the NMR visible nuclei.
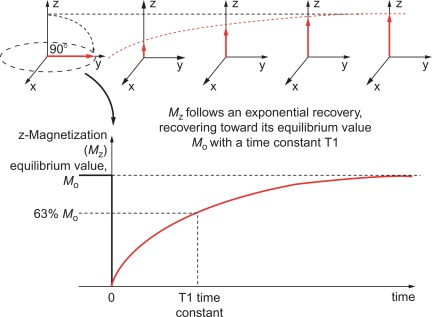
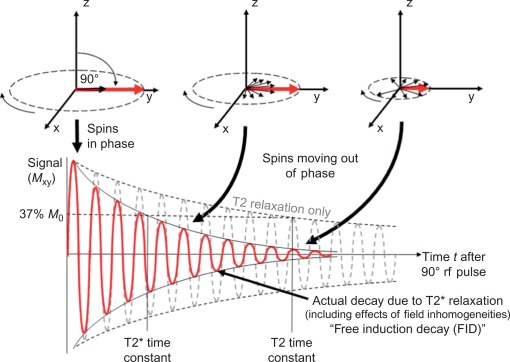
The fundamentals of NMR and, hence, MRI are the large magnetic field that generates different energy levels for the nucleus. The term “spin state” is used to describe the magnetization of the nuclei. The natural spin state for the magnetization is for it to be aligned with the applied magnetic field of the magnet. It is possible to excite this spin system using RF pulses that rotate the spin state so that the spins no longer point along the direction of the magnetic field, but will precess (spin) about that direction. After excitation, the spin system will continue to transmit an RF signal, which is due to the components of the spin in the plane perpendicular to that of the magnet (the transverse plane). This transverse component of the spin system (also known as transverse magnetization) will decay with the characteristic decay time of T2, simultaneously the spin system (magnetization) will recover back to its natural (thermal equilibrium) state with the characteristic decay time of T1.
After excitation by an RF pulse, the behavior of the protons is governed by the relaxation parameters T1, T2, and T2* ( Figures 6.1 and 6.2 ) and described later on. These depend on the microscopic environment of water and fat within the tissues. The signal also depends on the number of nuclei present, their motion, and the pulse sequence. Signals are encoded and located through the use of magnetic field gradients that alter the frequency of the nuclei’s precession. The principle of spatial encoding involves the use of magnetic field gradient, which results in the resonant frequency of precession varying from one side of the patient to the other. This variation in frequency means that we can excite a single position in space if we apply a pulse of a specific RF frequency. Further, we can then change the orientation of the field gradient and collect the re-transmitted RF signal from the sample. This signal contains frequency components that are proportional to the amount of material along the direction of the field gradient. By using magnetic field gradients and these types of approaches, it is possible to fill a complete grid with the frequency components of the image. This grid is known as k -space. Fourier transformation of the k -space data yields an image of the patient. The pulse sequence defines the types and timing of the RF and gradient pulses used to encode an image. Manipulation of pulse sequence parameters allows emphasis on different characteristics of the nuclei, enabling the tailoring of diagnostic images that is the powerful feature of MRI [ ].
6.2.1
Intrinsic MR contrast
Intrinsic MR contrast refers to the use of the natural differences in NMR parameters of tissue, and these tend to describe the relaxation parameters T1, T2, T2*, the amount of fat, and the proton density of water. At a deeper level, intrinsic contrast is more subtle, as any single pixel of an MRI image includes many millions of protons in many thousands of different environments, which flow, perfuse, diffuse, interact, and react in a manner that all can influence the MRI signal. To deal with this complexity/elegance, we generally ignore the details and (pragmatically) simplify describing each image pixel as having a single T1, T2, T2* and amounts of fat and water, and call that intrinsic contrast.
The T1 (or spin-lattice) relaxation time of the protons depends on the way the protons can reorganize back their thermal equilibrium state after an RF pulse excitation. Pure water free of other constituents has a long T1 (many seconds), but T1 is shortened by interaction with cell membranes. Protons in fat molecules have short T1. By imaging quickly with large RF pulses, it is possible to suppress protons with long T1, which emphasizes protons with short T1, a technique known as T1-weighting.
The T2 (or spin-spin) relaxation time is affected by similar factors as T1 so free water has long T2 but water bound to proteins has very short T2. The T2 relates to the time for which a nucleus will transmit its RF signal after it has been excited by an excitation pulse in a spin-echo acquisition. T2 decay is not simply caused by local dephasing of the spin state in a nonuniform magnetic field (like T2* below) but is due to the component of this dephasing that cannot be refocused. Mechanistically, T2 decay is explained as being due to the random motion of spins in a nonuniform magnetic field, although in practice, T2 has many varied stochastic sources such as magnetization exchange, dipolar couplings, and chemical reactions. Delaying the time of acquisition after the spin system has been excited attenuates tissues with short T2, emphasizing nuclei with long T2 (e.g., free water). A classic application of T2-weighted imaging is in the detection of edema.
T2* relaxation is similar to T2, but requires the use of a gradient echo acquisition. T2* decay is caused by the individual spins precessing at different frequencies and, thus, moving out of phase with each other, which results in signal cancelation. T2* is extremely sensitive to iron, and is also affected by the oxygenation level of the tissue. These sources of microscopic magnetic field inhomogeneity result in dephasing of the spins and cause rapid signal decay, hence, shortening T2*. Large-scale magnetic field inhomogeneity will also influence the T2* and so care must be taken to ensure that this source does not confound T2* measurements.
6.2.2
MR contrast agents
Injectable contrast agents have multiple uses. Gadolinium-based agents shorten the T1 of protons that can exchange spin with the complexed paramagnetic ion. This increases the signal of those protons with appropriate T1-weighted pulse sequences. This approach finds application in perfusion imaging, where the blood labeled with gadolinium increases the signal where that blood perfuses, hence, providing differential contrast agents that have not yet been visited by the gadolinium [ ]. The signal increase is also valuable when performing angiography to yield images that are of adequate signal to noise and high resolution. A second feature of gadolinium-based contrast agents is that they do not enter intracellular space such that in regions of extracellular space expansion the average gadolinium concentration is higher and the T1 will be shortened. This property of contrast agents is exploited in scar imaging by CMR. Iron-based particles also shorten the T1 but their dominant effect is shortening the T2* with a lesser effect on T2. Complex molecules incorporating iron or gadolinium may be used as novel targeted contrast agents but no clinically approved agent is yet available.
6.2.3
Morphological imaging
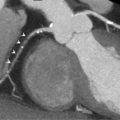
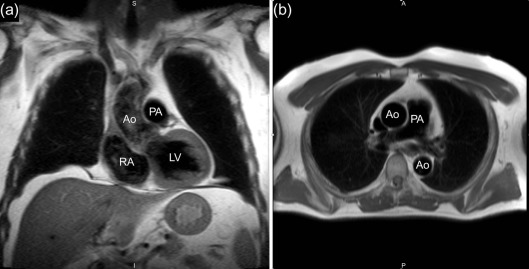
The simplest form of cardiac imaging is morphological imaging in which the goal is to determine the basic structure of the anatomy. In this case, it is desirable to differentiate the blood from the tissue. One way to achieve this is to suppress the signal from blood using a “black-blood” imaging method. Blood can be suppressed in a number of ways, but the classic approach is through the use of two inversion RF pulses: one that is slice selective to the slice of interest and the other which inverts the magnetization in the whole sample. This is followed by imaging when the magnetization of the blood is at the null point, just as the recovering magnetization crosses zero. The blood, owing to its motion, observes only one of these pulses, while the static tissue is exposed to both pulses and is thus unaffected. Careful selection of the time delay after the second inversion pulse allows images devoid of blood to be obtained, hence, the major vessels can be depicted with high quality in a fast-spin-echo or HASTE acquisition ( Figure 6.3 ). In each case, ECG gating is used to freeze the cardiac motion in a single frame and only a single phase of the cardiac cycle is imaged.
6.2.4
Cine imaging
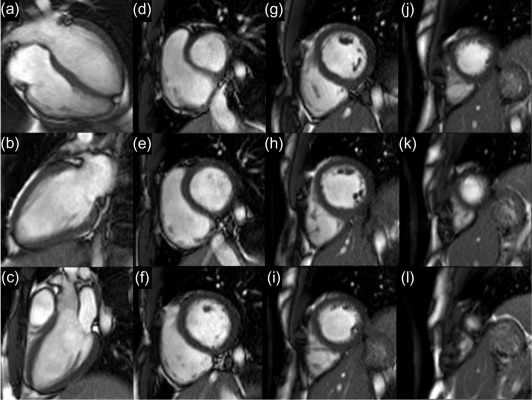
Cine imaging generates a frame-by-frame movie of the heart, usually based on a composite of acquisition over multiple heartbeats and using ECG gating. Typically, images are acquired during a breath-hold lasting between 1 and 10 heartbeats. In this interval it is possible to collect anything between a single high-resolution (1 mm × 1 mm × 3 mm) image or lower-resolution images encompassing the whole heart. The other parameter of the acquisition that is easily adjusted is the frame-rate of the resultant movie. Typically, this needs to exceed 14 frames to ensure an accurate depiction of the cardiac motion. Increased frame-rate, smaller voxel dimensions, and larger numbers of slices all increase the time required for image acquisition, hence, there is an inevitable trade-off. Frequently, a complete 3D depiction of the myocardium is obtained through collecting multiple parallel images that slice through the short-axis of the heart, which are often collected in a number of serial breath-holds ( Figure 6.4 ).
6.2.5
Perfusion imaging
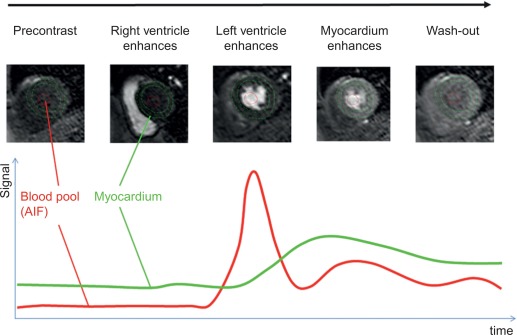
Rest perfusion imaging using gadolinium contrast agents can be used to characterize masses and tumors, while first-pass perfusion imaging under rest and stress conditions is widely used to assess for myocardial ischemia ( Figure 6.5 ). The passage of the contrast agent through the myocardium is monitored by acquiring T1 weighted images at every heartbeat. With current methods, at least three myocardial slices can be imaged at every heart beat with an in-plane spatial resolution of less than 3 mm. Pharmacologic stress can be induced using vasodilators, such as adenosine, regadenoson, and dipyridamole, or inotropic agents such as dobutamine. Adenosine is a nonselective adenosine receptor agonist with potent vasodilator properties and is the most commonly used vasodilator for stress perfusion CMR imaging. The coronary vasculature downstream a stenosed artery is nearly maximally dilated at rest, with little further response under vasodilator stress in contrast to normal coronary vasculature, resulting in a relative hypoperfusion in the area subtended by the stenosed artery. Regadenosine is a newer, selective adenosine (A2A) receptor agonist, which can be administered as a bolus, while dipyridamole blocks endogenous adenosine reuptake to induce vasodilation indirectly. Dobutamine is a selective beta-1 adrenergic agonist that directly increases heart rate and contractility, typically used for the detection of ischemia-induced wall motion abnormalities, rather than first-pass perfusion imaging due to the tachycardia induced.
6.2.6
Flow imaging
Flow imaging can be used to measure the velocity of moving blood to assess for valvular lesions (stenotic or regurgitant) or blood flow within vessels and conduits. Phase-velocity imaging works by encoding the position of the blood, waiting a short amount of time and then un-encoding the position. The change in position will result in imperfect un-encoding of the position, which appears as a phase change of the signal that is proportional to the distance the blood has moved (and hence its velocity). In-plane flow imaging allows visual assessment of a jet along its course but does not permit flow quantification and may underestimate the velocity of narrow jets due to partial volume effects from the slice thickness. Through-plane flow has higher in-plane spatial resolution and allows for flow quantification as there is full, cross-sectional coverage of the jet. For very high velocity or turbulent flow, quantification can suffer from phase-shift errors and underestimation of the peak velocity due to its temporal resolution (25–45 ms), but CMR has the advantage of aligning velocity jets in any plane. Highly irregular rhythms will lead to inaccuracies in flow measurements, but dedicated arrhythmia sequences may improve accuracy at the cost of longer scan times.
6.2.7
MR angiography
In addition to quantifying flow, it is also possible to design pulse sequences that maximize the signal from blood to enable angiographic images. Typically these acquisitions are performed in 3D to generate a complete image of the vascular tree, which can be reconstructed on viewing workstations to allow these data to be examined carefully after acquisition. Several mechanisms can be employed to generate contrast, including intrinsic T2 contrast, in-flow or, with the use of contrast agents, T1 shortening to provide extremely rapid angiographic imaging.
6.2.8
Strengths and weaknesses of CMR
CMR has many strengths as a clinical and research tool. It does not use ionizing radiation and permits imaging in any plane. Another key advantage of CMR lies in the ability to accurately assess cardiac structures, function, and to perform tissue characterization, distinguishing ischemic from nonischemic pathologies. The quality of images can be affected by motion (cardiac, respiratory, or patient), so that image quality in patients with significant tachyarrhythmia or difficulty in breath-holding or remaining stationary can be impaired. Contraindications to CMR include claustrophobia, very large patient size and having an MRI-incompatible implant. Additionally, significant renal failure with an estimated glomerular filtration rate (eGFR) of less than 30 ml/min is a relative contraindication to contrast-enhanced CMR due to the inability to clear the gadolinium-based contrast agents with a risk of nephrogenic systemic fibrosis (NSF), although measures such as using the lower-risk macrocyclic chelates and arranging for dialysis after the CMR scan may help reduce the risk of NSF.
6.3
Fast imaging
6.3.1
Introduction: the challenge of imaging quickly
6.3.1.1
Image space versus k -space
CMR is based on techniques developed within the more general field of magnetic resonance imaging (MRI). In MRI, the image can only be collected over a period of time, as the data that constitute the final image must be collected sequentially. This signal data is then stored in a matrix known as k -space, and undergoes a mathematical transformation (the Fourier transform) to generate an image. Patient motion during acquisition will result in failure of the Fourier transform to properly reconstruct the image; resulting errors can be considerable and extremely difficult to disentangle. Therefore, over the period of image collection, it is essential for that body part to be stationary. Clearly this represents a significant challenge in the case of the human heart, owing both to the beating, but also to the asynchronous and variable breathing patterns.
6.3.1.2
The need for speed
Typical image acquisition times for MRI of noncardiac organs are one to two minutes, and even with advanced cardiac MRI it is difficult to obtain good image quality unless at least 200 ms of data are collected. This permits three basic methods for data collection:
- 1)
Collect data over approximately 200 ms during a phase of the cardiac cycle where cardiac motion is minimal
- 2)
Freeze the breathing motion (breath-hold or some form of respiratory triggering) and collect some of the data over several heartbeats (e.g., acquire for 20 ms on each of 10 heartbeats)
- 3)
Collect the data faster than 200 ms (e.g., 60 ms), accepting the resultant lower image quality
Over these shorter intervals, the heart is sufficiently still to be captured accurately by the imaging sequence. ECG gating is used to synchronize the scanner acquisition to the cardiac cycle and breath-hold instructions are typically issued through headphones to the subject.
6.3.1.3
Technical restrictions (SAR, SNR, and gradient stimulation issues)
Traditionally, MR image quality was limited by the MR scanner hardware capabilities; however, with commercial improvement of scanner performance, it is now limited mainly by subject characteristics [ ]. The excitation RF pulses used to stimulate the sample benefit from being short and of high amplitude, but the high-power RF pulses deliver heat into the subject. The specific absorption rate (SAR) defines how much RF power can be safely deposited into the patient and is restricted for MRI scans to limit patient heating effects. To sample k -space rapidly, magnetic field gradients are switched on and off rapidly. These changes in magnetic fields induce small currents into the subject, which can stimulate the peripheral nerves. This can be perceived as tactile stimulation or vibration on the skin; if the gradient field switching were faster, this sensation could become painful, and so gradient field switching rates are limited by the scanner hardware to prevent this. Finally, the image quality is limited by the signal-to-noise ratio (SNR) in the images; the NMR phenomenon exerts a weak effect so only a small fraction of the protons in the body is observed in an MRI scan, which limits the sensitivity and spatial resolution of images.
6.3.2
Real time versus segmentation
6.3.2.1
The benefits of real-time imaging
Imaging in real time has several benefits, as the acquisition is very fast (as short as one heartbeat), does not require breath-holding, and ECG gating is not absolutely required (although it is desirable). Further, for irregular heart rhythms, it is possible to obtain images of the variable patterns of ventricular filling and contraction. Real-time imaging is especially useful for cine and flow imaging in patients with irregular tachyarrhythmia such as rapid atrial fibrillation or frequent ectopic heartbeats.
6.3.2.2
The benefit of collecting over multiple heartbeats
In practice, collecting images in real time is difficult due to the limited amount of time available to collect the data, which compromises image quality. Image quality may be improved by collecting parts of the image (in k -space) during separate cardiac cycles. This segmentation of k -space requires good quality ECG gating and breath-holding but results in higher resolution and better image quality.
6.3.2.3
Issues with real-time data
Real-time imaging may appear to be the holy grail for cardiac function assessment, but there are deeper considerations [ ]. Care must be taken to analyze data that were acquired without ECG gating, breath-holding, or assumptions of regular periodicity. For instance, in calculating the left ventricular ejection fraction, the volume of the heart is determined by adding the volume of a series of slices; if these data (from real time) cannot be aligned due to the mismatch of breathing phases, if the position of the imaging slice is not known, or if data from irregular heartbeats were combined, significant errors will arise. For these reasons, most data are presently collected in a segmented fashion using ECG-gating and breath-holding. It is likely that future work will move toward real-time imaging and address the aforementioned challenges, but at present these systems are not yet in place.
6.3.3
Sampling the data faster
6.3.3.1
Use of echo planar imaging (EPI) and spiral methods
Up until now, the methods of acquisition have focused on Cartesian acquisition schemes based primarily on balanced SSFP techniques. This approach is the stalwart of cardiac MR imaging and has driven its transformation from an interesting research tool to clinical workhorse. Data may be collected more quickly using echo planar imaging (EPI) [ ], or spiral imaging methods [ , ]. Both of these methods use complex magnetic gradient field waveforms to contiguously sample large sections or even the whole of k -space in a short time (~ 20 ms). The approaches have found utility for methods such as perfusion imaging, where rapid sampling is essential.
6.3.3.2
Use of higher gradient performance
If k -space can be sampled faster, then it is possible to either improve imaging speed or quality. The simplest way to image faster would be to apply stronger imaging gradients that switch more quickly. However, as discussed earlier, with linear gradient systems, there is a limit to avoid problematic electrical currents being induced and peripheral nerve stimulation in the subject. Alternative approaches are being developed with gradient field systems that incorporate nonlinear gradients. These allow much higher gradient fields and switching rates with their associated benefits, but have much less of an issue with induced electrical currents and peripheral nerve stimulation. These technologies are not yet available on standard clinical scanners but are an active area of research.
6.3.4
Less is more: sampling smarter
6.3.4.1
Use of parallel imaging techniques
To make an MR image, it is necessary to sample k -space. A higher-resolution image requires more k -space to be acquired and hence a longer acquisition time (longer breath-holds or lower temporal resolution in a segmented acquisition). Parallel imaging is one of a series of methods that exploits MRI capabilities to collect less data and still create an image [ ]. Parallel imaging simultaneously takes advantage of the additional spatial localization that is available when collecting images simultaneously from more than one receive RF coil. It is then possible to collect less of the k -space and use the fact that each coil “sees” a different region of the patient to generate the k -space that was not sampled. Presently, it is possible to accelerate 2D MRI by factors of 2 or 3 and 3D MRI by larger factors up to 10-fold or more. These approaches can also be used to collect multiple (typically 3) image slices in the time required to collect one slice. In addition to parallel imaging it is possible to use methods such as Partial Fourier to accelerate data acquisition by factors approaching 2 × speed-up, which takes advantages of fundamental symmetries in k -space.
6.3.4.2
Use of time acceleration approaches
When collecting a time series of images (e.g., in a cine or perfusion acquisition), most of the image changes vary little from one image frame to the next, which suggests a mechanism of acceleration. If it were possible to only image the changes between one image and the next, then the number of nonzero pixels in this difference image would be very small. Information theory therefore suggests that it should be possible to acquire the data associated with the difference image very quickly. These methods have been pioneered in digital imagery, such as the mpeg formats, and are very successful in that arena, achieving compression ratios of better than 200:1. In MRI, the data are collected in the k -space domain rather than the image domain, which hampers compression; however, even with this limitation, these approaches have proven effective at providing acceleration. This family of approaches is known as k − t acceleration [ ] and is seen to have applicability to cine and perfusion and any other acquisition that acquires a time course of images. A further current issue lies in the rapid reconstruction of images acquired in this fashion; however, further advances in the reconstruction algorithms and of the reconstruction hardware platforms address this issue.
6.3.5
Do we really need to go faster?
6.3.5.1
Navigated methods
So far, the discussion has focused on controlling the breathing motion through breath-holding. Breath-holding is a crude approach but is clinically well-tolerated and provides good-quality images. An alternative approach is to monitor the breathing cycle and only collect data when the patient is at a certain breathing position. This idea mimics the approach used for cardiac gating in which data are acquired at the same phase of the movement, whether it is the beating heart or respiration. Several ways have been used for monitoring breathing, including measuring chest expansion with a sensor and with MRI methods. MRI methods can be used to measure directly the diaphragm position to control how the imaging sequence operates in real time, either by selecting whether image data is collected, or what to do with the collected data. Simple “pencil beam” one-dimensional navigators have been commonly used for some time, but higher dimensional navigators are emerging that provide more information to the algorithms in managing breathing motion.
6.4
Perfusion, blood-oxygen-level-dependent, and late gadolinium enhancement imaging
6.4.1
Introduction
The assessment of patients with known or suspected ischemic heart disease is a major application of CMR. In the EuroCMR registry, risk stratification in suspected CAD or ischemia is the number one indication for CMR (34.2%) followed by workup of myocarditis or cardiomyopathies (32.2%) and assessment of viability (14.6%) [ ]. New CMR techniques that assess myocardial oxygenation may be useful adjuncts to perfusion CMR by providing a more direct assessment of myocardial ischemia [ ]. Important prognostic indices can also be derived from CMR imaging in patients with ischemic heart disease [ ].
6.4.2
Viability assessment by CMR
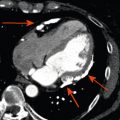
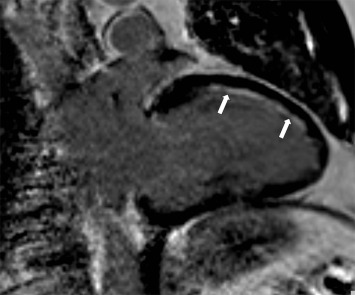
The development of late gadolinium enhancement (LGE)-CMR in the late 1990s and extensive preclinical and clinical validation studies established CMR as a reference standard method for imaging myocardial infarction and thus indirectly assessing viability [ ]. Using T1-weighted segmented inversion-recovery LGE sequences, high spatial resolution images of irreversible myocardial injury both in the acute and chronic setting can be acquired ( Figure 6.6 ). This in vivo demonstration of the spatial extent of myocardial necrosis allows the identification of even small subendocardial infarcts previously undetectable by lower-resolution techniques such as single photon emission cardiac tomography (SPECT) [ ].
Several studies have shown that the transmural extent of infarction predicts the recovery of contractile function after revascularization [ , ].
LGE-CMR not only defines the location and extent of infarction, but in acute MI also shows areas with poor tissue perfusion following primary PCI due to the “no-reflow phenomenon.” Such microvascular obstruction detected by CMR has been linked to adverse ventricular remodeling and cardiovascular events after acute myocardial infarction [ , ].
6.4.3
Ischemia assessment by CMR
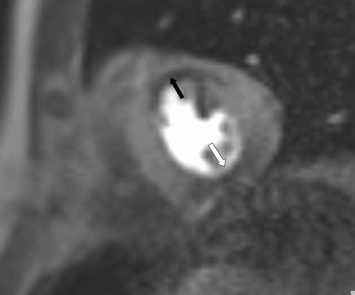
Perfusion imaging is an excellent method to assess myocardial ischemia and can be performed as part of a comprehensive CMR study in patients with acute or chronic ischemic heart disease [ ]. Perfusion defects appear hypointense (dark) compared to adjacent normal myocardium during the first pass of a gadolinium-based contrast agent at maximal vasodilatation usually achieved using adenosine i.v. infusion ( Figure 6.7 ). With the application of parallel imaging techniques and the higher field strength of 3 T, the spatial and temporal resolution of the technique is further improved, and near whole heart coverage is now possible [ , ]. The difference in spatial resolution compared to nuclear techniques is several times higher for CMR, allowing clear visualization of the subendocardial and subepicardial layers. Multiple studies have proven the clinical feasibility, safety, and high diagnostic accuracy of first-pass perfusion CMR with vasodilator stress for the detection of CAD [ ]. In patients with contraindications to adenosine such as asthma or atrioventricular block and poor acoustic windows, dobutamine stress CMR is a reliable alternative to perfusion CMR.
Oxygenation-sensitive, or blood-oxygen-level-dependent (BOLD), CMR is a gadolinium-contrast-free technique that allows the noninvasive assessment of myocardial oxygenation [ ]. Deoxygenated hemoglobin in blood can act as an intrinsic contrast agent, changing proton signals in a fashion that can be imaged to reflect the level of blood oxygenation [ ]. Importantly, situations can exist where myocardial perfusion can be dissociated from oxygenation. The oxygen demand of the heart muscle may vary in different states, e.g., reduced in hibernating myocardium in line with the down-regulated contractility or increased in hypertrophic cardiomyopathy (HCM) due to the increased energy cost of contraction [ ]. Even in patients with significant coronary stenoses, some degree of dissociation can occur between segmental perfusion and oxygenation [ ]. Thus, compared to perfusion, regional myocardial oxygenation may be a superior parameter that more directly reflects the imbalance between oxygen demand and supply that characterizes ischemia.
6.4.4
Future directions
Further improvements in image quality with high spatial and temporal resolution can be expected for perfusion and viability CMR in the coming years [ ]. The development of robust 3D techniques will increase the speed of data acquisition, further shortening scan time. Oxygenation imaging techniques are also expected to improve and become robust clinical tools in addition to perfusion. Finally, the cost effectiveness of a comprehensive CMR scan in patients with known or suspected ischemic heart disease compared to other imaging modalities and management strategies needs to be determined.
6.5
Quantitative mapping techniques
6.5.1
T1 mapping
Each tissue type exhibits a characteristic range of normal T1 relaxation times, deviation from which may indicate disease. Normal myocardial T1 values can be influenced by physiologic and technical factors, including temperature, age, gender, heart rate, magnetic field strength, and the pulse sequence used [ ].
The most widely used approaches to estimate in vivo human myocardial T1 values are inversion-recovery and saturation-recovery based sequences. The Modified Look-Locker Inversion Recovery (MOLLI) method (2004) brought T1-mapping closer toward cardiac applications [ ], and recent efforts using abbreviated variants concentrated on shortening acquisition times and minimizing heart-rate dependency [ ]. Currently, MOLLI-based sequences are the most commonly used and validated [ , , ] although saturation-recovery single-shot acquisition (SASHA) sequences are promising approaches in achieving very short imaging times without heart rate dependency [ ]. Saturation recovery-based techniques may have a higher accuracy in estimating myocardial T1 times [ ], while MOLLI-based methods may be more sensitive to detecting changes in disease due to additional magnetization transfer (MT) contrast [ ]. Myocardial T1-mapping methods can be used for native (or precontrast) T1-mapping, postcontrast T1-mapping and extracellular volume (ECV) mapping.
6.5.1.1
Native T1 mapping
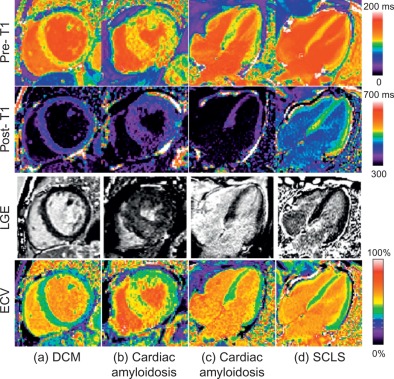
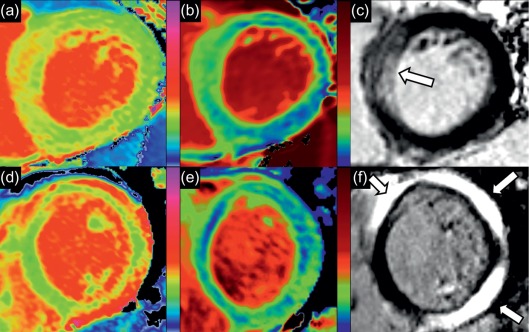
Native T1-mapping estimates myocardial T1 values before the administration of any contrast agents. MOLLI-based native T1-mapping has been extensively validated using simulations, phantoms, animal, and multicenter normal human population studies [ ] and was shown to be highly reproducible with a tight and stable normal range [ ]. T1 values are sensitive to increased free water content [ ], whether due to acute edema or pooling within an expanded interstitial space, and increased T1 times are observed in a number of common cardiac conditions ( Figure 6.8 ), including acute myocardial edema [ ], myocardial infarction [ , ], myocarditis [ , ], hypertrophic and dilated cardiomyopathy [ ], cardiac amyloidosis [ , ], cardiac involvement in systemic diseases [ , , ], and diffuse fibrosis, with histopathologic correlation in the latter [ ]. Native myocardial T1 values may be lowered by fat or iron content and thus are also useful in characterizing Anderson-Fabry disease [ , ], fat in cardiac masses [ ], and myocardial iron overload [ , ]. The main advantage of native T1-mapping is that it does not require intravenous administration of contrast agents, saving time, cost, and improving patient comfort. This is particularly useful in patients with contraindication to gadolinium-based contrast agents. Native T1-mapping can display nonischemic patterns of myocardial injury previously only possible using late gadolinium enhanced imaging [ ] and can potentially be used in the future for gadolinium-free CMR protocols.
6.5.1.2
Postcontrast T1 mapping
Postcontrast T1-mapping estimates myocardial T1 values at a fixed time point after the injection of gadolinium contrast agents, which shorten T1 times. Postcontrast T1 values depend on a number of factors, including the type and dosage of gadolinium contrast used, the postcontrast acquisition time, body fat percentage, hematocrit, and renal function [ ]. Isolated (single time-point) postcontrast T1-mapping has been shown to detect significantly lower T1 values in myocardial infarction [ , ], cardiomyopathy [ , , ], amyloidosis [ ], and diffuse myocardial fibrosis [ ], but is insufficient to measure ECV when compared against histology and ECV mapping [ ]. These, together with the difficulty in directly comparing isolated postcontrast T1 values between subjects, may limit its reproducibility and clinical applicability as a quantitative technique [ ].
6.5.1.3
Extracellular volume (ECV) estimation and mapping
Expansion of the myocardial interstitial space may serve as a marker for myocardial fibrosis in a number of myocardial diseases [ , , , ]. It is possible to quantify the myocardial interstitial space in the human myocardium, as demonstrated in vitro using gadolinium-enhanced MRI [ ], and in vivo using equilibrium contrast cardiovascular magnetic resonance (EQ-CMR) [ ], both with good correlation to collagen volume fraction (CVF) [ ]. ECV can be estimated using the formula:
Extracellular volume fraction ECV = λ × 1 – hematocrit
λ = 1 / T 1 p ostcontrast myocardium − 1 / T 1 precontrast myocardium 1 / T 1 postcontrast blood − 1 / T 1 precontrast blood
and requires a constant infusion of contrast, which can be time-consuming for practical applications. This state of equilibrium can be closely approximated by the bolus contrast technique with delayed (15 min) postcontrast measurement, known as dynamic-equilibrium (DynEq) CMR [ ]. ECV appears to be slightly higher in women [ , ] and to increase with age, both in healthy human cohorts [ , ] and in mice, with strong correlation to the extent of myocardial fibrosis [ ]. Increased myocardial ECV has been shown in myocardial infarction, myocarditis, hypertrophic, and dilated cardiomyopathy, cardiac amyloidosis, diabetes, obesity, and other cardiac conditions with diffuse myocardial fibrosis ( Figure 6.9 ) [ , , , ]. ECV calculation can correct for some of the variables confounding isolated postcontrast T1-mapping, and is less dependent on magnetic field strength than T1 values. However, the number of variables required can magnify noise and variability within the technique. Its accuracy also relies on the assumption that contrast concentration is equal in a strict two-compartment model, but can be affected by incomplete dynamic equilibrium, contrast transfer into other compartments, and a faster renal clearance than exchange rate between compartments [ ]. Like native T1 times, expansion of ECV is nonspecific and can be due to reasons other than myocardial fibrosis, such as edema or infiltrative diseases.