1. Acquisition time, 2D acquisition
a. Time = TR × #PEG × NEX—where TR is the repetition time, #PEG is the number of phase-encode gradient applications, and NEX is the number of excitations (averages).
b. Matrix size defining k-space is often not square—typically, the smaller dimension is assigned to PEG.
c. Tradeoff of time and SNR are considered.
2. Multislice data acquisition
a. During the TR, cycling gradients and tuning RF excitation frequency images the volume (Fig. 13-1).
b. Tradeoff is cross excitation of adjacent tissues and loss of contrast from nonsquare excitation pulses.
c. Total number of slices = TR/(TE + C), where C is a constant dependent on MR equipment capabilities.
d. Longer TR (e.g., T2-weighted SE) can have more slices acquired in the acquisition.

▪ FIGURE 13-1 Multislice two-dimensional image acquisition is accomplished by discretely exciting different slabs of tissue during the TR period; appropriate changes of the RF excitation bandwidth, SSG, PEG, and FEG parameters are necessary. Because of diffuse excitation profiles, RF irradiation of adjacent slices leads to partial saturation and loss of contrast. The number of slices (volume) that can be obtained is a function of the TR, TE, and C, the latter representing the capabilities of the MR system and type of pulse sequence.
3. Acquisition time, 3D acquisition
a. The 3D acquisition is initiated with a slice encode excitation in addition to a phase-encode excitation.
b. Time (3D) = TR × # phase-encode steps (Z-axis) × phase-encode steps (X-axis) × NEX.
1. Fast pulse sequences
a. Fast spin echo (FSE) uses multiple PEG steps with multiple 180° refocusing pulses per TR.
(i) Multiple lines in k-space are filled per TR resulting in an echo train length (ETL) (Fig. 13-2).
(ii) Speed increase is acquisition time × 1/ETL.
(iii) Characteristics: high SAR, good immunity from inhomogeneities (with 180° excitations).

▪ FIGURE 13-2 Conventional FSE uses multiple 180° refocusing RF pulses per TR interval with incremental changes in the PEG to fill several views in k-space (the ETL). This example illustrates an ETL of four, with an “effective” TE equal to 16 ms. Total time of the acquisition is reduced by the ETL factor. The reversed polarity PEG steps reestablish coherent phase before the next gradient application. Slightly different PEG strengths are applied to fill the center of k-space first and then the periphery with later echoes, continuing until all views are recorded. As shown, data can be mirrored using conjugate symmetry to reduce the overall time by another factor of two.
b. Echo planar image (EPI) acquisition uses oscillating readout gradient and phase-encode gradient “blips.”
(ii) Offers “snapshot” capability: down to 50 ms acquisition
(iii) Characteristics: low resolution, artifacts (ghosting and geometric distortion due to susceptibility)

▪ FIGURE 13-3 Single shot echo planar spin echo image (SE-EPI). Data are deposited in k-space, initially positioned by a simultaneous PEG and FEG application to locate the initial row and column position (in this example, the upper left; for SE-EPI, the 180° pulse inverts starting location to upper left), followed by phase-encode gradient “blips” simultaneous to FEG oscillations, to fill k-space line by line by introducing 1-row phase changes in a zigzag pattern. Image matrix sizes of 64 × 64 and 128 × 64 are common.
c. GRASE (gradient and spin echo) sequence combines FSE and EPI.
(i) A series of GREs between inversion RF pulses is repeated over multiple fast spin echoes.
(ii) Achieves benefits of GRE (speed) and SE (RF refocusing to compensate for T2* effects).
(iii) For details, see textbook Page 499, Figure 13-4.
2. k-Space filling
b. Centric k-space filling for SNR advantage when echoes have their highest amplitude.
c. Keyhole filling collects central lines later for important events such as contrast-enhanced angiography.

▪ FIGURE 13-4 Alternate methods of filling k-space. A. Centric filling applies the lower strength PEGs first to maximize signal and contrast from the earliest echoes of an FSE or GRE sequence. B. Keyhole filling applies PEGs of higher strength first to fill the outer portions of k-space, and the central lines are filled only during a certain part of the sequence, such as with arrival of contrast signal. F. 13-5
a. Radial imaging—generates radial spokes passing through the center of k-space in 2D and 3D space
(i) Yields higher sampling density at the center than the periphery
(ii) Benefits applications of dynamic imaging requiring high temporal resolution (e.g., contrast-enhanced angiography, cardiac imaging; see text book, Fig. 13-7 for details)

▪ FIGURE 13-5 Various non-Cartesian sampling methods: (A) 2D radial sampling with Gx = G0 cos φ and Gy = G0 sin φ, where G0 is the maximum gradient strength, φ is the azimuthal angle of radial line, and full radial lines are acquired with 0<φ<π. B. 3D radial sampling with Gx = G0 sin θ cos φ, Gy = G0 sin θ sin φ, and Gz = G0 cos θ, where θ and φ are the polar angle and the azimuthal angle of radial line, respectively. C. Spiral sampling with sinusoidal oscillation of the x and y gradients 90° out of phase with each other, with samples beginning in the center of k-space and spiraling out to the periphery. F. 13-6
b. Spiral imaging—an alternate method of EPI, involving oscillation of equivalent encoding gradients
c. Propeller—acquisition technique that mitigates motion artifacts
(i) Rectangular block of data (“a blade”) is acquired and rotated about center of k-space.
(ii) Redundant information is used to identify and correct motion artifacts (see textbook Pg. 502-503, Fig. 13-8 for details).
4. Data synthesis—takes advantage of the symmetry and redundancy of k-space frequency domain signals
a. Fractional NEX: in phase-encode direction, the number of excitations are reduced (Fig. 13-6, left).
b. Fractional echo: in frequency-encode direction, a fraction of echo reduces TE, and more slices can be acquired in one TR period (Fig. 13-6, right).
c. Tradeoff for both methods: loss of SNR due to fewer excitations per voxel in the volume.

▪ FIGURE 13-6 Fractional NEX and fractional echo. Left. Fractional NEX uses data synthesis characteristics of the frequency domain. Phase conjugate symmetry allows ½ of the PEG + 1 extra line with the complex conjugate of the data reflected in symmetric quadrants. Acquisition time is reduced by approximately 2x (approximately 50%), but image noise is increased by approximately √2 (40%). Right. Fractional echo acquisition is performed with part of the echo read during the application of the FEG. The peak of the echo is shifted by the readout gradient, and the echo signals prior to the peak are identical mirror images after the peak to fill out k-space. The sampling window includes the peak and the dephasing part of the echo. The echo peak is closer to the RF excitation pulse, which can improve T1 and proton density weighting contrast. A larger number of slices can also be obtained with a shorter TE in a multislice acquisition. F. 13-9
5. Parallel imaging
a. Response of multiple-receive RF coils overcome aliasing artifacts due to undersampling.
b. SENSitivity Encoding (SENSE) uses the sensitivity profile of each coil element.
(i) Method: GeneRalized Autocalibrating Partially Parallel Acquisition (GRAPPA)
d. Scan time reduction factor can be higher than two, but SNR is reduced.
e. SNR is inversely proportional to the coil geometry factor and square root of reduction factor:
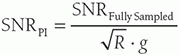 , where R is the scan time reduction and g is the coil geometry factor.
6. Multi-band imaging (MB)
a. MB further accelerates image acquisition by exciting multiple slices simultaneously (Fig. 13-7).
b. No SNR penalty from scan time reduction is incurred as multiple excitation pulses are acquired.
c. Coil g-factor in slice direction reduces SNR slightly.
 ▪ FIGURE 13-7 Multiband imaging excites multiple slices simultaneously and unwraps the aliased image in the slice direction using a parallel imaging approach. There is no SNR penalty besides the coil geometry factor because a larger signal is received with multiple 2D slices. This enables a high acceleration factor along with parallel imaging.  F. 13-11 F. 13-11 |
1. Flow-related enhancement
a. A process causing increased signal enhancement of moving tissue (blood, CSF).
b. High intensity is caused by wash-in of unsaturated protons into a partially saturated volume.
c. Elimination of bright signals can be achieved with saturation pulses outside of the imaging volume.
2. MR angiography—exploitation of blood flow enhancement
a. Time-of-flight angiography
(i) Relies on flow enhancement of “tagged” or “unsaturated” protons into the imaging volume.
(ii) Longitudinal magnetization differences of moving blood results in differential vessel contrast.
(iii) Use of poor anatomic contrast imaging (e.g., GRASS-FISP sequence) allows use of maximum intensity projections to generate angle-specific views of the vasculature (Fig. 13-8).

▪ FIGURE 13-8 A volume stack of bright blood images (left) is used with MIP processing to create a series of projection angiograms at regular intervals; the three-dimensional perspective is appreciated in a stack view, with virtual rotation of the vasculature. F. 13-15
b. Phase-contrast angiography
(i) Relies on the phase change occurring in moving protons (Fig. 13-9).
(ii) The phase change is dependent on bipolar gradients in two excitations with opposite polarity.
(iii) Time, ΔT, between bipolar gradients is the velocity encoding (VENC) time to ensure optimal phase shift for measurements without aliasing and for gray scale encoding of velocity.

▪ FIGURE 13-9 Phase contrast angiography uses consecutive excitations that have a bipolar gradient encoding with the polarity reversed between the first and second excitation, as shown in the top row. Magnetization vectors (lower two rows) illustrate the effect of the bipolar gradients on stationary and moving spins for the first and second excitations. Subtracting the phases of two spins will cancel stationary tissue phase and enhance phase differences caused by the velocity of moving blood. F. 13-16

▪ FIGURE 13-10 Magnitude (left) and phase (right) images provide contrast of flowing blood. Magnitude images are sensitive to flow but not to direction; phase images provide direction and velocity information. The blood flow from the heart shows forward flow in the ascending aorta (dark area) and forward flow in the descending aorta at this point in the heart cycle for the phase image. Some bright flow patterns in the ascending aorta represent backward flow to the coronary arteries. Gray scale amplitude is proportional to velocity, where intermediate gray scale is 0 velocity. F. 13-17
3. Gradient moment nulling (for flow compensation)
a. Flowing blood often causes flow artifacts due to the phase dispersion of moving spins (Fig. 13-11).
b. Additional gradients set the phase evolution of stationary and moving spins to 0 prior to data collection.
 ▪ FIGURE 13-11 Left. Phase dispersion of stationary and moving spins under the influence of an applied gradient (no flow compensation) as the gradient is inverted is shown. The stationary spins return to the original phase state, whereas the moving spins do not. Right. Gradient moment nulling of first-order linear velocity (flow compensation) requires a doubling of the negative gradient amplitude followed by a positive gradient such that the total summed area is equal to zero. This will return both the stationary spins and the moving spins to their original phase state.  F. 13-18 F. 13-18 |
TABLE 13-1 COMPARISON OF PERFUSION MRI TECHNIQUES | ||||||||||||||||||||||||||||||||||||
|---|---|---|---|---|---|---|---|---|---|---|---|---|---|---|---|---|---|---|---|---|---|---|---|---|---|---|---|---|---|---|---|---|---|---|---|---|
| ||||||||||||||||||||||||||||||||||||
1. Arterial spin labeling (ASL)
a. ASL uses blood magnetization and measures blood flow (Fig. 13-12).
b. Pulsed ASL tags blood with inversion or saturation pulse.
(i) Tagged blood moves into region of interest with imaging initiated.
(ii) After waiting time (1 to 2 s), another image set without inversion is acquired in same region.
(iii) Subtraction of the images removes the signals from static tissues.
c. Continuous ASL uses a long RF pulse applied in a plane while the blood signal is inverted.
(i) After “post-labeling delay” images in the target area are acquired.
(ii) Another acquisition of noninverted spins and subtraction yields the signals from the blood.
d. Method suffers from low SNR, requiring multiple signal averages (20 to 60).
e. Most important is choice of waiting time—a tradeoff of measuring vascular signals versus tissue perfusion and the T1 decay of blood signals.

▪ FIGURE 13-12 Description of arterial spin labeling techniques: In-flowing blood spins are inverted by a single spatial inversion pulse (for pulsed ASL) or a long RF train at the tagging plane (for continuous ASL). Control and tag images are collected, and perfusionweighted images are generated by subtraction of two. Blood flow is estimated using a kinetic model with an assumption that the entire labeled signal is delivered to the tissues because the water in the blood is freely diffusible into the tissues. F. 13-19
2. Dynamic susceptibility contrast (DSC)
a. Use of contrast material tagged with susceptibility agents such as gadolinium (Gd).
b. T2 and T2* parameters generate large signal differences in the vasculature—Gd concentrations can be tracked as a function of time in arteries and tissues (Fig. 13-13).
c. Blood flow can be estimated by deconvolution of the tissue residue function (Fig. 13-14).
(i) Mean transit time (MTT) is estimated with ratio of cerebral blood volume (CBV) and cerebral blood flow (CBF) or an integral of blood flow.
d. Concern with DSC is contrast agent leakage to extravascular or extracellular space, as the conventional DSC model is based on no leakage.

▪ FIGURE 13-13 Illustration of postcontrast model in tissues: Inflow of the contrast agent passes through a capillary with leakage to extravascular extracellular space. The tissue concentration measured from dynamic images is from convolution of the concentration in a large artery (arterial input function) and a response function. F. 13-20

▪ FIGURE 13-14 Description of dynamic susceptibility contrast perfusion MRI: A series of dynamic T2*-weighted images is collected using 2D EPI. The signals are changed over time when the contrast passes through the area and the concentration changes of Gd are estimated from the T2* changes. After the arterial input function (AIF) is found, CBV, MTT, and CBF values are estimated using the concentration changes in the artery and in the tissues. F. 13-21
3. Dynamic contrast enhanced (DCE)
a. Purpose is the measure the amount of leakage into tissues.
b. “Tofts” and “Extended Tofts” models are used (see textbook Pg. 515-516 for details).
c. Dynamic T1-weighted sequence such as SPGR is used.
d. Mapping of T1 signal change when Gd contrast agent is injected (Fig. 13-15).

▪ FIGURE 13-15 Description of dynamic contrastenhanced perfusion MRI: DCE imaging is mainly to measure the amount of leakage. A series of dynamic T1-weighted images are used to estimate the Gd concentration in the tissue. Using Tofts model, the exchange parameters and volume fraction maps are generated. F. 13-22
4. Diffusion MRI
Molecular diffusion is the stochastic translational motion of molecules also known as Brownian motion. Diffusion MRI sequences use strong MR gradients applied symmetrically about the refocusing pulse to produce signal differences based on the mobility and directionality of water diffusion.
a. Diffusion-weighted imaging (DWI)
(i) Symmetrical gradients of amplitude G and duration δ placed before/after the 180° pulse (Fig. 13-16).
(ii) Tissues with more mobility are dephased by the gradients and have a smaller signal than those with restricted diffusion (e.g., ischemic injury).
(iii) A T2-weighted image without diffusivity weighting is compared to a weighted image (b value).
(iv) A b value (s/mm2) is a diffusion sensitivity factor, and the diffusivity D is the diffusion rate (mm2/s).
Mxy (b,TE) = M0e-TE/T2e–bD
(v) The b values are typically in the range of 200 to 2,000.
(vi) A higher b value (e.g., b = 1,000) generates more sensitive but noisier diffusion-weighted images.
(vii) Apparent diffusion coefficient (ADC) images are generated from the image pair (Fig. 13-17).

▪ FIGURE 13-16 The basic elements of a DWI pulse sequence are shown. The diffusion weighting gradients are of amplitude G, duration of the gradients is δ, and time between gradients is Δ. F. 13-23

▪ FIGURE 13-17 Structural images of a brain infarction case: (A) T2-weighted image, (B) T2 FLAIR image, (C) b = 0 image, (D) DWI in a diffusion direction, (E) trace-weighted image, and (F) ADC map. The diffusion-weighted images (D, E, and F) show clear distinctions between normal and infarcted regions. F. 13-24
b. Diffusion tensor imaging
(i) Advanced form of diffusion imaging that uses encoding directionality to indicate the anisotropy of white matter by measuring the diffusion restriction and providing structure of surrounding tissues.
(ii) A diffusion tensor provides quantitative diffusion metrics (diffusivity and fractional anisotropy).
(iii) A minimum of six diffusion-encoding directions are required to generate the tensor; many more are actually used to improve the SNR.
(iv) DTI images are color encoded to illustrate directions of diffusion (Fig. 13-18).
 ▪ FIGURE 13-18 Diffusion tensor model associated with white matter fibers represents eigenvalues and eigenvectors characterizing water diffusion and molecular structure within a voxel (left). From a DTI with a 1,000 b value in 30 diffusion directions, three orthogonal eigenvalues (top right row) are estimated and mean diffusivity (MD), fractional anisotropy (FA), and eigenvector color map (bottom right row) are calculated showing the direction of the primary eigenvectors (blue: S/I, red: R/L, and green: A/P directions).  F. 13-25 F. 13-25 |
1. Functional MRI
a. Technique of mapping neuronal activities in the brain and relying on a local reduction of deoxyhemoglobin, which is paramagnetic, while the neurons in the region become active
b. Blood oxygen level-dependent (BOLD) acquisition
(i) A series of dynamic T2*-weighted images using fast EPI GRE sequences map the brain’s active regions through correlation of signals with a repetitive task (e.g., physical, sensory, or cognitive).
(ii) Resultant areas are color mapped onto the gray scale images (see textbook, Pg. 521, Fig. 13-26).
c. Combination diffusion MRI and fMRI can help visualize structure and function (e.g., identify areas prior to resection of a brain tumor) (see textbook, Pg. 521, Fig. 13-27).
2. Susceptibility-weighted imaging
a. Based on T2*-weighted magnitude and phase images obtained with a 3D GRE sequence.
b. Images are sensitive to local susceptibility differences from deoxyhemoglobin in venous blood, methemoglobin in blood hemorrhage, and iron deposition.
c. Technique utilizes small and local phase differences and magnitude change with image processing to remove phase changes due to field inhomogeneities.
d. SWI images are generated from a multiplication of phase masks with the magnitude images to emphasize small phase deviations caused by the susceptibility agents (Fig. 13-19).
e. Improved visualization is obtained with minimum intensity projection (mIP) of the SWI image stack.

▪ FIGURE 13-19 Susceptibility-weighted imaging: Magnitude and phase images are obtained with 3D T2*-weighted GRE sequence. In SWI, the small phase deviations hardly detectable in normal T2*-weighted images are emphasized by multiplying the magnitude images with the phase masks multiple times. mIP (minimum intensity projection) is created by choosing the minimum value in multiple slices. F. 13-28
3. MR elastography
a. Technique evaluates the stiffness of tissues with the use of an external mechanical wave generator.
b. GRE imaging with motion-encoding gradients (similar to phase-contrast MRA) are used for acquisition.
(i) 4 to 8 dynamic images are acquired of magnitude and phase during mechanical vibration.
(ii) Displacement information is extracted from the dynamic phase information at the applied frequency.
(iii) Submicrometer motion in the direction of mechanical wave is inversely proportional to the wave speed, from which the stiffness is determined, as stiffer tissues have faster wave speed.
c. Typical use is assessment of tissue stiffness in the liver (Fig. 13-20).

▪ FIGURE 13-20 Example of MR elastography: The phase of MRE shows the phase variation due to the mechanical vibration included by a wave generator. Elastogram shows tissue stiffness estimated based on the wave propagation. F. 13-29
4. Magnetization transfer contrast
a. The interaction between protons in free water molecules and protons hydrated to the macromolecules of a protein provides a conduit for partial saturation with off-resonance pulse.
b. Magnetization exchange occurs between the two proton groups.
c. Selective saturation of the protons in the hydration layer occurs separately from the bulk water by using narrowband RF pulses tuned to the hydration layer with an off-resonance peak of approximately 5 kHz.
d. Transfer of the magnetization partially saturates the adjacent protons in bulk water.
e. Saturation of these spins reduces anatomic contrast and is often used in conjunction with MRA time-of-flight methods and other examinations where selective reduction of high signal assists in diagnosis, such as knee cartilage (see textbook, Pg. 522-523, Fig. 13-30).
5. Magnetic resonance spectroscopy (MRS)
a. A method to evaluate tissue chemistry by recording and measuring signals from metabolites.
b. MRS metabolic peaks are separable by frequency shifts relative to the frequency of water proton.
c. Metabolite precessional frequencies are bounded by that of water and fat requiring selective saturation pulses to allow the quantitative evaluation of the very weak metabolite signals (Fig. 13-21).
(i) CHESS (Chemical Shift-Selective) or STIR (Chapter 12) signal suppression methods are used.
d. MRS signals are derived from proton metabolites in targeted tissues (Fig. 13-22, left, and Table 13-2).
(i) Chemical shifts occur due to electron cloud shielding—the amount of shift identifies the metabolite.
e. Localization of the target volume is achieved with single voxel or multivoxel techniques.
(i) Single voxel sampling areas are about 1 cm3—a STEAM (STimulated Echo Acquisition Mode) or a PRESS (Point REsolved SpectroScopy) sequence are employed to identify the volume.
(ii) Multivoxel MRS uses a CSI (chemical shift imaging) technique to delineate multiple voxels of approximately 1 cm3 in 1, 2, or 3 planes over a block of several centimeters of tissue.
f. Magnetic resonance spectroscopic imaging (MRSI) generates the signal intensity of a single metabolite in each voxel and color encodes the values (e.g., the choline/creatine ratio), which are superimposed as a map on the anatomical MR image (Fig. 13-22, right) indicating normal/abnormal tissues (Table 13-3).
 ▪ FIGURE 13-21 MRS metabolites of interest in comparison to the water and fat peaks commonly used for imaging. In order to isolate the very small signals, chemical saturation of the water (and fat when present) signal is essential.
 F. 13-31 F. 13-31Related posts:Stay updated, free articles. Join our Telegram channel
Full access? Get Clinical Tree
 Get Clinical Tree app for offline access

|