Chapter 7 Magnetic Resonance Imaging of Breast Cancer and MRI-Guided Breast Biopsy
Basic Principles
Breast Cancer
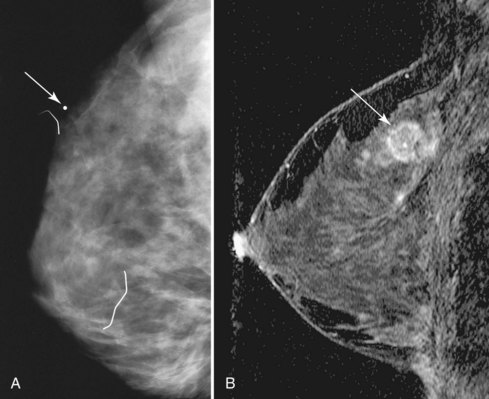
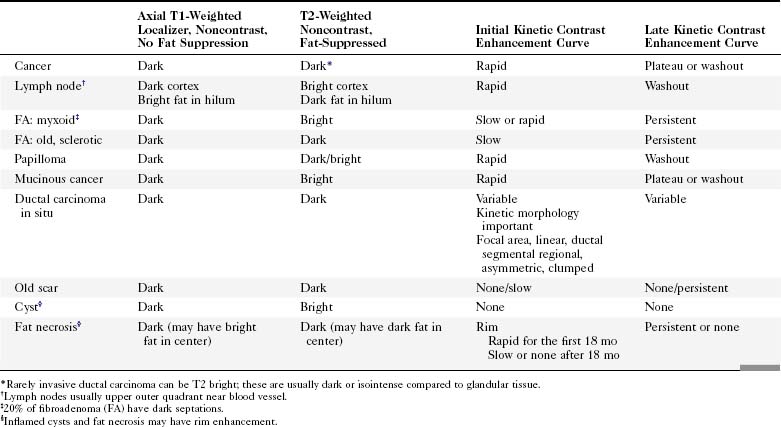
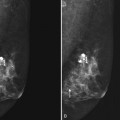
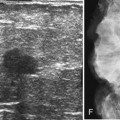
Invasive breast tumors are characterized by an ingrowth of neovascularity at their periphery. Tumor angiogenesis is associated with increased perfusion and abnormal leaky endothelium, leading to preferential enhancement of tumors versus normal breast tissue (Box 7-1). With bolus administration of an intravenous (IV) contrast agent, increased vascular flow and the rapid exchange rate of contrast between blood and the extracellular compartment cause invasive breast tumors to enhance more rapidly and more avidly than normal fibroglandular tissue, even in patients with dense breasts. Thus, invasive breast cancers have high signal intensity and are brighter than the surrounding normal tissue on the first postcontrast scan, which ideally should be obtained about 90 seconds after injection. As a result, MRI exquisitely reveals invasive tumors that are occult on mammography (Fig. 7-1). The sensitivity of MRI for invasive breast cancer is extremely high—over 90%. However, as discussed in detail in this chapter, contrast enhancement on MRI is seen in many benign conditions as well; the specificity of MRI varies between 39% and 95%. As detailed in this chapter, morphology, T1 and T2 characteristics, and the time course of contrast enhancement help differentiate benign from malignant lesions (Table 7-1).
Box 7-1 Principles of Breast Cancer MRI
Contrast-enhanced MRI is extremely sensitive for tumor angiogenesis, regardless of radiographic breast density.
Tumor angiogenesis leads to preferential enhancement of cancers with intravenous contrast.
Lesion morphology helps distinguish cancer from benign conditions.
The time-course of contrast enhancement helps distinguish invasive cancer from other conditions:
Technique
Patient Preparation
Benign hormone-related enhancement of normal breast tissue, called background enhancement, occurs before the onset of menses and can lead to false-positive studies. When possible, patients should be imaged 7 to 10 days after the onset of their menstrual cycle, when spurious contrast enhancement of normal breast tissue is at its nadir (Box 7-2).
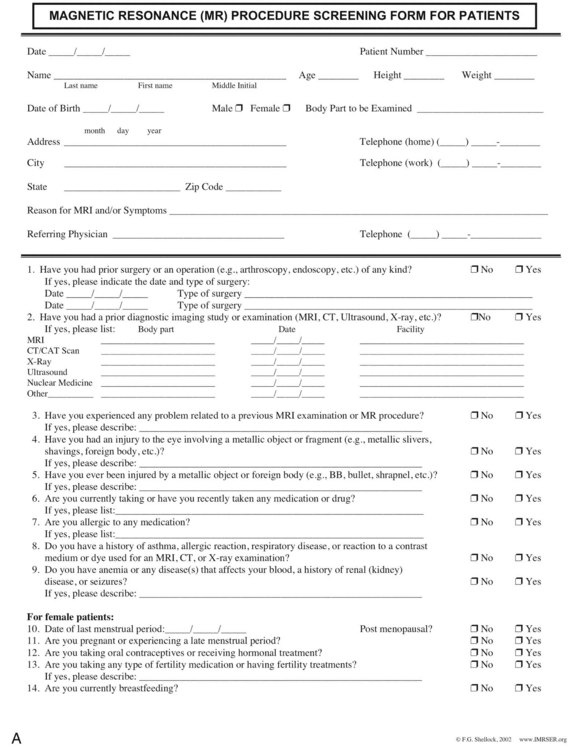
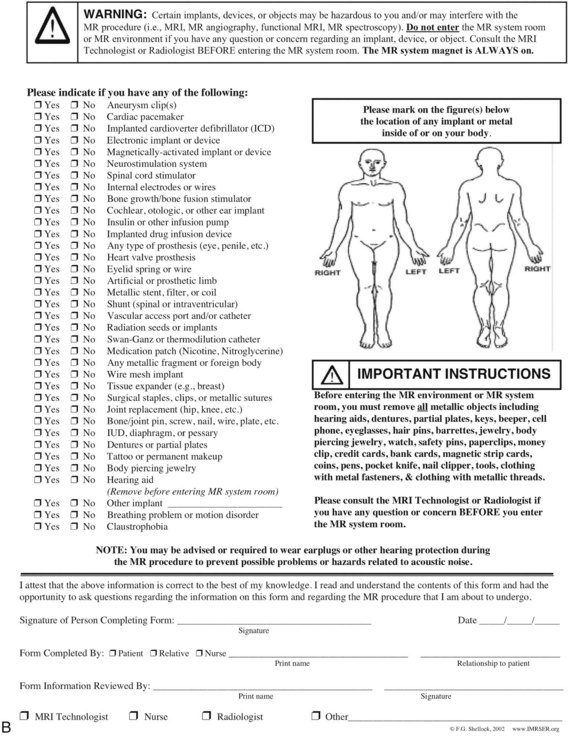
Before MRI scanning, the patient fills out an MRI safety form to exclude contraindications of entering the strong magnetic field, such as ferromagnetic vascular clips, metallic ocular fragments, pacemakers, and implanted electromechanical devices. A qualified person reviews the standardized MRI safety form before scanning (Fig. 7-2).
Equipment
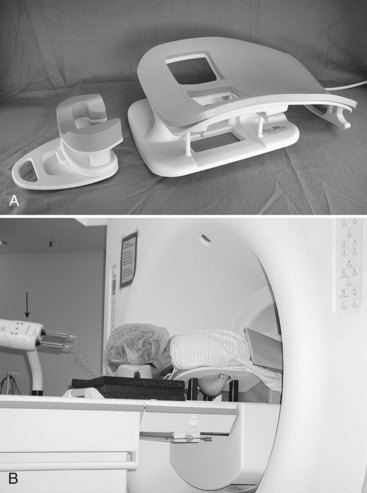
An IV catheter is placed before scanning and is continuously flushed by using the keep vein open (KVO) setting of an MRI-compatible remote power injector. Placement of the catheter in the antecubital fossa contralateral to any known, previous, or suspected malignancy is preferred. The patient is placed prone on a dedicated breast coil (Fig. 7-3A). Prone positioning minimizes respiratory motion in the breast. Phased-array breast coils maximize the signal-to-noise ratio of the image. Patient discomfort is the primary cause of motion; the majority of patients remain most comfortable for the duration of the entire scan with both arms at their sides and wearing hearing protection (see Fig. 7-3B). The technologist spends considerable time discussing the importance of “holding still” with the patient to obtain the best scan. The patient then works with the technologist to obtain a comfortable position within the breast coil. Optional mild breast stabilization, or “compression,” may be used to reduce breast motion and decrease the volume of tissue to be scanned so that the whole breast is included. However, firm compression (as used routinely for mammography) should be avoided because it may negatively affect contrast enhancement. Scanners with a magnetic field strength of 1.5 Tesla (T) or 3.0 T provide the best signal-to-noise ratio. Magnets with high-performance gradients enable the fastest, highest-resolution scans (Box 7-3).
MRI Protocols
Conventional breast MRI begins with T1-weighted images to define the position and anatomy of the breast. T1-weighted images using the signal from the “body coil” rather than the breast coil enable basic evaluation of the axillae, anterior mediastinum, chest wall, and supraclavicular fossa for enlarged regional lymph nodes. Thereafter, a dedicated breast coil signal should be used to perform all subsequent sequences. T2-weighted fast spin-echo (FSE) images are then obtained to characterize the breast and any lesions. T2-weighted scans using an FSE, turbo spin-echo (TSE), or rapid acquisition with relaxation inhibition (RARE) technique, produce high-quality images within reasonable scan times of 5 to 6 minutes. High fat signal on T2-weighted FSE images can be prevented with fat suppression and is most successful if unilateral scanning is performed (Table 7-2).
Table 7-2 Basic Bilateral Protocol for Breast Cancer MRI
| Series | Description | Purpose |
|---|---|---|
| 1 | Axial T1 or STIR | Show lymph nodes and overall anatomy; localization |
| 2 | Fast T2* | Map cysts, ducts; assess lesion T2 |
| [3] | Diffusion-weighted EPI† | Assess lesion ADC |
| 4 | 3-D T1 fat-saturated spoiled gradient echo; 90 seconds or less‡ | Baseline prior to contrast injection |
| 5 | Repeat series 4 over 7–12 min with contrast§ | Assess contrast enhancement morphology and kinetics |
| [6] | 1H spectroscopy¶ | Measure choline |
| N/A | Postprocessing | Enhancement curves, subtraction, 3-D, measurements, parametric maps |
Sagittal imaging for all scans except series 1 allows smallest field of view (∼20 cm for most patients) and thus highest resolution.
Frequency encoding in the anteroposterior direction minimizes artifacts from cardiac and respiratory motion in the breast.
Series in brackets are optional, and not yet standard of care.
1H, proton (hydrogen nucleus); ADC, apparent diffusion coefficient; EPI, echo-planar imaging; FOV, field of view; FSE, fast spin echo; Gd-DTPA, gadolinium diethylenetriamine pentaacetic acid; IPAT, integrated parallel acquisition techniques; NEX, number of excitations or signal averages; RARE, rapid acquisition with refocused echoes; SENSE, sensitivity encoding; STIR, short tau inversion recovery; TE, echo time; TR, repetition time; TSE, turbo spin echo.
* T2: Fast spin-echo (FSE, RARE, TSE, etc.) with effective TE 80–100 ms and TR at least 3000 ms provides good T2 weighting. Use 3- to 4-mm-thick slices and 256×192 matrix or higher for small FOV sagittal images. Fat saturation improves conspicuity of bright lesions on T2, although nonfat-suppressed T2 imaging allows fat signal intensity to be used as a reference signal intensity. Volume shimming improves fat suppression.
† B-values have not been standardized yet, but most investigators use 500–1000 with good results. Parallel imaging may reduce distortions in echo planar imaging.
‡ Both fat suppression and high spatial resolution (<2 mm in all directions) are essential to assess lesion morphology. Rapid imaging (60–90 sec per scan or less) is necessary to assess contrast uptake kinetics. Use “fast” spoiled 3-D gradient echo (TR ≤ 6 ms; FA ∼ 15° for T1 weighting). Intermittent “special” fat saturation pulses speed imaging substantially over conventional fat saturation. Fractional k-space (“1/2 NEX,” etc.), and parallel imaging (SENSE/IPAT, etc.) maximize resolution obtained during the limited scan time.
§ Repeat rapidly for dynamic scans totaling approximately 7 minutes or more. Inject 0.1 mmol/kg standard low molecular weight gadolinium contrast agent (e.g., Gd-DTPA, gadoteridol, etc.) at 2 mL/sec followed by 20 mL flush (normal saline) at the start of the acquisition. Avoid negatively charged gadolinium agents if protocol includes spectroscopy, because they may reduce choline signal. (Lenkinski B, Wang X, Elian M, Goldberg SN: Interaction of gadolinium-based MR contrast agents with choline: implications for MR spectroscopy (MRS) of the breast, Magn Reson Med 61(6):1286–1292, 2009.
¶ Single-voxel choline spectroscopy. A minimum voxel size of 1 cm × 1 cm × 1 cm is recommended for adequate signal-to-noise. Localized shimming and high-quality spatial saturation pulses, fat suppression, and partial water suppression improve quality of spectra.
The Normal Breast MRI
Normal Breast MRI Findings
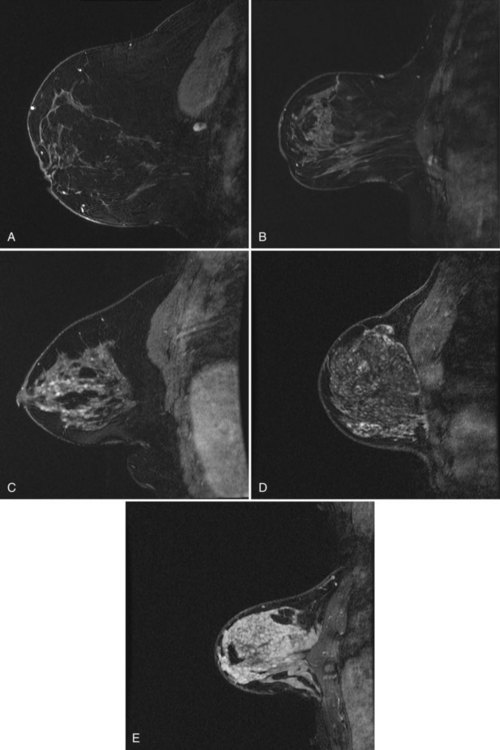
Typical images from a normal patient who underwent both bilateral dynamic and high-spatial resolution imaging are provided in Figure 7-4. On T1-weighted noncontrast-enhanced images, aqueous tissues (including skin, fibroglandular tissue, muscle, and lymph nodes) have moderately low signal intensity when compared with the higher signal intensity of fat, which has a short T1 relaxation time. In the absence of previous surgery or pathology, a layer of subcutaneous and retromammary fat completely surrounds the mammary gland tissue except where it enters the nipple–areola complex. The mammary gland itself is composed of a mix of low-signal fibroglandular tissue and high-signal fat lobules. The mix and distribution of fat and fibroglandular tissue vary greatly between patients—from dense, uniformly glandular tissue with almost no visible fat, to heterogeneous, to predominantly fatty tissue separated by thin strands or septa of fibroglandular tissue. In the ACR Breast Imaging Reporting and Data System (BI-RADS®) MRI lexicon the amount of dense glandular tissue by volume is described in the same terms as used in the mammography lexicon. These include almost all fat (0% to 25% dense), scattered fibroglandular tissue (25% to 50% dense), heterogeneously dense (50% to 75% dense), or dense (>75% dense) (Box 7-4 and Fig. 7-5).
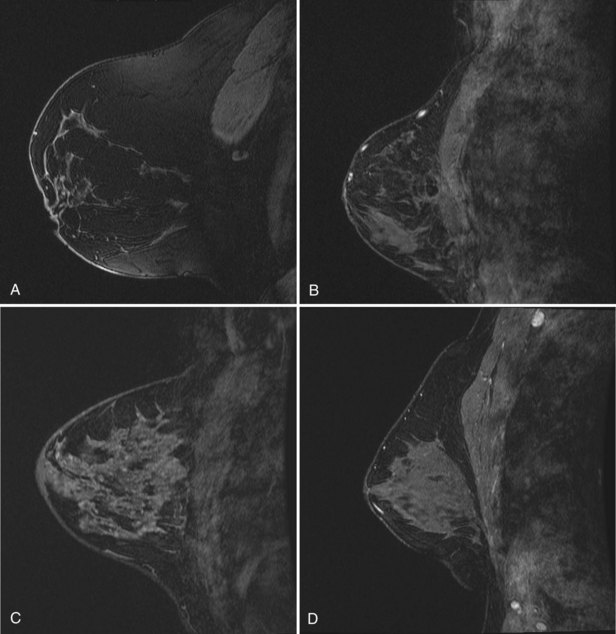
After contrast injection, normal glandular tissue enhances to variable degrees. Normal fibroglandular breast tissue enhancement is called background enhancement in the BI-RADS® lexicon. An understanding of normal background enhancement is important because normal background enhancement can obscure cancers and make the MRI harder to read. Background enhancement describes slowly enhancing breast tissue within the breast. Specifically, normal fibroglandular tissue enhances with nonmasslike patterns, including stippled enhancement (tiny <5 mm foci of enhancement separated by normal tissue); scattered, regional, or multiple regions; or diffused stippled enhancement throughout both breasts. The areas of enhancement are usually separated by nonenhancing normal breast tissue between the normal background enhancing foci. In the BI-RADS® lexicon, the amount of background enhancement is described as a percentage of enhancing breast tissue with respect to the volume of the entire breast. Background enhancement is categorized in quartiles. The descriptors include none (0%), minimal (1% to 25%), mild (25% to 50%), moderate (50% to 75%), and marked (>75%) (Box 7-5 and Fig. 7-6).
Common Breast MRI Artifacts
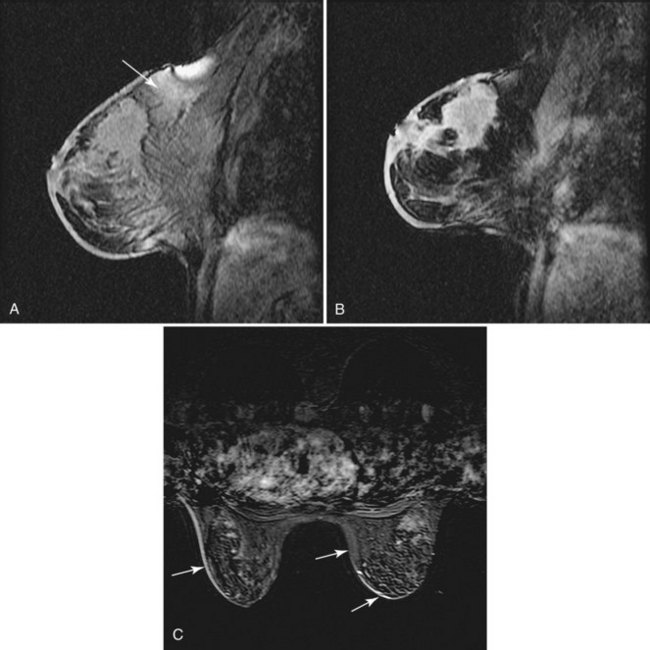
Ghosting from cardiac or respiratory motion occurs in the phase-encoding direction (Table 7-3). It can be prevented from obscuring breast tissue by careful selection of phase- and frequency-encoding directions. Poor fat suppression is usually due to poor shimming or incorrect choice of the excitation center frequency, especially in patients with silicone implants (Fig. 7-7) or non–MRI-compatible objects, such as BB markers, magnetic tissue expanders, scar markers, and metal infusion ports, in or near the breast. Patient motion may cause blurring of the image, so it is especially important that the patient hold still and breathe quietly during scanning. On subtraction imaging, patient motion causes alternating bright and dark bands at fat–glandular tissue interfaces (see Fig. 7-7).
| Artifact | Cause |
|---|---|
| Line(s) of noise | Electronic noise/poor room shielding/scan room door open |
| Ghosting from heart across the breast | Wrong frequency-encoding direction |
| Blurring | Patient motion |
| Bright and dark edges on subtraction | Patient motion |
| Poor enhancement | Slow or failed contrast injection |
| Poor fat suppression | Poor shimming or center frequency, non-MRI compatible skin marker left on breast |
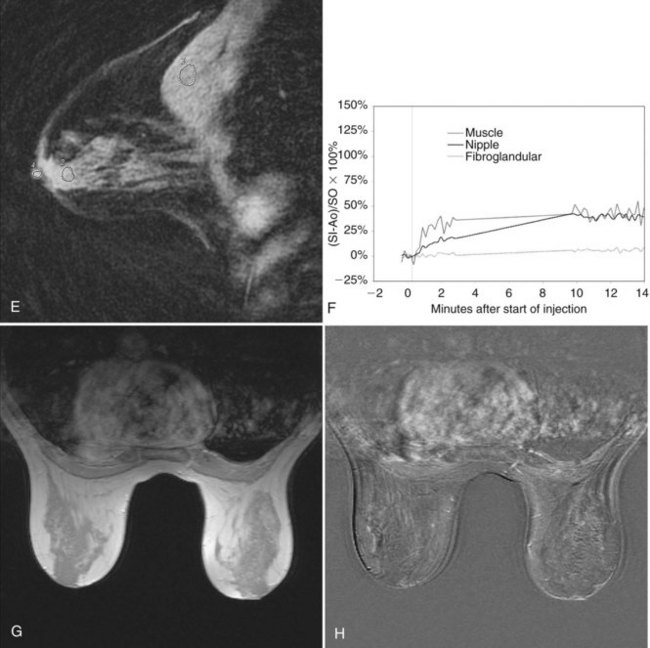
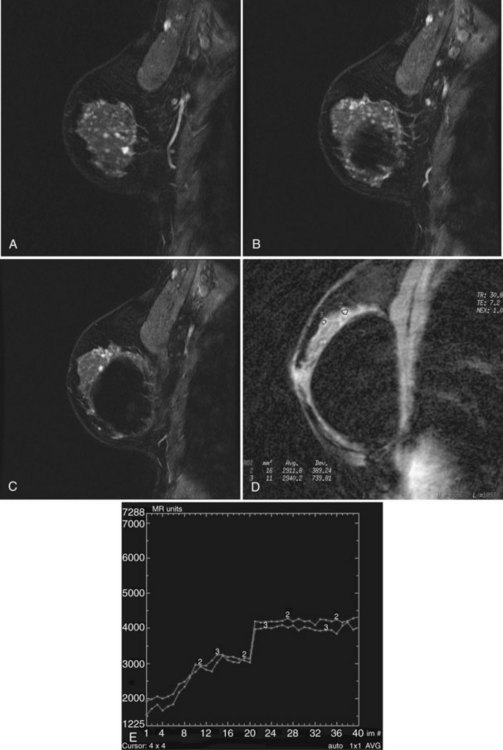
Poor breast tissue enhancement may be due to failed contrast injection, which can be confirmed by abnormal dynamic enhancement curves from the heart. The heart usually shows normal rapid, avid initial enhancement and rapid washout. In fact, one of the most common errors in contrast-enhanced breast MRI is the result of a poor bolus of IV contrast. Sometimes, the IV line is injected slowly or may even become detached from the vein; as a result, the contrast never enters the patient. To ensure rapid uptake of contrast and washout of signal intensity within the heart, one checks a region of interest over the heart or a large artery for a rapid intake bolus and late washout on the kinetic curve. This is important because only a good bolus of contrast will translate into breast cancer enhancing rapidly on the MRI scans. An abnormal or poor cardiac kinetic curve tells the radiologist that something is wrong with the contrast injection; further investigation is needed to determine why contrast in the heart did not rise in signal intensity rapidly and washout as expected. Scans that show poor contrast enhancement in the heart indicate a problem with the contrast injection and cannot be trusted to show cancer in the breast (Fig. 7-8).
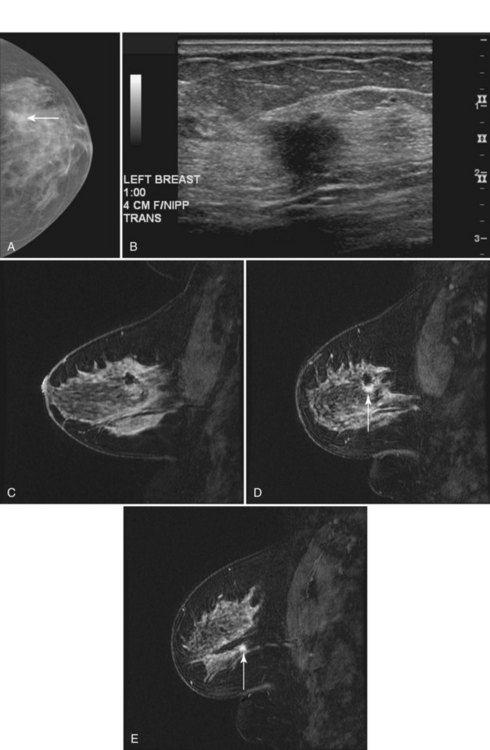
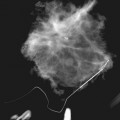
 minutes, it shows an enhancing tumor at the signal void (arrow). E, In addition, a 6-mm mass is noted inferior to the main cancer; this was not seen previously and was undetectable in the background enhancement (arrow).
Breast Lesions: Approach and Lexicon
To interpret studies of lesions on MRI, radiologists use a combination of high-spatial resolution scanning (which produces sharp images for analysis of abnormally enhancing findings or produces analysis by lesion morphology) and dynamic imaging (which produces the kinetic curves of an abnormally enhancing finding). In addition, T2-weighted imaging plays a secondary role in distinguishing some benign and malignant lesions (Table 7-4).
Table 7-4 T2-Weighted Imaging of Breast Lesions
| T2 > Glandular Tissue or Muscle | T2 ≤ Glandular Tissue | |
|---|---|---|
| Enhances with contrast | Possible cancer | |
| Nonenhancing | Benign (e.g., cyst or duct) | Benign (e.g., sclerotic fibroadenoma or normal glandular tissue) |
* The exceptions are rare mucinous carcinomas and some invasive ductal cancers, which may enhance and have high T2 signal; irregular, rim-enhancing morphology and dynamic enhancement curves may help with diagnosis.
Morphology
In the high-spatial resolution approach, lesion morphology is evaluated on fat-nulled, 3-D images to look for characteristic shapes, borders, or internal enhancement patterns characteristic of cancer. With this approach, Nunes and colleagues reported a sensitivity of 96% and a specificity of 80% for cancer. Leong and colleagues reported similar results. The morphologic characteristics of benign and malignant lesions are summarized in Table 7-1 and Box 7-6, and are shown in Figure 7-9. As discussed elsewhere in this chapter, the radiologist first decides if the finding is a mass or a nonmasslike enhancement. Consistent with mammography, masses with spiculated or very irregular borders are suspicious. Bright enhancement, particularly rim enhancement and enhancing septations, is usually suspicious for tumor angiogenesis. A ductal, linear, or segmental pattern of clumped enhancement is suspicious for ductal carcinoma in situ (DCIS), but it can also be seen in benign duct ectasia or fibrocystic change. As with mammography, entirely smooth, oval, or lobulated masses oriented parallel to Cooper ligaments suggest benign lesions, whereas lesions traversing Cooper ligaments are abnormal and suggest invasive ductal cancer. Nonenhancing internal septations in smooth, oval, or lobulated masses are highly specific for a benign fibroadenoma. Nonenhancing lesions are also benign. However, it is important to evaluate the dynamic curves of benign-appearing enhancing masses because round or oval homogeneous cancers mimic benign fibroadenomas. Sometimes the suspicious kinetic curves may be the only clue that the morphologically benign mass is a cancer.
Dynamic Contrast Enhancement
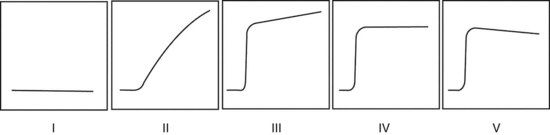
In the dynamic MRI approach, one evaluates a lesion’s signal intensity as a function of time during the bolus IV administration of contrast material (Box 7-7). The dynamic curves are evaluated according to initial and late enhancement. Initial enhancement describes the curve in the first 2 minutes during the bolus or when the curve begins to change. The late phase of enhancement occurs after the first 2 minutes or after the curve starts to change. The late-phase curve is described as persistent, plateau, or washout, in keeping with the ACR BI-RADS® MRI lexicon. The entire spectrum of the time course of enhancement may be categorized from most benign to most suspicious, according to the following scheme of Daniel and colleagues (Fig. 7-10): nonenhancing (type I), gradually enhancing (type II), or rapidly enhancing with a sustained gradual enhancement, plateau, or early washout (types III, IV, and V, respectively). In reference to the curve shapes depicted in Figure 7-7, types I and II typically indicate benignancy and types IV and V indicate a high likelihood of malignancy. Type III curves are indeterminate. Using a similar approach, Kuhl and colleagues reported a sensitivity of 91% and a specificity of 83%. Kuhl type I curves are gradually enhancing with a late persistent plateau. Kuhl type II curves are rapidly enhancing with a late plateau. Kuhl type III curves are rapidly enhancing with a late rapid washout. There are a few exceptions to these general principles. DCIS may exhibit any of the curve types, including nonenhancing or gradually enhancing curves, shown as types I and II in Figure 7-7. Benign papillomas may exhibit type I, II, III, or even type IV curves shown in Figure 7-7. The geographic distribution of dynamic enhancement also appears to be predictive, with tumors usually enhancing most rapidly at their periphery and benign lesions enhancing most rapidly at the center.
T2-Weighted Imaging
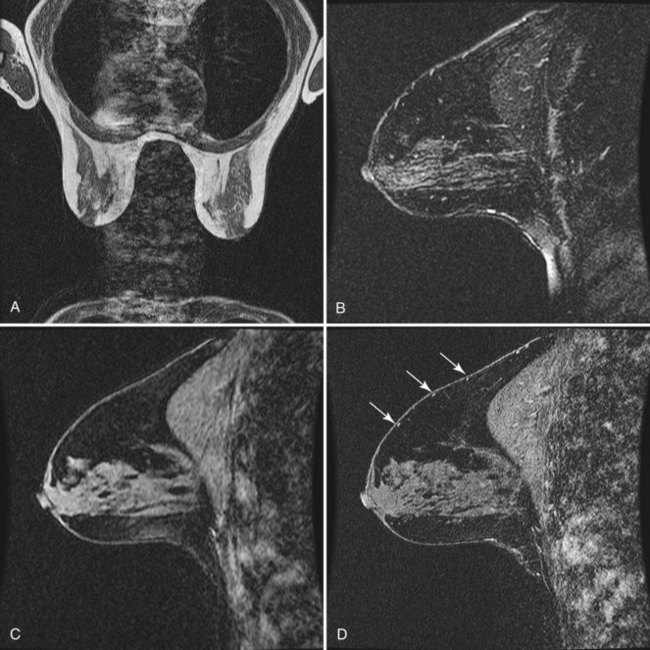
T2-weighted imaging also plays an important role in discriminating which enhancing lesions are likely to be benign or malignant (Fig. 7-11; see also Tables 7-1 and 7-4). Lesions with very high signal, in which the lesion is much brighter than glandular tissue and even higher than fat on nonfat-suppressed T2-weighted FSE images, suggest benign lesions such as cysts, fluid-filled ducts, lymph nodes, or fibroadenomas. Invasive tumor, on the other hand, usually has a T2 signal similar to that of glandular tissue, that is, higher than muscle but not as high as fluid. Low-signal septations within very high-signal smooth oval or lobulated lesions on T2-weighted imaging also suggest benign fibroadenomas. Exceptions to this “rule” include mucinous cancer, which can be very bright on a T2-weighted image. Some invasive ductal cancers also may be bright on T2-weighted images. These T2-bright cancers may show irregular margins and inhomogeneity; however, it is important to check kinetic curves on all masses because occasionally cancer may be round or oval and have smooth borders.
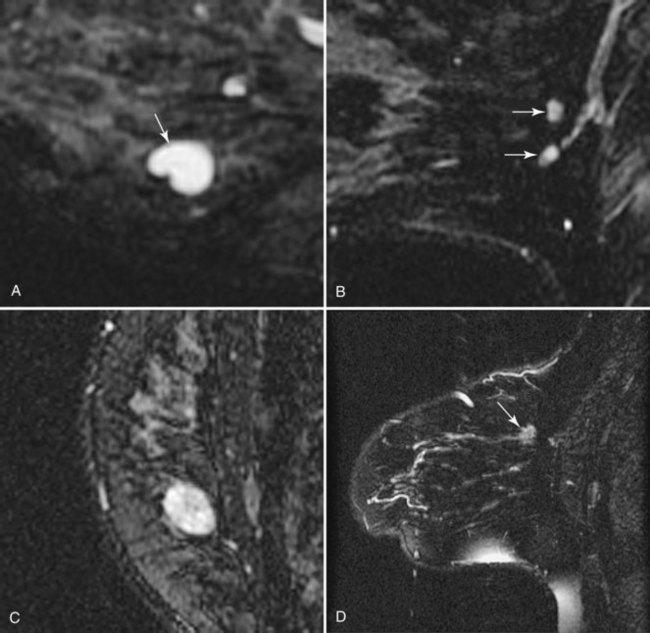
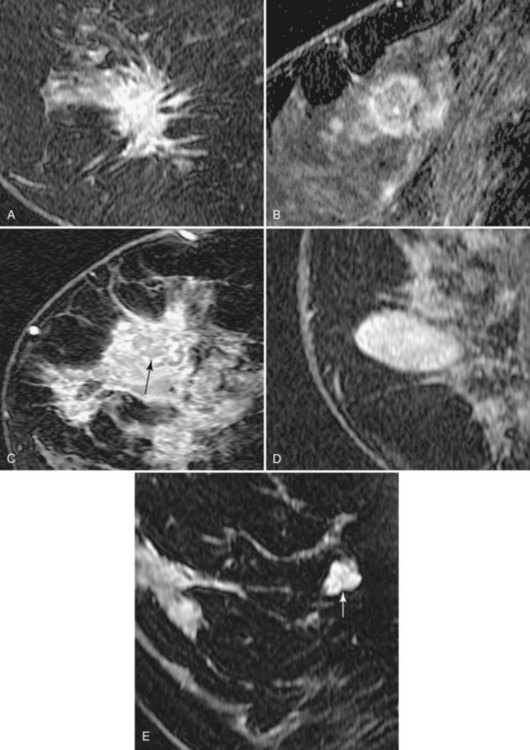
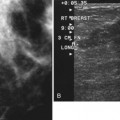
Figure 7-11 T2-weighted imaging features of benign and malignant disease. Very high signal on T2-weighted fast spin-echo images that is brighter than fat (on nonfat-suppressed sequences) and substantially brighter than glandular tissue suggests a benign lesion such as a cyst (A, arrow), intramammary lymph node (B, arrows), or fibroadenoma (C). Low-signal septa are particularly specific for fibroadenoma (see Fig. 7-18A). D, Most malignancies, unless frankly necrotic, have a signal intensity that is similar to that of fibroglandular tissue (arrow).
Approach to Interpretation and Reporting of Breast MRI
The ACR BI-RADS® provides a valuable standard for the terminology used to analyze breast lesions on MRI (Table 7-5) and is recommended for all breast MRI reporting. First, reporting should include a brief summary of the scan technique, including the scanner, field strength, and pulse sequences used; the specifics of contrast injection; and imaging findings and management recommendations.
Table 7-5 American College of Radiology BI-RADS®–MRI Lexicon Terms and Classification Scheme
| Non-masslike Enhancement |
| Morphology Assessment for Masses (select one in each) |
| Shape |
| Margin |
| Enhancement |
| Non-masslike Enhancement |
| Distribution Modifiers (select one) |
| Internal Enhancement (Mass and Non-masslike) (select one) |
| Symmetry (use for bilateral scans only) |
| Other Findings (report all that apply) |
| Kinetic Curve Assessment (select one in each) |
| Initial Rise |
| Delayed Phase |
Note: Stippled = nonconfluent < 2 mm dots of enhancement, sand-like. Heterogeneous = confluent and non-confluent, mixed enhancement. Clumped = confluent regions of enhancement, like cobblestones. Homogeneous = confluent, diffuse enhancement.
Reporting of kinetic data should also include the size of the region of interest used to generate the kinetic data and the location (i.e., edge, center, entire lesion), as well as the overall degree of enhancement (i.e., mild, moderate, strong).
Adapted from American College of Radiology: ACR BI-RADS®—MRI, In ACR Breast Imaging and Reporting and Data System, breast imaging atlas, Reston, VA, 2003, American College of Radiology.
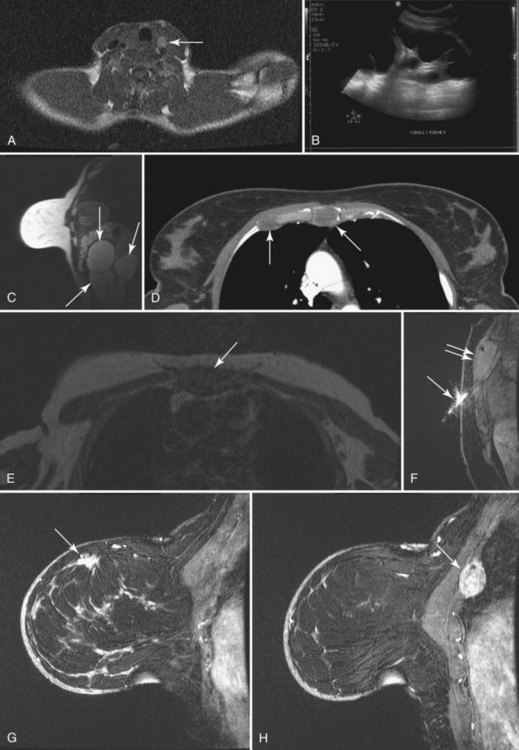
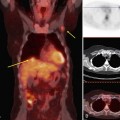
To read the MRI, the radiologist reviews the breast history, clinical symptoms, and results of other imaging tests, such as mammogram, ultrasound, and positron emission tomography/computed tomography (Box 7-8). The radiologist then reviews the T1-weighted axial localizer to evaluate any findings outside the breast. These findings can be seen on either coronal or axial scout images, including fat-suppressed T1-weighted noncontrast axial images. Prior studies looking at findings in the thorax or abdomen outside the breast show lymph nodes within the mediastinum, supraclavicular regions, and other areas that the radiologist may not commonly search. Abnormal findings found elsewhere in the body on the breast MRI include lung cancer, bone metastases, liver lesions (most commonly liver cysts or hemangiomas), thyroid masses, and adrenal or renal masses (Fig. 7-12). A systematic search of the T1-weighted axial images and of the thorax (similar to evaluation of computed tomography scans) helps detect unexpected lesions in the thyroid, mediastinum, lungs, liver, spleen, adrenals, kidneys, and the bony thorax.
Box 7-8 Organized Approach to Breast MRI Interpretation
Breast history and old imaging reports
Review breast and nonbreast anatomy (thyroid, lungs, mediastinum, chest wall, liver, spleen, adrenals, kidneys, bones)
Review axillary lymph nodes (supraclavicular, level I–III, Rotter nodes)
T2-weighted scout noncontrast fat-nulled source
First postcontrast scan with fat nulled, suppressed, subtracted
Estimate background enhancement
High signal findings (higher than background)
Region of interest in heart: Check for good IV contrast bolus
If good bolus: check kinetics on important findings
Compare to history, previous MRIs, and other imaging
Next, the radiologist looks at imaging findings on the first postcontrast scan. Specifically, the first postcontrast scan should have marked enhancement in the heart, blood vessels, and any rapidly enhancing finding, such as cancer or lymph nodes. The scans are usually obtained with the middle of k-space at approximately 90 seconds after the injection of contrast. The radiologist looks for the whitest part of the image and the background enhancement, which represents enhancement greater than normal background enhancement. Multiple foci in background enhancement represent normal findings; the radiologist judges whether it is normal or abnormal based on morphology, symmetry, kinetics, and change over time (Fig. 7-13). Abnormal enhancement findings would then be classified into either normal findings, for which nothing needs to be done, or abnormal findings, which need to be investigated further.
Related posts:
 FDG-PET/CT and the Evaluation of Breast Cancer
 Mammography Acquisition: Screen-Film and Digital Mammography, the Mammography Quality Standards Act, and Computer-Aided Detection
 Mammographic and Ultrasound-Guided Breast Biopsy Procedures
 Mammographic Analysis of Breast Calcifications
 Breast Ultrasound
 Mammogram Interpretation
Stay updated, free articles. Join our Telegram channel

Full access? Get Clinical Tree


