Magnetic Resonance Imaging of Vascular Disorders of the Abdomen

CHAPTER 105 Magnetic Resonance Imaging of Vascular Disorders of the Abdomen


INTRODUCTION


Arterial Imaging


MR evaluation of the abdominal vasculature includes accurate assessment of the arteries and veins, and the optimal imaging method differs for each. For the arterial system, 3D CE MRA is the imaging method of choice. This technology involves the acquisition of a coronal 3D data set that produces images with high spatial resolution and a high signal-to-noise ratio (SNR). A precontrast mask is acquired before the administration of gadolinium (Gd)-chelate contrast agent, and the examination is repeated at specified time points after the administration of Gd to capture vessel enhancement in the early arterial and a more delayed venous phase. The precontrast mask can then be subtracted from the postcontrast acquisitions to produce images of only the vasculature. Although this subtraction technique produces an additive effect with respect to image noise, subtraction of the background soft tissues provides potential benefits in image contrast, in addition to eliminating any image wrap artifact in the phase-encoded direction. However, evaluation of the unsubtracted source data has other advantages, facilitating evaluation of the soft tissues and the vasculature within the same set of images, including superior evaluation of disorders within the vessel walls. For example, the outer wall of a partially thrombosed aneurysm can be identified on the source MRA images, providing a more accurate assessment of size and morphology than a subtracted data set that shows only the patent lumen. This example highlights an inherent disadvantage to conventional angiography, in which only the injected, contrast-filled, patent portion of the vessel lumen can be visualized. 3D CE MRA has the flexibility to provide angiographic-type images with high spatial resolution in addition to evaluation of the vessel wall for improved evaluation of disorders such as partially thrombosed dissections and aneurysms. 3D CE MRA images may also be postprocessed using maximum intensity projection (MIP), rendered into different projections with multiplanar reformations (MPR), useful in the evaluation of the origin and bifurcation of the abdominal vessels. Other postprocessing techniques include shaded surface display and volume rendering, but we have found these to have less value in the evaluation of the abdominal vasculature.


One relative disadvantage to 3D CE MRA is a sensitivity to motion, which results from acquisition times that typically extend into the range of 12 to 15 seconds. This feature of 3D CE MRA generally necessitates acquiring the images during a breath-hold. Timing the breath-hold commands for the patient requires consideration of bolus timing, as proper contrast bolus timing is essential for arterial phase acquisitions. Different techniques of contrast bolus timing have been developed to ensure that image acquisition is initiated at the time of maximal contrast concentration in the vessels of interest, coinciding with the time that the central portion of k-space (which controls image contrast) is acquired. These methods include test bolus injection, real-time bolus tracking, and automated triggering methods. Additional advances involve the use of centric and elliptical k-space ordering, to acquire the central k-space data toward the beginning of the acquisition. These developments have greatly simplified timing of the arterial phase images. For example, real time bolus triggering can be performed when the contrast bolus is tracked using near real time reconstruction at a rate of 0.5 to 1 second per image. The operator starts the contrast injection and then uses bolus tracking images to monitor arrival of the contrast. When the operator sees the contrast bolus approaching the vessels of interest, the patient can be given breath-hold commands and the 3D MRA sequence is initiated. This approach depends on the image contrast being captured at the beginning of the acquisition. For abdominal arterial phase imaging, an optimal approach is for the operator to begin patient breath-hold instructions when the bolus track images show the contrast filling the left ventricle and entering the ascending aorta. The 3D MRA arterial phase images may then be initiated after 3 seconds, providing adequate time for the patient to suspend respiration. Partial Fourier imaging (exploiting the fact that one half of k-space closely mirrors the other half) and parallel processing (using separate inputs from each coil element of the surface coils to provide spatial information, allowing further k-space undersampling) have allowed marked reduction in image acquisition time and reduction of image motion artifacts. Improved gradient performance of newer MR systems has led to shortened repetition (TR) and echo (TE) times with resultant further decreases in acquisition time and image artifacts. This methodology allows for reproducible, high-quality images even in patients with depressed cardiac function and altered flow dynamics.


Venous and Soft Tissue Imaging


Whereas CE 3D MRA is the imaging method of choice for evaluation of the arterial system, venous imaging has different challenges requiring alternative approaches. Standard 3D MRA GRE uses higher flip angles and results in excellent contrast only when the Gd concentration is sufficiently high. In the venous system, standard 3D MRA GRE may result in poor signal and poor image contrast owing to hemodilution of the Gd contrast agent in the venous system. MIP and MPR images of the venous system are also less useful due to persistent arterial enhancement, rendering cluttered views of veins obscured by adjacent and overlying arteries. However, another family of 3D GRE sequences is ideal for imaging of the venous system. Sequences in this 3D GRE family include volumetric interpolated breath-hold examination (VIBE, Siemens Medical Solutions), T1-weighted high resolution isotropic volume examination (THRIVE, Philips Medical Systems) and liver acquisition with volume acceleration (LAVA-xv, General Electric); these yield volumetric acquisitions that may be acquired or reconstructed in any plane and provide excellent soft tissue detail in addition to robust imaging of the vasculature. By using a low flip angle, these 3D GRE sequences yield higher signal and contrast from lower concentrations of Gd, as found in the veins. Even several minutes after Gd administration, excellent signal intensity can be achieved from the venous structures. Thus, acquisition of venous phase images is made straightforward by being relatively insensitive to variations in timing delay. The images show arteries and veins and are complementary to traditional MRA, also providing detailed evaluation of the vessel walls and the soft tissues of the abdomen. This is in contrast to CT, in which suboptimal timing of image acquisition, combined with inherent CT limitations of image contrast on more delayed venous phase-delayed images, often results in poor contrast enhancement within the venous structures. 3D GRE images may be acquired or interpolated to less than 3 mm in- and out-of-plane resolution, providing visibility of smaller vessels. Concurrent soft tissue evaluation allows diagnosis of not only the patient’s vascular pathology, but also of related soft tissue disorders, such as from ischemia, tumor infiltration, metastases, and evaluation of vessel wall and mural thrombus. Precontrast imaging is also useful to differentiate Gd enhancement from intrinsic T1 high signal owing to blood products or proteinaceous fluid.


3D CE MRA and 3D GRE imaging are the major components involved in vascular imaging of the abdomen. However, as described, associated soft tissue detail is critical, especially in imaging of the abdominal vasculature where the consequences of vessel pathology are often quite serious. Comprehensive evaluation of the abdominal vessels should then include an additional small number of selected sequences for morphologic evaluation. The two most useful sequences are single shot T2W (HASTE) sequences with and without fat saturation, and also sequences that use steady-state magnetization, such as True FISP (TFISP). These are rapid, 2D sequences that allow robust imaging even with marked patient motion and do not add a significant time penalty to the overall imaging examination time. In addition to providing alternative views of soft tissue contrast, they offer a back-up evaluation of the vasculature that does not require the administration of Gd chelate. T2W images employ a “black blood” method to evaluate the vessels, as magnetized spins exit the imaged slice between RF excitation and readout in vessels with flowing blood. Thrombosed vessels will not demonstrate this signal void that is seen with flowing blood. More consistent black blood T2W images may be obtained with double inversion recovery T2W images that are often employed in cardiac imaging. In contrast, TFISP sequences employ a “bright blood” method of vascular contrast, but without the administration of Gd. The presence of unspoiled, steady-state magnetization in this sequence brings out high signal in blood, even in the setting of slow flow. Intraluminal thrombus is depicted as relatively lower signal within the vessel lumen, providing an alternate method for vascular analysis. Both of these sequences are also helpful for evaluation of aneurysm size and morphology, and hold up well, even in a free-breathing patient. The combination of 3D CE MRA, 3D GRE, T2W, and TFISP sequences provides a comprehensive evaluation of vascular and soft tissue pathology that is not available in other imaging modalities.


Gadolinium Agent Use and Safety


Concerns regarding the use of Gd-chelate contrast agents in the setting of renal disease have arisen since the initial description of a new disease, nephrogenic systemic fibrosis (NSF),1 and the subsequent correlation between prior Gd-chelate contrast agent exposure and development of NSF in patients with severe renal dysfunction.2 The current understanding of NSF is that nearly all cases have been attributed to exposure to gadodiamide (Omniscan) in more than 90% of peer-reviewed published cases, with the remainder of NSF cases associated with gadoversetamide (Optimark) or gadopentetate dimeglumine (Magnevist) exposure. Gadodiamide has relatively lower conditional stability, and it is believed that prolonged exposure to this agent, as occurs in the setting of reduced renal clearance, leads to greater chelate ligand dissociation and deposition of free gadolinium in tissues, including skin, leading to activation of the fibrotic process associated with NSF. NSF is primarily a disease affecting patients with severely impaired renal function (less than 15 mL/min) and mostly affecting patients on dialysis.1 Furthermore, NSF risk and severity appears to correlate with higher single and cumulative total gadodiamide dose.3 However, the risk of NSF using low dose, high relaxivity linear agents or high conditional stability cyclic agents appears immeasurably small; there remain no documented cases of NSF in the peer-reviewed literature with any of these other agents. Given concerns regarding NSF, we currently use a dose of 0.05 to 0.1 mmol/kg of a more stable high relaxivity linear or macrocyclic Gd-chelate contrast agent, mixed with an equal volume of normal saline. The contrast is then injected at a rate of 2 mL/s, followed by at least 20 mL of saline flush using a dual-chamber injector, which allows for a continuous influx of gadolinium during imaging. Our current understanding of NSF, and of contrast-induced nephropathy (CIN) associated with iodinated CT contrast, supports preferential use of contrast enhanced MRI over CT in patients with impaired renal function.4 Not yet published data documenting immeasurably low risk of higher cumulative dose administrations of high conditional stability cyclic agents may help to further define these dosage recommendations.


Cirrhosis and Portal Hypertension


Etiology and Pathophysiology


Portal hypertension is an end-stage pathophysiologic state that arises from a variety of causes, all with a common thread of inducing increased resistance to portal venous flow into the hepatic sinusoids. Causes of portal hypertension include prehepatic (portal and mesenteric thrombosis), hepatic (intrinsic liver disease) and posthepatic (outflow obstruction of the draining hepatic veins). By far, the most common of these etiologies is intrinsic liver dysfunction, usually caused by viral hepatitis or alcohol. Regardless of the etiology, repeated liver injury induces changes of hepatic fibrosis which cause mechanical obstruction to portal flow in the hepatic sinusoids. There is also an alteration in the vasoactive substances present in the liver, which causes vasoconstriction of the portal vasculature. This common pathway of hepatic injury leading to portal inflow resistance causes predictable morphologic changes in the portal and mesenteric vasculature that are diagnostic of portal hypertension.


The parenchymal and vascular changes seen with MRI parallel the pathophysiologic changes occurring within the portal venous system, and are reflective of the underlying resistance to portal flow in the hepatic sinusoids. Chronic liver disease induces vasoconstriction within the hepatic microcirculation, owing to a relative lack of nitrous oxide (NO) and the action of potent vasoconstrictors.5 The larger portal venous branches dilate in a compensatory effort to increase portal flow. The reduction in NO within the hepatic microcirculation is reversed in the splanchnic vasculature,5 which also dilates in an attempt to increase portal flow and overcome developing resistance. An enlarged portal vein, superior mesenteric vein (SMV), and splenic vein are clear indicators of portal hypertension (Fig. 105-1). Flow in the portal vein, normally directed into the liver (hepatopetal) eventually reverses direction away from the liver (hepatofugal). These altered flow dynamics are most commonly assessed with ultrasound, although MRI has the capability to provide additional functional measures of portal flow that better correlate with the severity of cirrhosis and portal hypertension when compared with ultrasound.6 Continued increased resistance to portal flow in the hepatic sinusoids results in shunting of portal blood to the systemic venous system at predictable locations. Shunted blood pools at these sites of portosystemic anastomosis, causing the formation of varices.


Manifestations of Disease


Imaging Indications and Algorithm


MRI has the unique ability to characterize underlying hepatic parenchymal changes prior to the development of frank portal hypertension. The hepatic fibrosis caused by repeated liver injury is seen on delayed phase, 3D GRE images, showing a fine or coarse reticular pattern of enhancement in the underlying hepatic parenchyma (Fig. 105-2). This reticular parenchymal enhancement can identify fibrotic liver disease before morphologic changes of cirrhosis and portal hypertension develop. This is a powerful tool in that it allows for an earlier, more aggressive treatment plan in patients at high risk for chronic liver disease. Conventional catheter angiography assesses strictly vascular morphology, which only typically becomes abnormal with more advanced disease and cannot evaluate parenchymal changes of fibrosis. CTA can also provide a noninvasive method of evaluating both vessels and soft tissues; however, it lacks the underlying contrast resolution to adequately assess fibrotic changes in the hepatic parenchyma. In addition, CTA and catheter angiography employ the use of ionizing radiation, a concern especially in the setting of chronic liver disease, which often requires repeated, multiphase imaging. MR is the only modality with the contrast and spatial resolution to fully assess the vasculature and hepatic parenchyma, with the added benefit of not employing ionizing radiation. Currently, early detection of fibrotic liver disease is primarily diagnosed through biopsy, but the use of MR to grade liver fibrosis may reduce the need for liver biopsy, which carries risks of hepatic injury, bleeding, and infection.


Imaging Techniques and Findings


MR


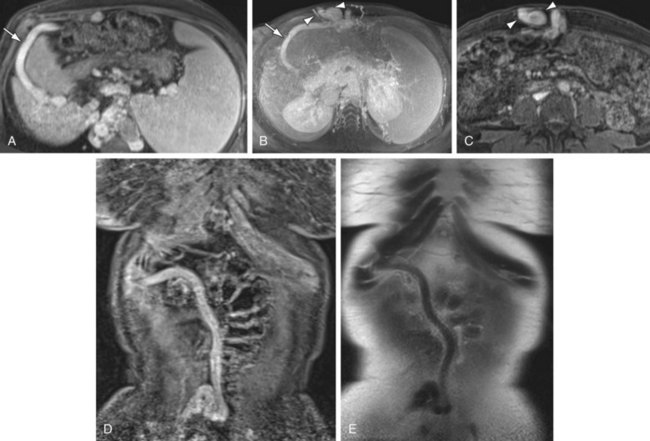
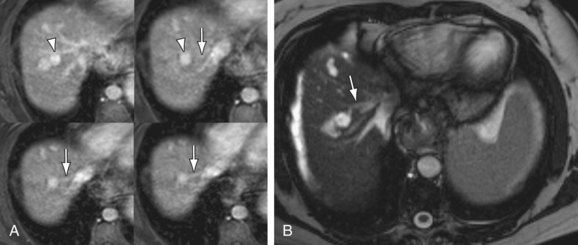
The most dangerous consequence of portosystemic shunting is bleeding from esophageal varices (Fig. 105-3). Varices may be identified within the esophageal wall (termed esophageal varices) or surrounding the esophagus (termed paraesophageal varices), although both drain the portal system via the left gastric (cardinal) vein. Additional common sites of variceal formation within the abdomen due to portosystemic shunting include gastric and retroperitoneal varices, spontaneous splenorenal shunts, and recanalized paraumbilical veins. Recanalized paraumbilical veins drain into the epigastric veins along the undersurface of the abdominal wall, often forming a mesh of dilated varices surrounding the umbilicus termed caput medusa (Fig. 105-4). Identification of paraumbilical varices are important in that the draining meshwork of superficial veins along the anterior abdominal wall must be avoided during diagnostic and therapeutic paracenteses that are often performed in patients with chronic liver disease. Although less common, intrahepatic portosystemic (venovenous shunts) may also occur in the setting of chronic liver disease as a result of increased portal resistance. These shunts have been described at the microscopic level7 and can also be identified with MR (Fig. 105-5). Other etiologies of intrahepatic portosystemic shunting include congenital malformations and rupture of a portal vein aneurysm into a hepatic vein, whereas post-traumatic shunts are most often associated with surgical interventions such as transhepatic catheter placement.


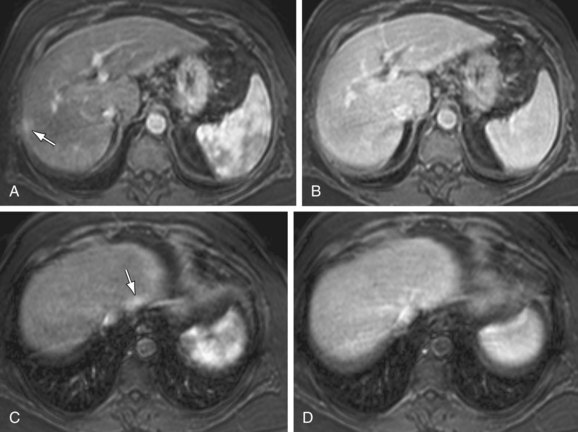
In addition to portosystemic shunting, chronic liver injury and fibrosis also causes arterioportal shunting, either secondary to underlying tumor (hepatocellular carcinoma) or cased by the parenchymal changes of fibrosis itself. These arterioportal shunts manifest on MR as small, linear- or wedge-shaped blushes of enhancement on arterial phase imaging, most often located along a capsular surface (Fig. 105-6). These foci of enhancement may be mistaken for a small tumor on CT owing to a relative lack of contrast resolution. However, MRI can more easily differentiate these small arterioportal shunts (APS) from hepatocellular carcinoma (HCC) in the majority of cases because the APS will show a more linear- or wedge-shaped morphology and will not demonstrate the washout and rim enhancement typical of HCC. Arterioportal shunts may also occur in settings other than chronic liver disease, such as trauma, iatrogenic (postbiopsy or surgery), congenital anomalies, or aneurysm rupture.8 APS are associated with both benign (hemangiomas) and malignant (HCC) hepatic tumors.9 APS also contribute to the flow changes seen in portal hypertension. Studies examining flow characteristics in the portal vein with intermittent occlusion of the hepatic artery have demonstrated that APS are a factor in hepatofugal flow of the portal vein in the setting of chronic liver disease.10


Portal and Mesenteric Thrombosis


Imaging Techniques and Findings


MR


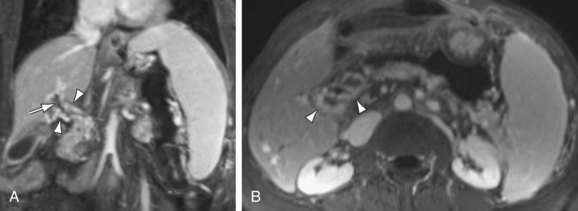
Intraluminal thrombus within the SMV is well demonstrated on MRI with 3D GRE images, providing a noninvasive method for diagnosis (Fig. 105-7). In addition, evaluation of the end-organ effects of mesenteric occlusion is important because the clinical picture varies between acute and chronic presentations, and not all patients require surgery. Bowel pathology can be evaluated concurrently with the vasculature using MRI, with ischemia demonstrating increased signal on fat-saturated T2W images secondary to inflammation and edema caused by venous congestion. The presence of bowel ischemia as identified by MR may prompt more aggressive therapy, with both percutaneous and intraoperative catheter-directed therapy demonstrating good results.11 Thrombosis of the splenic vein is a cause of isolated gastric varices and has been treated with splenectomy in the past, although percutaneous therapy has also been successful.


Stay updated, free articles. Join our Telegram channel

Dec 26, 2015 | Posted by in CARDIOVASCULAR IMAGING | Comments Off on Magnetic Resonance Imaging of Vascular Disorders of the Abdomen

Full access? Get Clinical Tree

Get Clinical Tree app for offline access