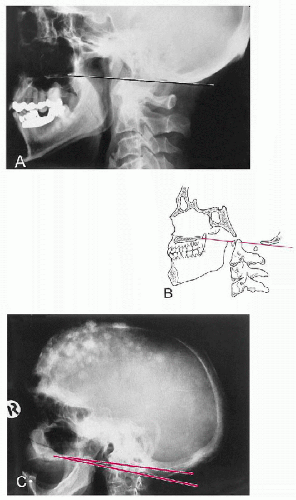
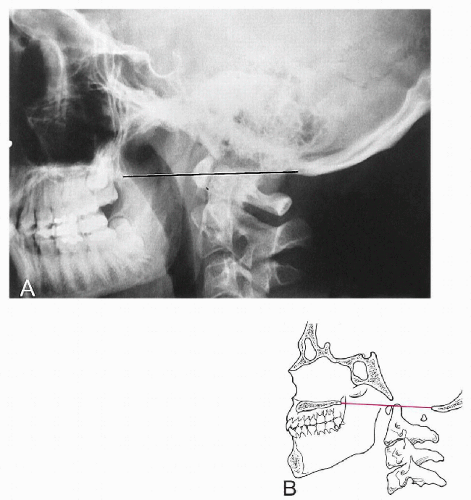
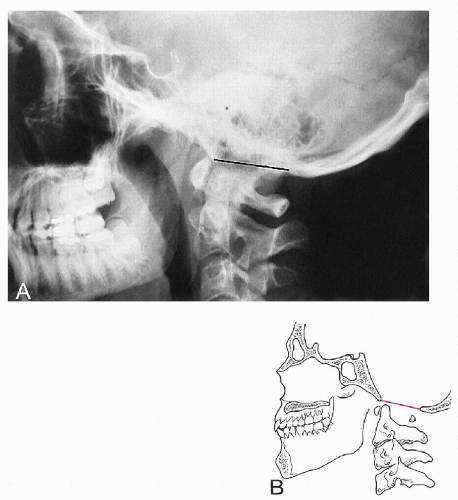
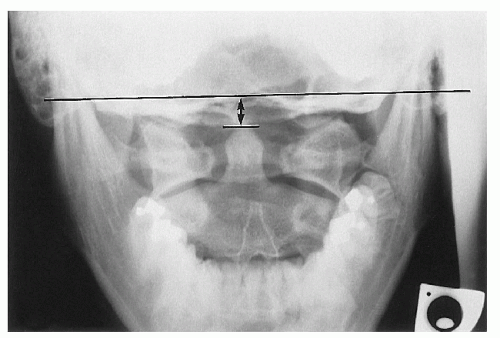
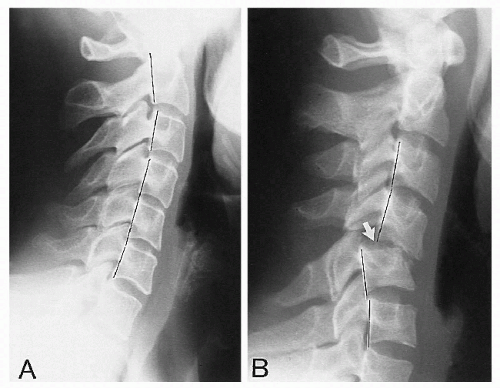
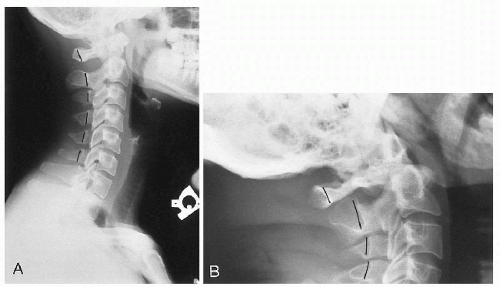
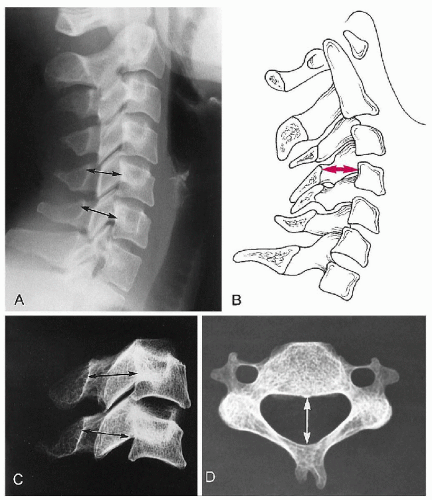
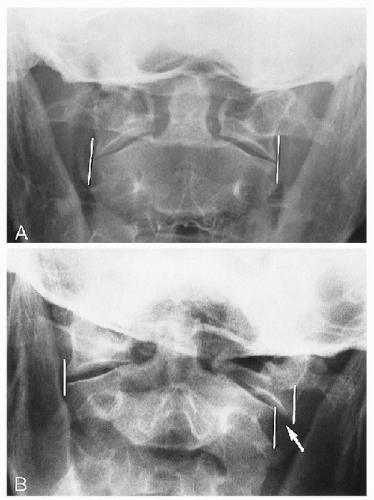
The application of standard lines and measurements to radiographs often allows the detection of subtle abnormalities and assists in avoiding misdiagnosis.
Comparison of studies is facilitated. This may allow regression or progression of the disorder to be recognized and the response to therapy quantified.
Inherent errors in skeletal measurements are well recognized and must be minimized. The major errors arising in the mensuration process include (a) image unsharpness (image quality), (b) projectional geometric distortion, (c) inconsistency in patient positioning, (d) individual anatomic variation, (e) imprecision in locating standard reference points, and (f) observer error. (1,2,3,4)
The normal range within a population for age and sex must be known as well as the significance of an abnormal measurement.
Applying a measurement or line analysis system does not replace a pathologic evaluation of radiographs. Measurements and lines should be applied only after the film has been pathologically evaluated. No films should be obtained purely for a line or angular analysis.
Accurate measurements cannot be made on poor-quality or poorly positioned radiographs.
Drawing on radiographs should be done only with a medium that can be readily removed without defacing the image, in case the need arises. Lines and angles should be marked on radiographs as sparingly as is clinically practicable.
Any measurement made should not be the sole criterion for a diagnosis or for establishing a treatment regime. All measurements must be correlated clinically.
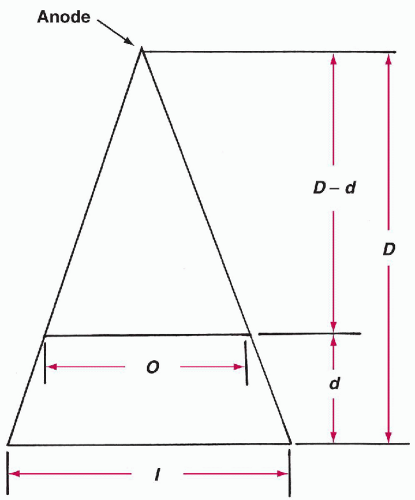
Film image dimension (cm) (I)
Target film distance (cm) (D)
Object film distance (cm) (d)
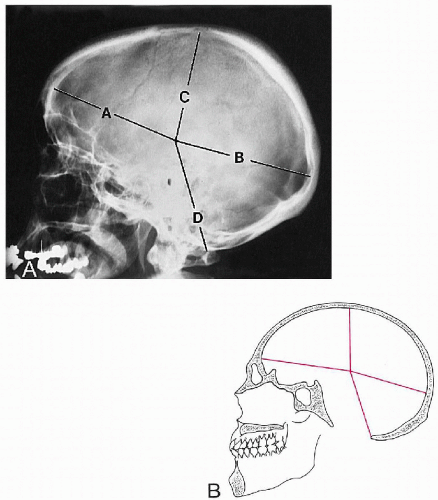
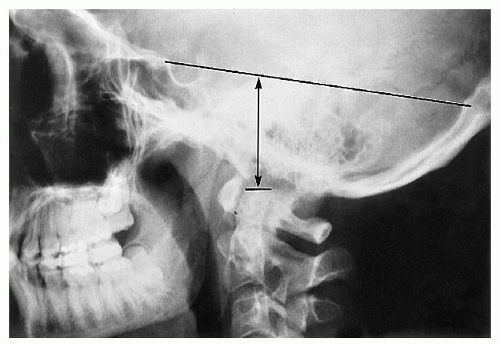
The greatest distance from the pineal gland to the inner table of the frontal bone
The greatest distance from the pineal gland to the inner aspect of the occipital bone
The greatest distance from the pineal gland to the inner table of the skull vertex
The greatest distance from the pineal gland to the posterior margin of the foramen magnum
Anteroposterior (AP) position. Measurement A is plotted against the sum of A and B and should fall within the specified range.
Superoinferior position. Measurement C is plotted against the sum of C and D and also should fall within a specified range. (2)
Table 2-1 Normal Values for Sella Turcica Size | ||||||||||||
|---|---|---|---|---|---|---|---|---|---|---|---|---|
|
Table 2-2 Normal Values for Basilar Angle | ||||||
|---|---|---|---|---|---|---|
|
Table 2-3 Normal Values for Digastric Line | ||||||||||||
|---|---|---|---|---|---|---|---|---|---|---|---|---|
|
Table 2-4 Normal Values for Height Index of Klaus | ||||
|---|---|---|---|---|
|
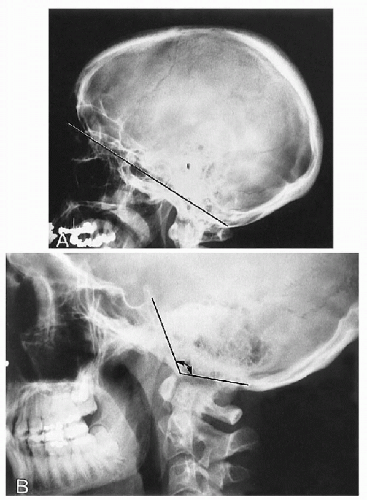
Boogard’s angle. (a) A line is drawn between the basion and the opisthion (Macrae’s line). (b) A second line is drawn from the dorsum sellae to the basion along the plane of the clivus. (c) The angle between these two lines is measured. (15) (Fig. 2-10B)
Boogard’s line. The basion should lie below this line.
Boogard’s angle. See Table 2-5.
Table 2-5 Normal Values for Boogard’s Angle | ||||||
|---|---|---|---|---|---|---|
|
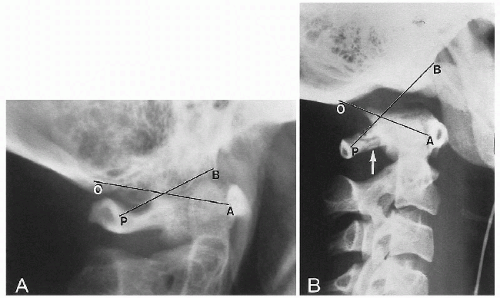 Figure 2-11 ATLANTO-OCCIPITAL RELATIONSHIP. A. Normal Relationship. B. Anterior Dislocation. See text. Observe the posterior arch fracture of C1 (arrow). (Courtesy of Steven B. Wasserman, DC, Long Beach, California.) |
Table 2-6 Normal Values for Atlantodental Interspace | |||||||||
|---|---|---|---|---|---|---|---|---|---|
|
Table 2-7 Normal Sagittal Diameters for the Cervical Spine | ||||||||||||||||||||||||||||||||
|---|---|---|---|---|---|---|---|---|---|---|---|---|---|---|---|---|---|---|---|---|---|---|---|---|---|---|---|---|---|---|---|---|
|
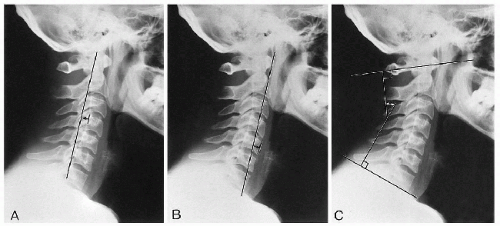
Depth of cervical curve. A line is drawn from the superior posterior aspect of the odontoid to the posterior inferior corner of C7. The greatest transverse distance between this line and the posterior vertebral bodies is measured. (32) (Fig. 2-19A)
Method of Jochumsen. A line is drawn from the anterior border of the atlas anterior tubercle to the anterosuperior corner of the C7 body. The distance from this line to the anterior border of the C5 body is then measured. (33) (Fig. 2-19B)
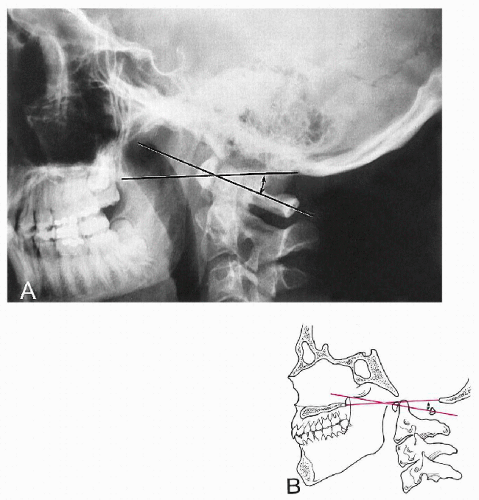
Angle of cervical curve. Two lines are drawn, one through and parallel to the inferior endplate of the C7 body and the other through the midpoints of the anterior and posterior tubercles of the atlas (atlas plane line). Perpendiculars are then constructed to the point of intersection; the resultant angle is measured. (34) (Fig. 2-19C)
Method of Gore. A line is drawn through the posterior surface of the C2 body and another through the posterior surface of the C7 body. The angle formed by these two lines is measured. (28)
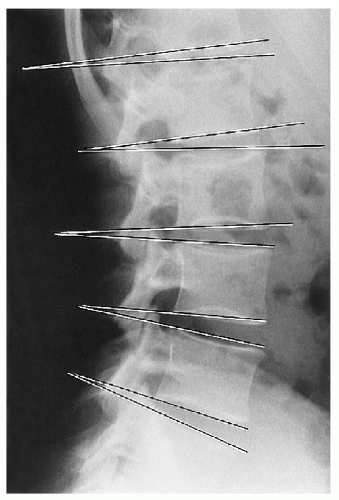
Method of Drexler. This is a laborious but accurate method. Each individual segment is assessed by drawing lines along the body endplates and measuring the resultant angle. The lordosis value is the cumulative total of each intersegmental measurement. (35)
Table 2-8 Normal Values for Cervical Lordosis | ||||||||||||||||||||
|---|---|---|---|---|---|---|---|---|---|---|---|---|---|---|---|---|---|---|---|---|
|
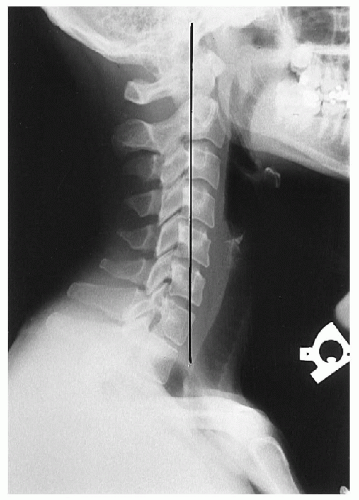
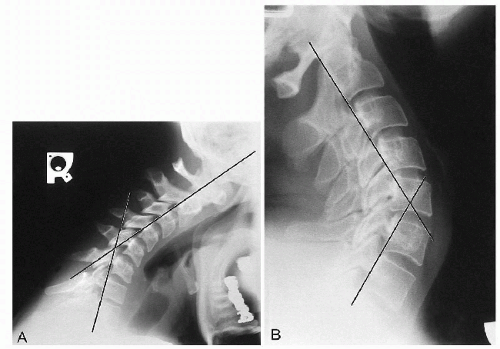
Flexion. These lines normally should intersect at the level of the C5-C6 disc or facet joints.
Extension. These lines normally should intersect at the level of the C4-C5 disc or facet joints.
Table 2-9 Normal Values for Cervical Prevertebral Soft Tissues | ||||||||||||||||||||||||||||||||
|---|---|---|---|---|---|---|---|---|---|---|---|---|---|---|---|---|---|---|---|---|---|---|---|---|---|---|---|---|---|---|---|---|
|
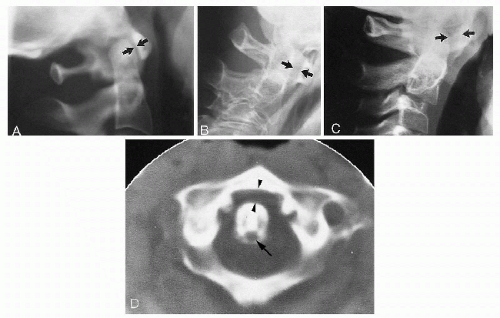
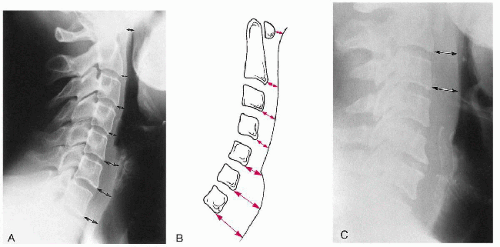 Figure 2-21 PREVERTEBRAL SOFT TISSUE. A and B. Prevertebral Soft Tissues. See text. Areas of measurement are shown (arrows). C. Abnormal Retropharyngeal Soft Tissue Measurement. The abnormality is the result of hematoma formation after cervical trauma (arrows). (Courtesy of Norman W. Kettner, DC, DACBR, St. Louis, Missouri.) |
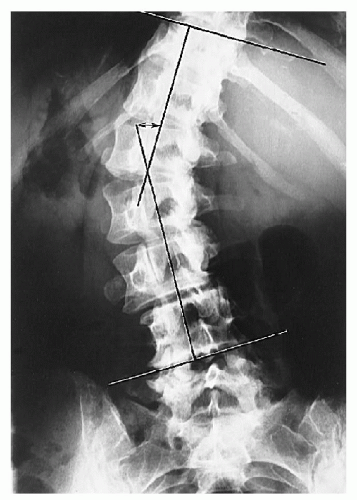
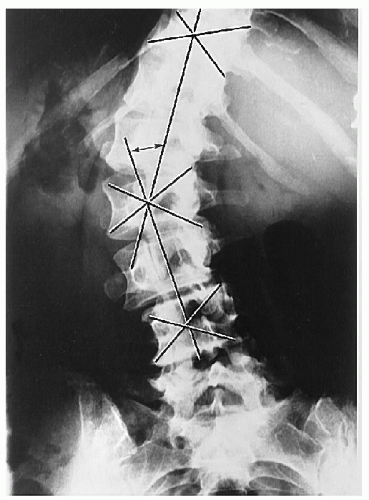
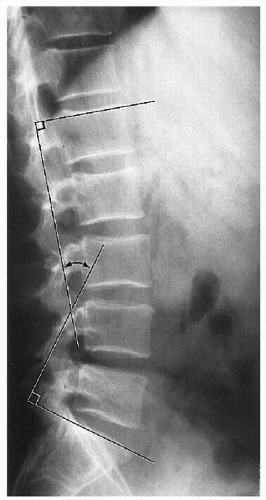
End vertebrae. There are two, one each located at the superior and inferior extremes of the scoliosis. They are defined as the last segment that contributes to the spinal curvature. They appear as the last segment at the extreme ends of the scoliosis, where the endplates tilt to the side of the curvature concavity.
Endplate lines. On the superior end vertebra, a line is drawn through and parallel to the superior endplate. On the inferior end vertebra, a line is constructed in a similar manner through and parallel to the inferior endplate.
Perpendicular lines. At right angles to both endplate lines, lines are drawn to intersect, and their resultant angle is measured. (Fig. 2-22)
End vertebrae. Same as described for Cobb’s method.
Apical vertebra. This vertebral segment is the most laterally placed in the curve and usually is the most rotated.
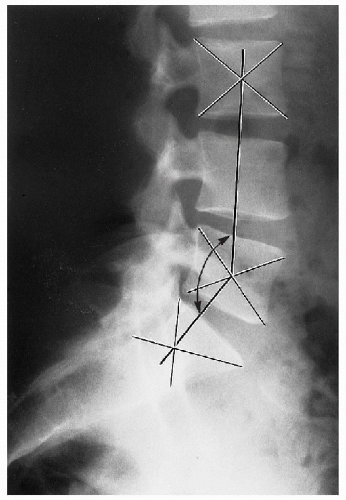
Vertebral body center. For each end vertebra and apical segment diagonals are drawn from opposing corners of the body to locate the body center.
Connecting line. Two lines are constructed connecting the body centers of the apical segment with each end vertebra, and the resultant angle is measured. (Fig. 2-23)
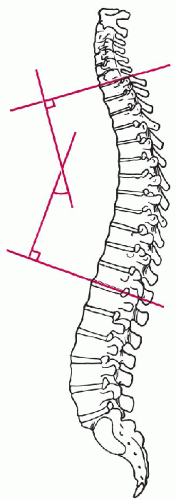
Table 2-10 Degree of Normal Kyphosis in Females by Age | ||||||||||||||||||||||||||||||||||||||||||||||||||
|---|---|---|---|---|---|---|---|---|---|---|---|---|---|---|---|---|---|---|---|---|---|---|---|---|---|---|---|---|---|---|---|---|---|---|---|---|---|---|---|---|---|---|---|---|---|---|---|---|---|---|
| ||||||||||||||||||||||||||||||||||||||||||||||||||
Table 2-11 Degree of Normal Kyphosis in Males by Age | ||||||||||||||||||||||||||||||||||||||||||||||||||
|---|---|---|---|---|---|---|---|---|---|---|---|---|---|---|---|---|---|---|---|---|---|---|---|---|---|---|---|---|---|---|---|---|---|---|---|---|---|---|---|---|---|---|---|---|---|---|---|---|---|---|
| ||||||||||||||||||||||||||||||||||||||||||||||||||
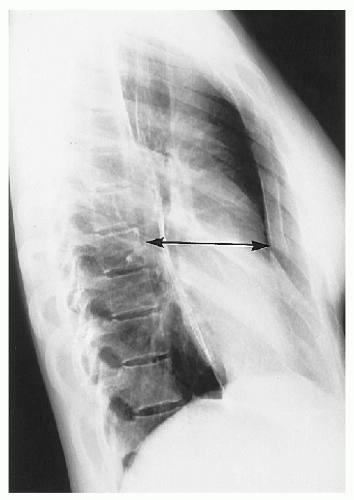
Table 2-12 Normal Sagittal Dimensions of the Thoracic Cage | ||||||||||||
|---|---|---|---|---|---|---|---|---|---|---|---|---|
|
Table 2-13 Sagittal Dimensions of the Thoracic Cage in Straight Back Syndrome | ||||||||||||
|---|---|---|---|---|---|---|---|---|---|---|---|---|
|
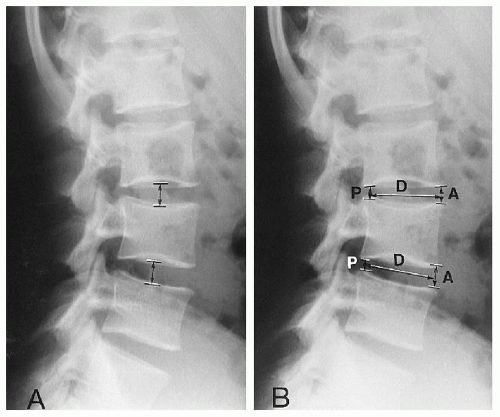
Hurxthal’s method. The distance between the opposing endplates at the midpoint between the anterior and the posterior vertebral body margins is measured. (3) (Fig. 2-26A)
Farfan’s method. The anterior disc height (A) and posterior disc height (P) are measured and expressed as a ratio to disc diameter (D). These two ratios are then reduced to a ratio of each other. (4) (Fig. 2-26B)


where AHR is anterior height ratio, PHR is posterior height ratio, and DH is disc height.
Table 2-14 Normal Values for Lumbar Intervertebral Disc Angles | ||||||||||||
|---|---|---|---|---|---|---|---|---|---|---|---|---|
|
Table 2-15 Normal Values for Lumbosacral Lordosis | ||||||
|---|---|---|---|---|---|---|
|
Table 2-16 Normal Values for Sacral Inclination | ||||||
|---|---|---|---|---|---|---|
|
Stay updated, free articles. Join our Telegram channel

Full access? Get Clinical Tree


