Fig. 2.1
Schematic drawing of oligodendrocytes (ODG) extending myelin sheath over the axons. The area devoid of myelin sheath is called as node of Ranvier (arrows), and the nerve impulse propagates from node to node, which is an important function of the myelin sheath for facilitating nerve conduction
2.5.2 MR Imaging of Normal Progression of Myelination
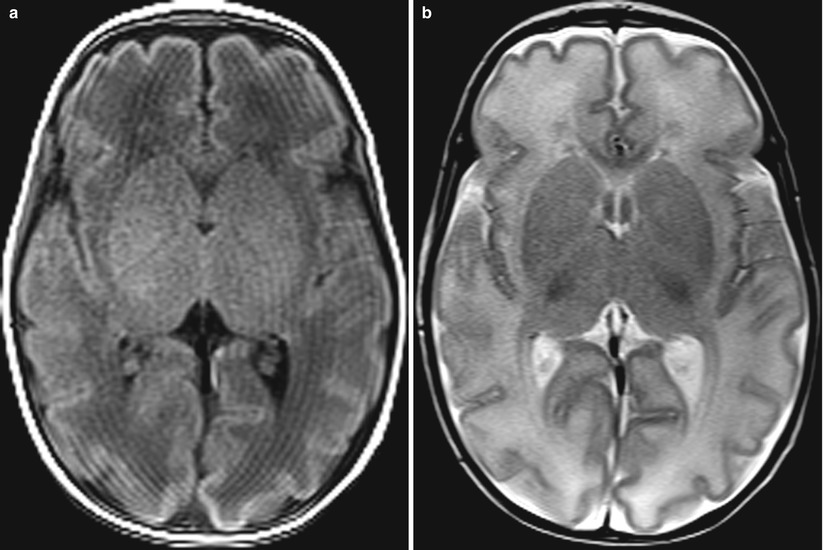
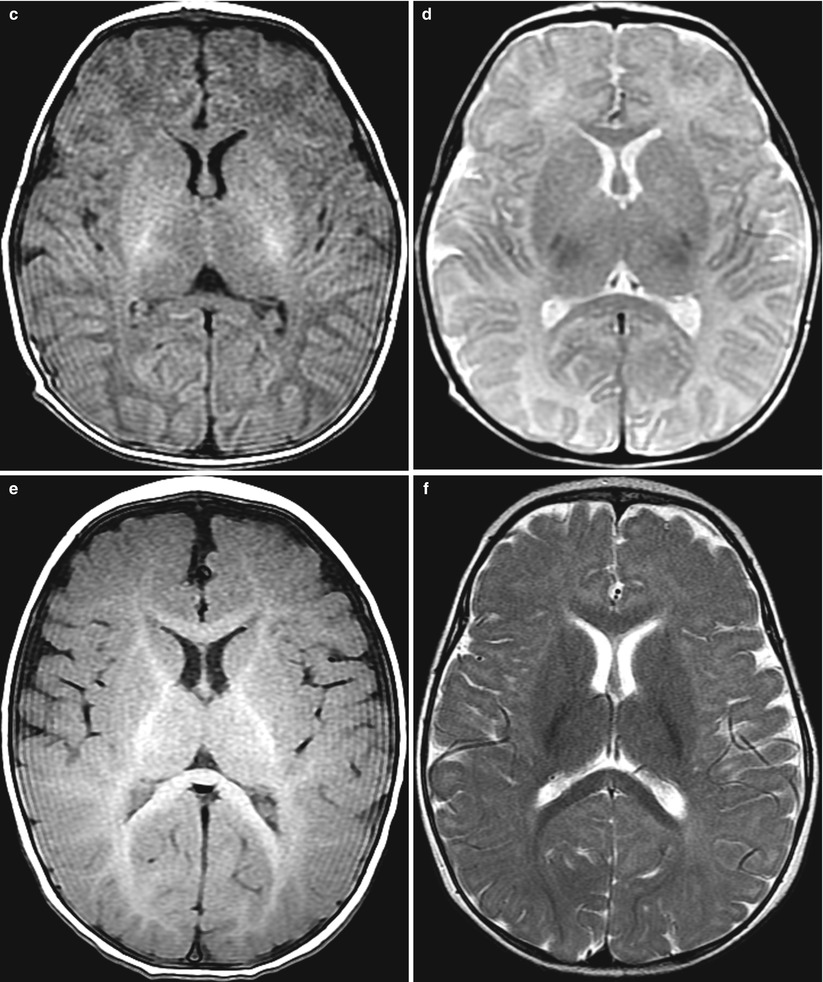
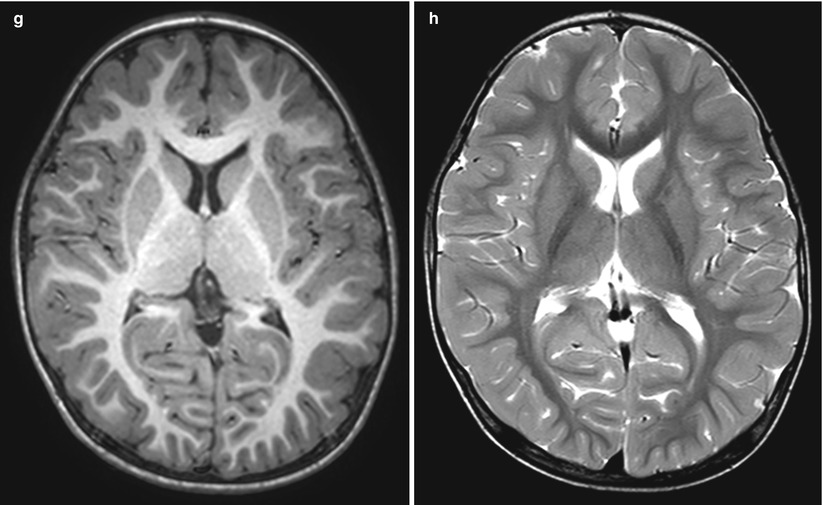
Fig. 2.2
MR imaging of normal progression of myelination. (a, b) MRI at 35 weeks of gestation. (a) T1-weighted image at 35 gestational weeks shows low-signal intensity of the white matters, including the internal capsules. Cerebral cortex shows high-signal intensity. The ventrolateral aspect of the thalamus and dorsolateral aspect of the lentiform nucleus show high-signal intensities. (b) T2-weighted image shows high-signal intensity of the white matters including the internal capsule. The ventrolateral thalamus shows myelinated low-signal intensity. (c, d) MRI at 1 month of age. (c) T1-weighted image shows myelinated white matter high-signal intensity in the posterior limb of internal capsules. (d) T2-weighted image shows low-signal intensity of the ventrolateral thalamus and the posterior limb of internal capsules. (e) T1-weighted image at the age of 5 months shows high signal intensity of the anterior and posterior limbs of the internal capsule and the genu and splenium of the corpus callosum. Occipital white matter shows high-signal intensity in the deep and subcortical regions. (f) T2-weighted image at the age of 7 months shows myelinated low-signal intensities of the entire internal capsule, splenium, and genu of the corpus callosum. Subcortical and deep white matters show high-signal intensity. (g) T1-weighted image at the age of 1 year shows high-signal intensity of the entire white matters. (h) T2-weighted image at the age of 2 years shows low-signal intensity of the entire white matter as an adult pattern
2.5.3 Delayed Myelination in Niemann-Pick Disease
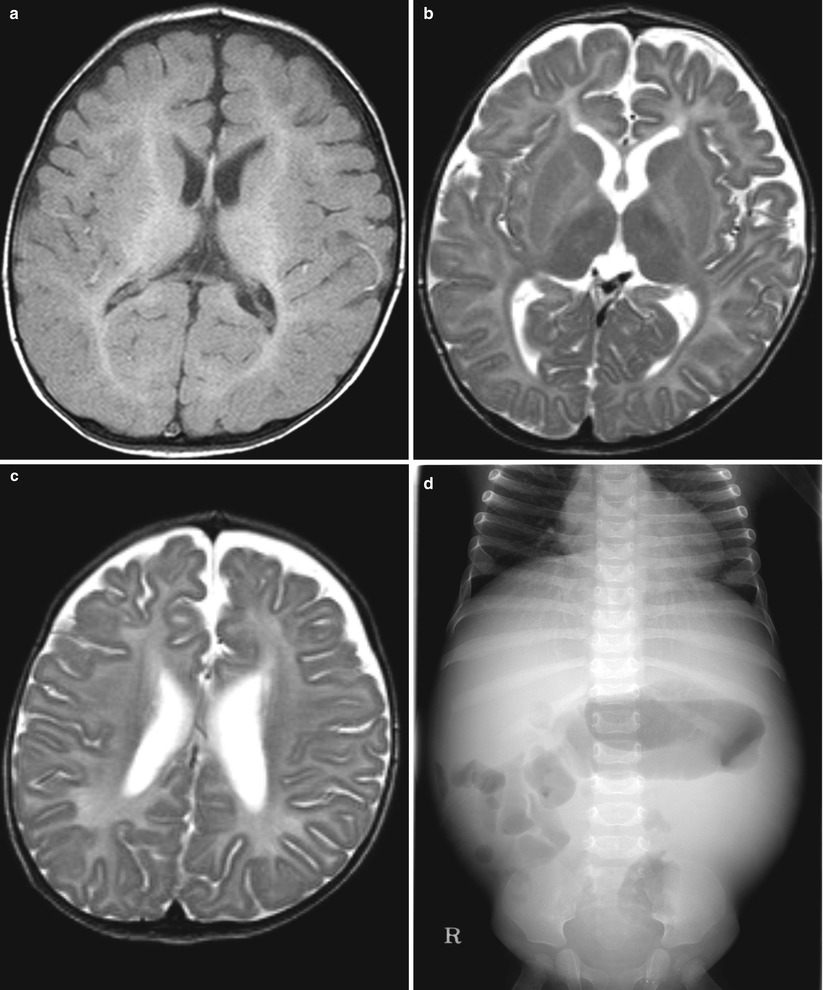
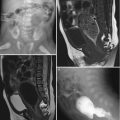
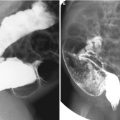
Fig. 2.3
Delayed myelination in Niemann-Pick disease at the age of 15 months. (a) T1-weighted image shows high- signal intensity of the internal capsules. (b, c) T2-weighted images show low-signal intensity of the posterior limb of the internal capsule and optic radiations. The deep white matters are entirely unmyelinated. The myelination pattern is markedly delayed. (d) Plain radiography shows hepatosplenomegaly and the ribs show broadening and coarse trabeculation
2.5.4 Metachromatic Leukodystrophy
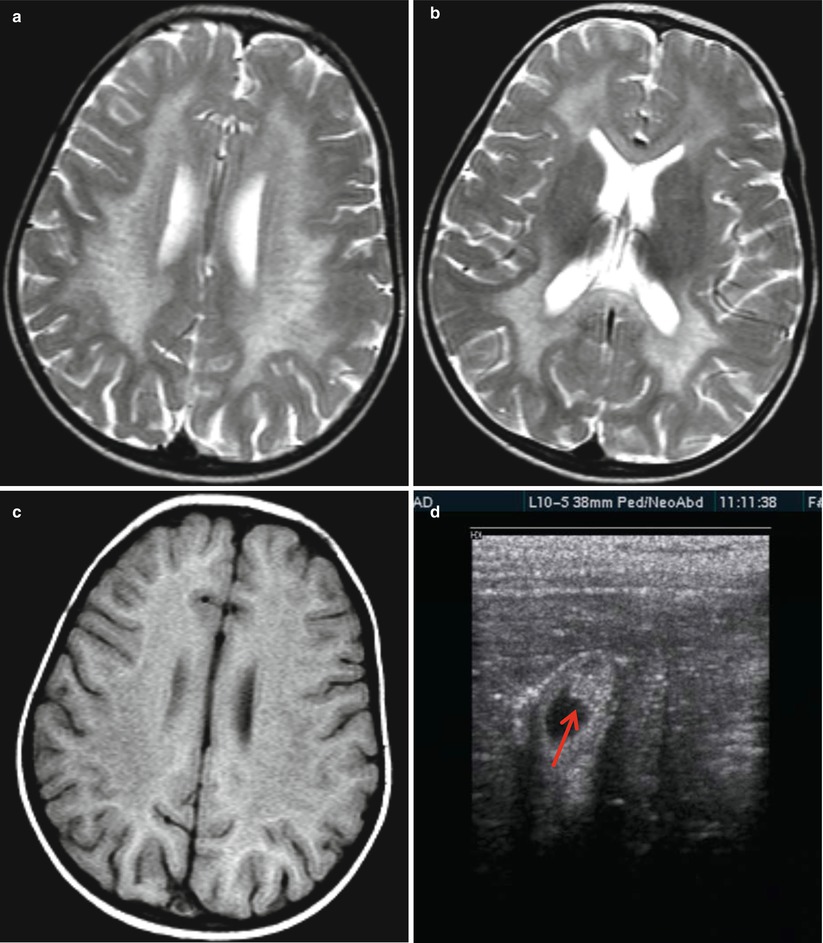
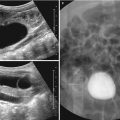
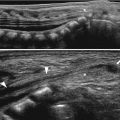
Fig. 2.4
Metachromatic leukodystrophy in a 2-year-old girl. (a, b) T2-weighted image shows bilateral symmetric, confluent high signals of the deep and periventricular white matter extending to the corpus callosum. Fine linear low signals within the high signals perpendicular to the ventricles are seen due to spared axons seen with a leopard appearances. (c) The deep white matter shows diffuse low signals more prominent in the parietal region. (d) US of gallbladder shows thickening of the inner wall (arrow)
2.5.5 Krabbe Disease
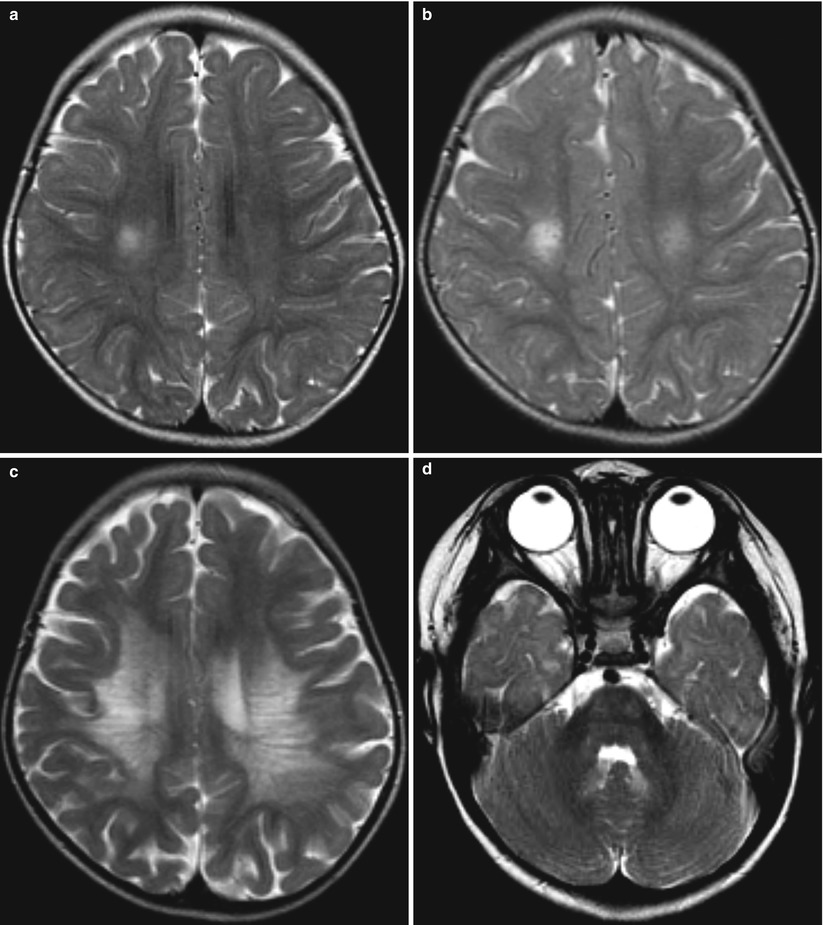
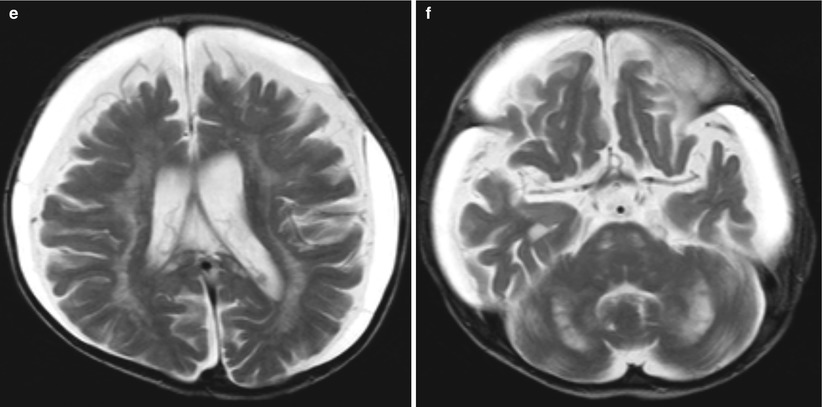
Fig. 2.5
Krabbe disease in an infant with irritability and spasticity (a–d). (a) T2-weighted image shows focal high signals in the right centrum semiovale. (b) Four-month follow-up image shows slight progression of the lesion and newly developed left white matter lesion. (c) Further follow-up after 1 year shows progression of the confluent lesions in both deep white matters. (d) Signal abnormalities are also present in the pontine tracts and cerebellar white matters. (e, f) A 16-month-old girl with Krabbe disease shows advanced brain atrophy with symmetrical abnormalities of cerebral and cerebellar deep white matters. Subdural fluid collections are also present
2.5.6 Mucopolysaccharidoses
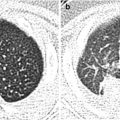
Fig. 2.6
A 2-year-old boy with mucopolysaccharidoses. (a, b) Prominent perivascular spaces are seen as streaky, radiating high signals within the deep and subcortical white matters (arrows) and the corpus callosum. (c) Plain radiography shows medial constriction of the ribs with a canoe pedal appearance
2.5.7 XR Adrenoleukodystrophy
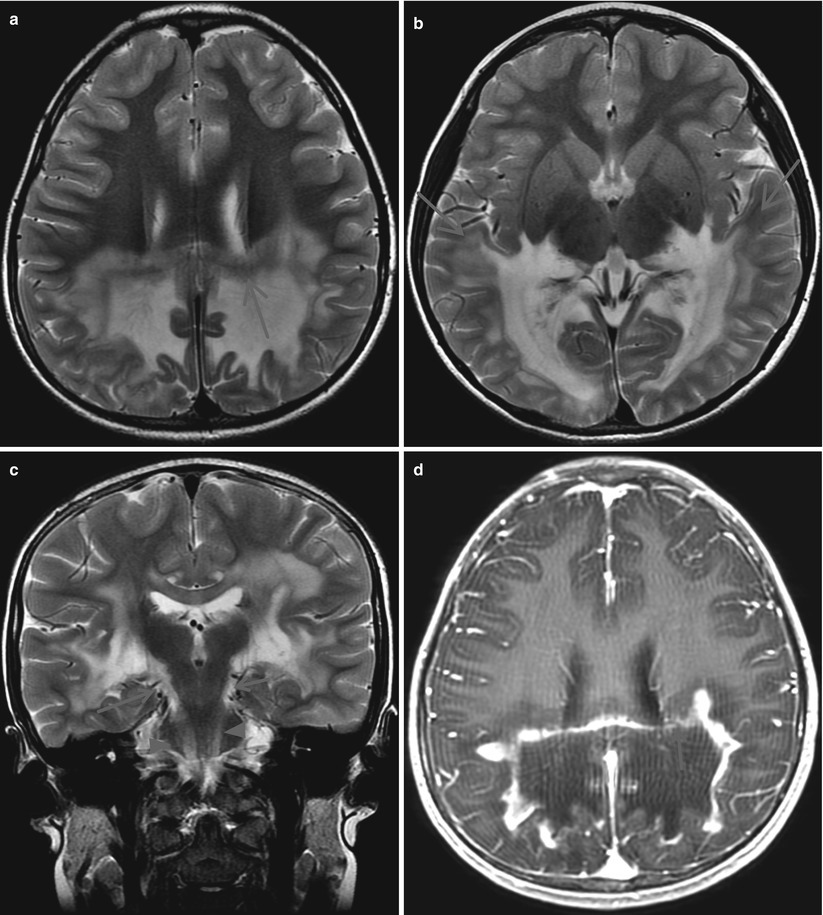
Fig. 2.7
XR adrenoleukodystrophy in an 8-year-old boy. (a) Demyelinated white matters are seen as bilateral confluent high-signal intensities in the parietal periventricular area extending anteriorly. The involved white matter shows three zonal layers with a central lower signal intensity layer (arrow) that shows strong enhancement (arrow) on postcontrast image, suggesting active inflammatory zone (d). (b) Bilateral confluent demyelinating lesions involving the posterior periventricular and deep white matter extend anterolaterally to the acoustic radiations (arrows). (c) Coronal image showing demyelination extends inferiorly through the lateral lemniscus (arrows) and the descending tracts (arrowheads)
2.5.8 Leigh Disease
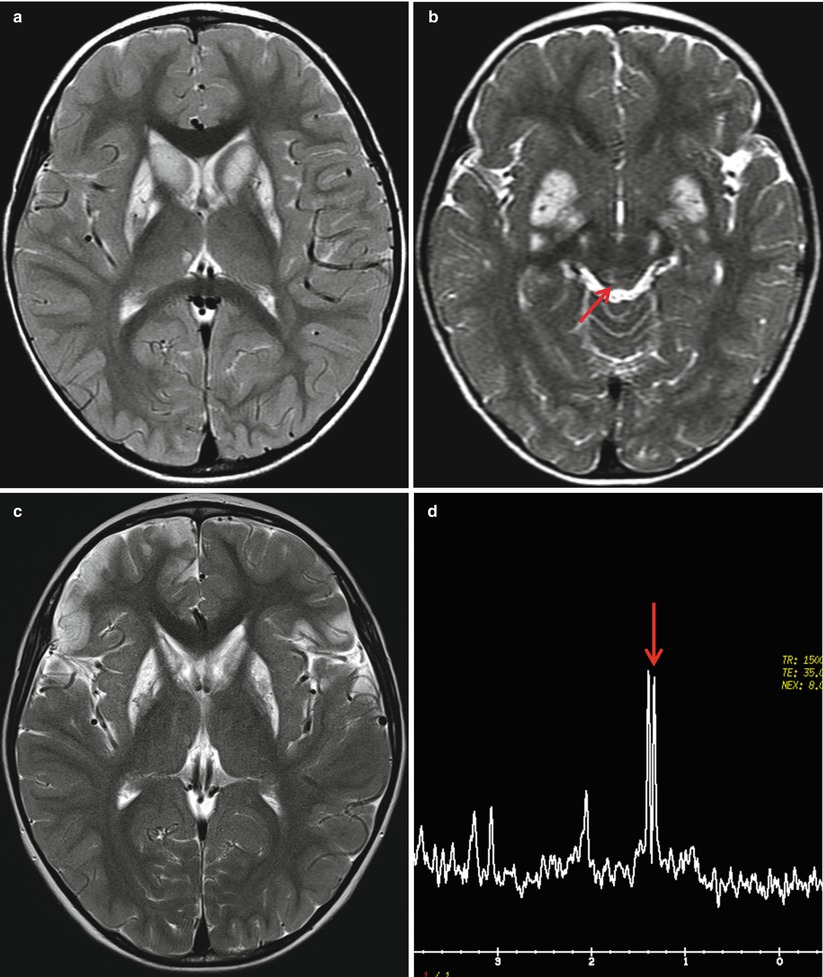
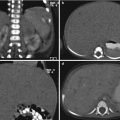
Fig. 2.8
Leigh disease in a 2-year-old boy with gait disturbance. (a, b) T2-weighted images show high-signal intensity of the basal ganglia, midbrain, and periaqueductal gray matter (arrow). (c) Follow-up image after 2 years shows multifocal old infarct-like lesions in the frontal and temporal lobes. (d) MR spectroscopy shows high lactate peak (arrow). Mitochondrial DNA mutation was confirmed
2.5.9 MELAS
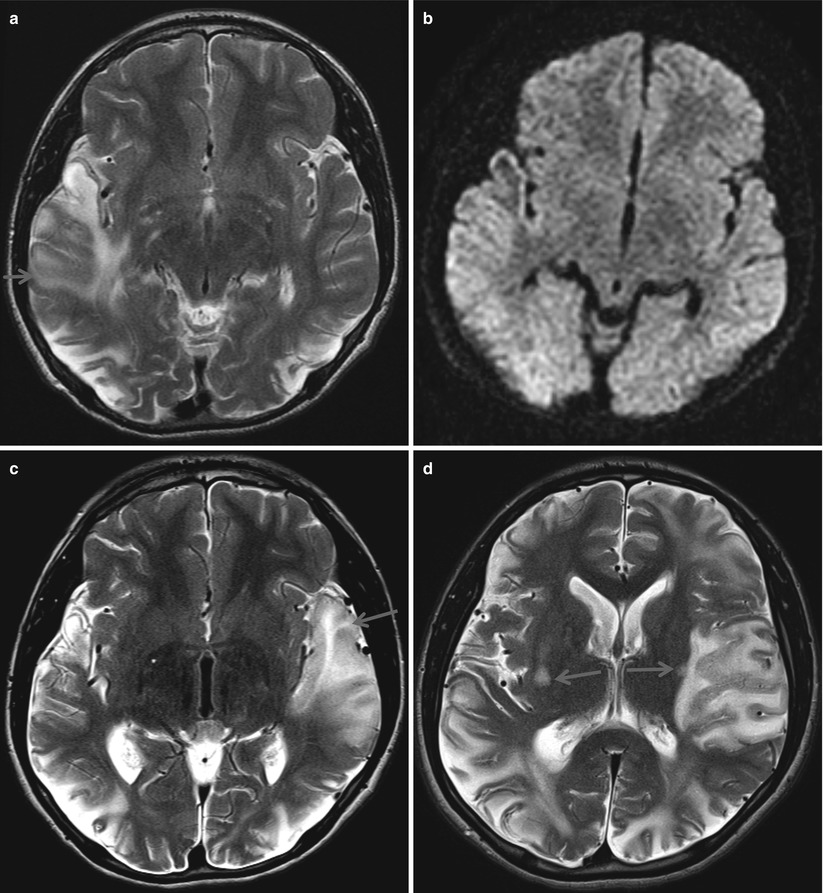
Fig. 2.9
MELAS in an infant with multiple episodes of sudden visual disturbance and stroke. (a) T2-weighted image shows acute swelling in the right temporal lobe (arrow) and old cortical atrophy in both occipital lobes. (b) Diffusion image shows no remarkable diffusion abnormality in the right temporal lobe lesion. (c) Newly developed acute swelling in the left temporal lobe (arrow). The lesion showed restricted diffusion (not shown). (d) Another episode of acute swelling in the left high temporal and frontal lobe. New lesions are also seen in the basal ganglia (arrows)
2.5.10 Glutaric Aciduria Type 1
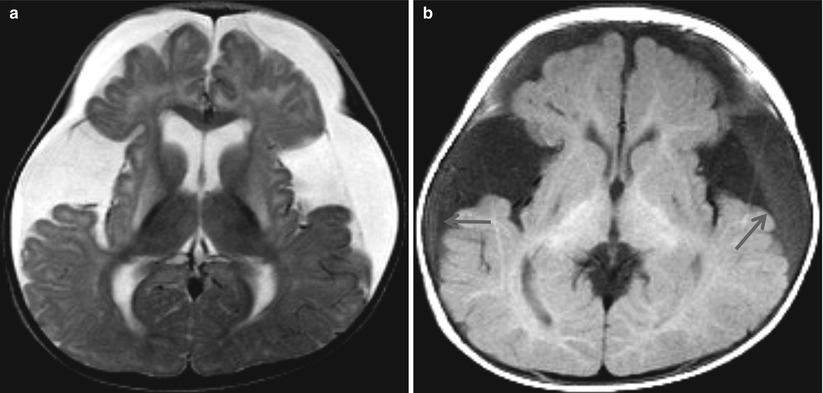
Fig. 2.10


Glutaric aciduria type 1 in a 9-month-old girl with macrocrania and developmental delay. (a) T2-weighted image shows a wide open Sylvian fissure and subarachnoid and subdural fluid collection in the frontotemporal region. Lentiform nucleus shows high-signal intensity in both sides. (b) T1-weighted image also shows a wide Sylvian fissure with subdural fluid collections (arrows) and delayed myelination
Related posts:
Stay updated, free articles. Join our Telegram channel
Full access? Get Clinical Tree
