Metabolic, Endocrine, and Related Bone Diseases
Lee F. Rogers
Leon Lenchik
L. F. Rogers and L. Lenchik: Department of Radiology, Wake Forest University School of Medicine, Winston-Salem, North Carolina 27157.
The skeleton is the hard, bony framework of the body. It is difficult to imagine its mobility, mechanical properties, and vital role in metabolism and hematopoiesis when we study it in its dried state in the anatomy laboratory. A radiograph of bone is a static image chiefly of the inorganic salts it contains and therefore is an inadequate reflection of the living quality of the skeleton.
In its living state, bone is a blend of hard inorganic salts and resilient organic components. Bone tissue consists of a ground substance or matrix impregnated with inorganic salts. Calcium and phosphorus are the principal mineral salts, with 99% of body calcium concentrated in bone. The inorganic salts represent an essential mineral reservoir for the metabolic pathways of the body. The uncalcified organic matrix is known as osteoid; its main component (90% to 95%) is collagen. In mature bone, approximately 20% of the weight of the matrix is water. Bone is living tissue, and old bone is constantly removed by osteoclasts and replaced by osteoblasts with new bone. Normally this exchange is in balance, and the mineral content remains relatively constant. This balance may be disturbed as a result of certain metabolic and endocrine disorders.
Metabolic bone disease encompasses a diverse group of disorders associated with altered calcium and phosphorus homeostasis. The terms osteomalacia and osteoporosis describe two common but distinct metabolic disorders. Osteomalacia is a failure of deposition of calcium salts in bone matrix, whereas osteoporosis is a deficiency of the organic matrix of bone. Unfortunately, the latter term is occasionally used nonspecifically to describe a general loss of bone substance.
Many of the metabolic bone disorders, including osteomalacia and osteoporosis, produce findings of decreased radiographic density. A host of terms are used to describe a loss of bone mineral and decrease in radiographic density. These include deossification, demineralization, osteolysis, osteoporosis, rarefaction, and radiolucency. Although the terms are often used interchangeably, osteopenia is the preferred descriptive term used to designate general or regional decrease in skeletal density on conventional radiographs. The loss of mineral salts that causes bones to become osteopenic may result from lack of mineralization, lack of bony matrix, or an increased rate of bone removal. Certainly, the term osteopenia is preferred to the term osteoporosis largely because it is difficult to distinguish between the various causes of decreased radiographic bone density and because there are specific pathogenic implications attached to the latter term.
The radiologic finding of increased radiopacity, or increased density, of bone is much less common. The increased radiopacity can result from either increased formation of new bone, with the removal of bone remaining normal, or interference with normal removal of bone, with a normal rate of bone formation.
MEASUREMENT OF BONE MINERAL DENSITY
Bone minerals must be considered in two separate compartments, the compact cortical bone and the trabecular, intramedullary bone. The surface area of trabecular bone is four times that of cortical bone, and the turnover rate of trabecular bone is eight times that of cortical bone. In most metabolic disorders, bone mineral loss occurs more rapidly in trabecular than in cortical bone.
The estimation of bone mineral density (BMD) on the basis of conventional radiographs is highly subjective and depends greatly on exposure parameters. This precludes an accurate evaluation. In particular, overexposed radiographs give the false impression of decreased bone density. In general,
30% to 50% of bone mineral must be removed before it is apparent on the radiograph.
30% to 50% of bone mineral must be removed before it is apparent on the radiograph.
Because of the difficulties in the subjective assessment of BMD, a number of methods have been devised to measure the mineral content of bone more accurately than by observation of radiographs. Collectively known as bone densitometry, these noninvasive techniques include radiogrammetry, radiographic absorptiometry, single-photon absorptiometry (SPA), dual-photon absorptiometry (DPA), dual-energy x-ray absorptiometry (DXA), and quantitative computed tomography (QCT).
Because many metabolic and endocrine disorders result in a reduction of bone mass, densitometric techniques that enable accurate, reproducible measurements of BMD are ideal for early diagnosis. The most important application of bone densitometry is in postmenopausal women, in whom it is used to diagnose osteoporosis, determine susceptibility to fracture, and monitor the effect of therapy.22, 23, 32, 33 Other clinical indications for bone densitometry include prolonged steroid therapy, radiologic osteopenia, primary hyperparathyroidism, and evaluation of patients before organ transplantation.5, 13
Radiogrammetry
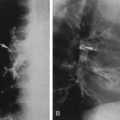
Radiogrammetry is the simplest method of quantitative BMD assessment. A conventional radiograph of the long bone is obtained, and the cortical thickness on either side of the medullary space is measured and expressed as a combined cortical thickness (CCT). The midshaft of the second metacarpal is most commonly measured (Fig. 6-1). In a normal person, the CCT of the second metacarpal is at least 50% of the width of the shaft. This ratio represents an excellent rule of thumb but is too imprecise to be used for clinical management.
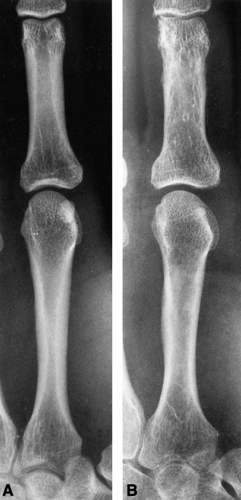 Fig. 6-1. Comparison of the second metacarpal and proximal phalanx in a 19-year-old man (A) and an 82-year-old woman (B). Note the thickness of the cortex and the absence of identifiable bone trabeculae in the midshafts of the bones in A, compared with the thinness of the cortices and the coarse trabecular pattern in B. The combined cortical thickness of the midshaft of the second metacarpal is 6 mm in A and 3 mm in B. |
Radiographic Absorptiometry
Another application of conventional radiography that has gained popularity for the diagnosis of osteoporosis is known as radiographic absorptiometry. In this procedure, a radiograph is obtained of the hand alongside an aluminum wedge and is sent to a central processing site, where bone mass is determined from the optical density of the radiograph.41 Preliminary data show that this method has good accuracy and precision and that low bone mass as determined by radiographic absorptiometry is associated with risk of osteoporotic fractures.41 If additional research supports these findings, radiographic absorptiometry may prove to be a low-cost alternative for the diagnosis of osteoporosis.
Single-energy Photon Absorptiometry
SPA requires an iodine-125 source, a sodium iodide scintillation detector, and intervening electronics to measure the beam attenuation through the radial shaft.11 During this examination, the forearm is surrounded by a water bath, the γ-ray source and detector are translated across the forearm, and changes in the beam intensity are measured.11 Because of dosimetric and statistical considerations, the low-energy 125I source cannot be used for body parts thicker than the forearm. This technique has been replaced with DXA in most clinical settings.
Dual-energy Photon Absorptiometry
The advantage of DPA over SPA is use of higher γ-ray energies, permitting larger body parts to be scanned without the necessity of a water bath.34 The usual source is gadolinium-153, which emits 42-keV and 100-keV photons. This method allows accurate and clinically useful estimation of
trabecular bone mineral content.11 However, the advent of more precise DXA has made SPA and DPA obsolete.
trabecular bone mineral content.11 However, the advent of more precise DXA has made SPA and DPA obsolete.
Dual-energy X-ray Absorptiometry
DXA differs from DPA in that an x-ray tube replaces the isotope as a source of photons. This greatly increases the speed and precision of DXA in comparison with DPA. X-rays that have two energy peaks are produced, allowing differential absorption of radiation by bone and soft tissue, from which the BMD is calculated.11 Because DXA has the best precision (coefficient of variation, 0.5% to 3%) and the lowest radiation dose (1 Sv) compared with other methods, it is currently considered the gold standard for clinical BMD measurement.17
Typically, a DXA examination consists of a two-site BMD measurement including the posteroanterior lumbar spine and the proximal femur (Fig. 6-2). This technique yields a measurement of the sum of all the minerals within the scan path. In the spine, not only the predominantly trabecular
bone of the vertebral bodies but also the vertebral end-plates and posterior elements, which contain a greater percentage of compact bone, are measured. Vertebral compression fractures, scoliosis, bone hypertrophy, and extraosseous calcification are also included in the measurement and may result in inaccuracies.11 Therefore, measurement of additional sites, such as the proximal femur, lateral lumbar spine, distal radius, or total body, may be required.10
bone of the vertebral bodies but also the vertebral end-plates and posterior elements, which contain a greater percentage of compact bone, are measured. Vertebral compression fractures, scoliosis, bone hypertrophy, and extraosseous calcification are also included in the measurement and may result in inaccuracies.11 Therefore, measurement of additional sites, such as the proximal femur, lateral lumbar spine, distal radius, or total body, may be required.10
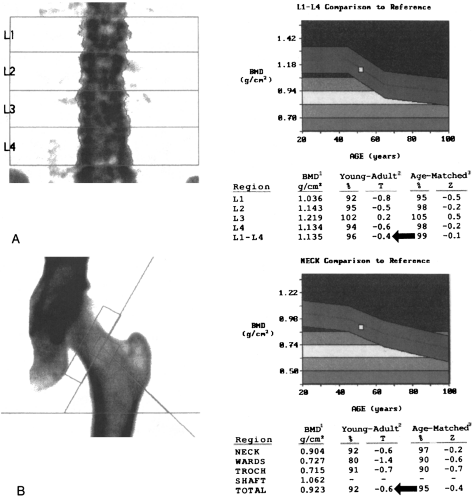 Fig. 6-2. Dual-energy x-ray absorptiometry. A: In this normal 52-year-old woman, the lumbar spine bone mineral density (BMD) is 96% of the young-adult mean, and the T-score is −0.4 (arrow). B: In the same woman, the proximal femur BMD is 92% of the young-adult mean, and the T-score is −0.6 (arrow). (continued) |
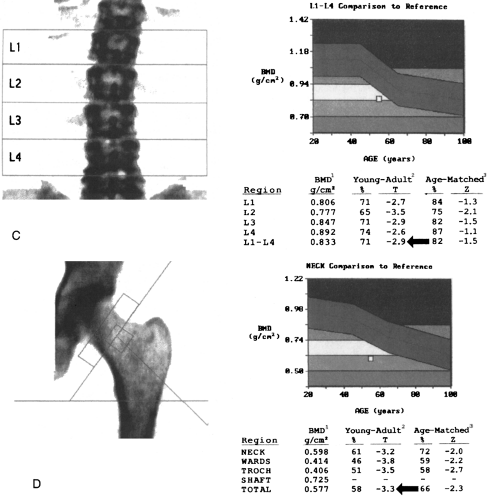 Fig. 6-2. Continued. C: In this osteoporotic 55-year-old woman, the lumbar spine BMD is 71% of the young-adult mean, and the T-score is −2.9 (arrow). D: In the same woman, the proximal femur BMD is 58% of the young-adult mean, and the T-score is −3.3 (arrow). |
Because DXA is a projectional technique that integrates cortical and trabecular bone in the path of the x-ray beam, the BMD measurements are expressed in grams per square centimeter. In contrast, QCT is a volumetric technique in which BMD is expressed in grams per cubic centimeter. On a printout from a DXA scanner, BMD measurements are expressed as percentages of the mean values for a young-adult reference population and for an age-matched reference population (see Fig. 6-2).10, 13 BMD measurements are also expressed as the number of standard deviations (SDs) from
the young-adult mean (T-score) or the age-matched mean (Z-score).10, 13 The T-score (also called the young-adult Z-score) is the most relevant value clinically because it is used for diagnosis of osteoporosis and estimation of fracture risk (see Fig. 6-2).10, 13, 21
the young-adult mean (T-score) or the age-matched mean (Z-score).10, 13 The T-score (also called the young-adult Z-score) is the most relevant value clinically because it is used for diagnosis of osteoporosis and estimation of fracture risk (see Fig. 6-2).10, 13, 21
Quantitative Computed Tomography
Quantitative bone measurements can be made on an imaging CT scanner using a software package and a calibration phantom. The calibration phantom is scanned either separately or simultaneously with the patient.28, 33, 34
Typically, QCT examinations are performed on the lumbar spine. Single axial scans are obtained through the midplane of two to four lumbar vertebral bodies (Fig. 6-3). Quantitative readings are obtained from a region of interest over the trabecular bone encompassing 3 to 4 cc of each vertebral body and from different reference solutions in the phantom. The readings are averaged and used to calculate the BMD (Fig. 6-4).
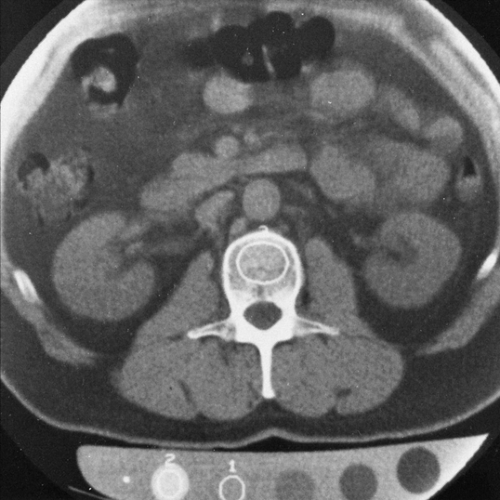 Fig. 6-3. Quantitative computed tomography. A computer compares the density in a region of interest in trabecular bone with a K2HPO4-calibrated phantom. The phantom contains several tubes of varying concentration. The density of trabecular bone is calculated by comparing it with the densities of the phantom. |
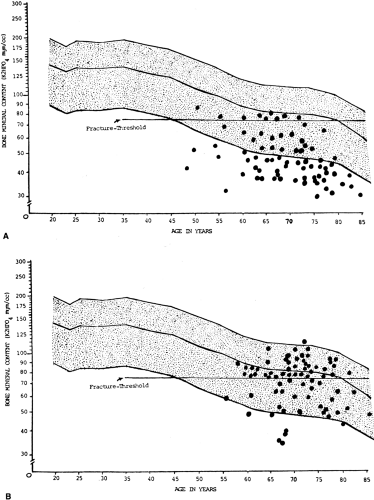 Fig. 6-4. Quantitative computed tomography determination of bone mineral density (BMD) of the spine in osteoporotic women with vertebral fractures (A) and hip fractures (B). Center line within speckled areas depicts the mean spinal trabecular bone in 419 normal women at 90% confidence limits. A: This diagram plots the bone mineral content (dots) in 74 osteoporotic women with vertebral fractures. The fracture threshold selected was the fifth percentile of spinal BMD values from healthy premenopausal women 45 years old. Eighty-five percent of women with osteoporotic vertebral fractures had spinal BMD measurements below that value. In addition, 64% had BMD values below the 5th percentile for age-matched control subjects. B: BMD of the spine in 83 osteoporotic women with hip fractures. Only 38% of patients with hip fractures had spinal BMD values below the 5th percentile for healthy premenopausal women, and only 9% had BMD values below the 5th percentile for age-matched control subjects. (From Firooznia H, Rafii M, Golimbu C, et al: Trabecular mineral content of the spine in women with hip fracture: Ct measurement. Radiology 159:737, 1986 .) |
Of all available methods of bone-mass measurement, QCT has the unique advantage of selectively measuring trabecular bone. Because trabecular bone is more metabolically active than cortical bone, QCT is considered the most sensitive method for detecting changes in BMD.8 Detection of small changes in BMD is especially important in postmenopausal women with early bone loss. A further advantage of QCT over DXA is that QCT measurements are not influenced by the patient’s size or by the presence of degenerative disease.8, 11
Despite these advantages, QCT is less widely used than DXA because of its inability to measure sites other than the spine and because of its higher radiation dose and lower precision when compared to DXA.
OSTEOPOROSIS
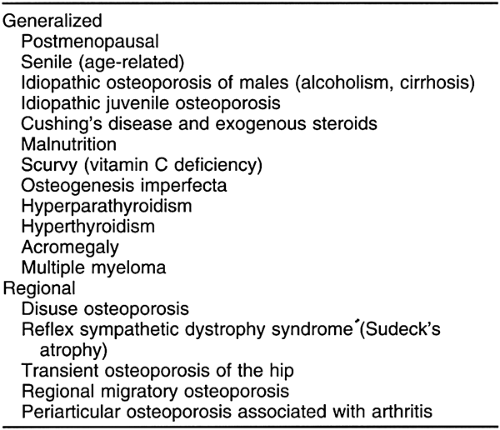
Skeletal disorders associated with osteoporosis may be conveniently subdivided into those associated with generalized osteoporosis of the entire skeleton and those associated with a regional osteoporosis, usually limited to a single extremity or portion of an extremity (Table 6-1).
 |
Generalized Osteoporosis
Osteoporosis is not only the most common metabolic bone disease but one of the most prevalent conditions associated with aging.14 In the United Sates, as in many other parts of the world, it is a major public health problem.14 Recent therapeutic advances, including bisphosphonates and selective estrogen receptor modulators, are promising to reduce the prevalence of osteoporosis.10, 17
Generalized osteoporosis is often classified as either primary or secondary. The primary (idiopathic) form is considerably more common. It is further subdivided into type 1 (postmenopausal) and type 2 (age-related or senile).17 Postmenopausal osteoporosis is encountered in women experiencing menopause, and although the cause is multifaceted, the role of estrogen deficiency is beyond question.22 Senile osteoporosis is encountered in elderly women and men and probably is caused by a dysfunction of osteoblasts. Secondary osteoporosis has many causes, including those related to endocrine function (hyperparathyroidism, hyperthyroidism, acromegaly, hypercorticism, hypogonadism, diabetes mellitus), congenital factors (osteogenesis imperfecta, homocystinuria, mastocytosis, ochronosis), nutrition (mal- nutrition, alcoholism, scurvy), and drug use (corticosteroids, heparin).10, 17
The histologic changes seen in osteoporosis are predominantly quantitative; qualitative changes are considered much less important. Resorption of bone occurs in three locations (Fig. 6-5): the endosteal surface, resulting in thinning of the cortex; the haversian canals, giving rise to porosity of the cortex; and the trabeculae within intramedullary bone, significantly reducing internal structural support.
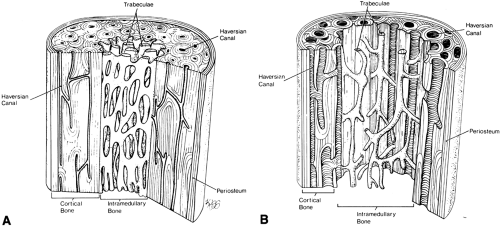 Fig. 6-5. Cross-section of normal bone (A) compared with osteoporotic bone (B). Note the thinning of the cortex caused by endosteal resorption, the widening of the haversian systems, and the reduction in the size and number of intramedullary trabeculae in osteoporotic bone. |
The principal effect of loss of bone in osteoporosis is an increase in the fragility of bone; as bone mass decreases, bones are more susceptible to fracture.23, 29, 30, 32 Most fractures result from falls from a standing position by tripping or stumbling. The proximal end of the femur, the distal end of the radius, the proximal end of the humerus, the thoracolumbar spine, and the pelvis are common sites of fracture in the elderly (see Chapter 2). Each year in the United States there are 1.5 million osteoporotic fractures, including approximately
500,000 vertebral fractures, 250,000 femoral neck fractures, and 240,000 distal radius fractures.17 The cumulative prevalence of all these fractures in women is about 7% by the age of 60 years and increases to about 25% by the age of 80 years. After hip fracture, approximately 20% of patients die within 1 year and 25% to 40% have significant morbidity. In the United States, the annual direct cost of osteoporosis exceeds $10 billion.17
500,000 vertebral fractures, 250,000 femoral neck fractures, and 240,000 distal radius fractures.17 The cumulative prevalence of all these fractures in women is about 7% by the age of 60 years and increases to about 25% by the age of 80 years. After hip fracture, approximately 20% of patients die within 1 year and 25% to 40% have significant morbidity. In the United States, the annual direct cost of osteoporosis exceeds $10 billion.17
Among the reported risk factors for osteoporosis and osteoporotic fractures are advancing age, female gender, Caucasian or Asian ethnicity, family history, estrogen deficiency, calcium deficiency, vitamin D deficiency, low body weight, sedentary lifestyle, alcoholism, and smoking.10, 17 Because most of these risk factors are strongly associated with low BMD, low BMD is considered the major risk factor for osteoporosis and the strongest predictor of fracture risk.3, 19, 21, 32
In normal persons, BMD reaches a peak between the ages of 30 and 35 years and then decreases progressively. In women, the loss of BMD increases dramatically at menopause. In men, the majority of loss occurs after 65 years. The cumulative loss of mineral from the vertebrae between young adulthood and extreme old age approaches 50% for women and approximately 15% for men. In general, each standard deviation drop in BMD below the young-adult mean increases the risk of fracture by 2 to 3 times.3, 14, 19
The association between low BMD and risk of fracture is analogous to the relation between high serum cholesterol and risk of myocardial infarction or to that between high blood pressure and risk of stroke. Just as blood pressure and serum cholesterol measurements have become commonplace, the determination of BMD is rapidly becoming a standard of care in modern medical practice.
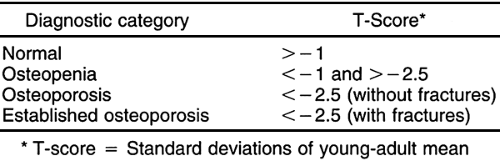
In 1994 the World Health Organization developed a definition of osteoporosis based on bone densitometry. Osteoporosis was defined as a BMD measurement 2.5 SDs or more below the young-adult mean (Table 6-2).14 Osteopenia (low bone mass) was defined as a BMD more than 1 or less than 2.5 SDs below the young-adult mean.14 This definition of osteoporosis is useful to clinicians because it allows diagnosis before the occurrence of fracture and allows quantitative assessment of the severity of disease.10 Because pre-existing fracture substantially increases the future risk of fracture, the clinical goal is to make the diagnosis of osteoporosis before the first fracture occurs.10 At present, the only way to accomplish this goal is with bone densitometry.
 |
Although conventional radiographs should not be used to diagnose osteoporosis because of the availability of more accurate methods such as DXA, one must be familiar with the radiologic manifestations of osteoporosis. Conventional radiographs in patients with early osteoporosis are commonly normal. In patients with advanced disease, radiographs may show osteopenia or fractures. The cortex of the affected bone is thin, and the trabecular pattern coarsened (see Fig. 6-1). Coarsening of the trabecular pattern is caused by a selective resorption of smaller trabeculae; when the smaller trabeculae are removed, the larger trabeculae become more evident and more sharply defined. In patients with osteopenia, it is important not only to evaluate the overall density of bone but to determine specific characteristics of both the cortex and trabecular bone. Conventional radiographs may help differentiate osteoporosis from osteomalacia, hyperparathyroidism, and multiple myeloma—by showing Looser’s zones in patients with osteomalacia, subperiosteal resorption in patients with hyperparathyroidism, and multiple lytic lesions in patients with multiple myeloma.
The consequences of osteoporosis are particularly well demonstrated in the spine by the presence of anterior wedging, “codfish” deformities, or overt fractures of the vertebral bodies (Fig. 6-6). The number of spinal fractures correlates well with BMD; the more fractures, the greater the degree of bone mineral loss. The midthoracic, lower-thoracic, and upper-lumbar vertebral bodies are more severely affected. The most characteristic abnormality is a codfish deformity of the vertebral body, so named because the end-plates become deeply concave, similar to the vertebral bodies of fish. This condition is caused by an expansion of the intervertebral disc or invagination of the disc into a vertebral body weakened by the loss of trabeculae. Multiple wedging of the vertebral bodies leads to a kyphosis of the mid-dorsal spine. This deformity is obvious clinically and is known as a dowager’s hump. Elderly women may lose as much as 6 inches in height because of loss of vertebral height. Differentiation of osteoporotic fractures from acute fractures is described in Chapter 2. Magnetic resonance imaging (MRI) may be useful for differentiating osteoporotic fractures from pathologic fractures by showing contrast enhancement of bone marrow in pathologic fractures (Fig. 6-7).
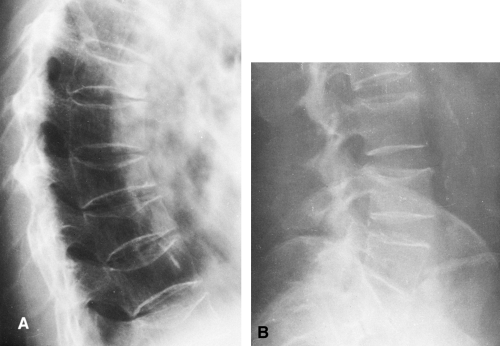 Fig. 6-6. Postmenopausal osteoporosis. A: There are multiple deformities of the thoracic vertebral bodies. The cortical margins are thin, the vertebral bodies are wedged anteriorly, and the end-plates are concave. The biconcave vertebral bodies are known as “codfish” vertebrae. B: In the lumbar spine, there is no wedging of the vertebral bodies, but note the concave deformity of the superior end-plates. |
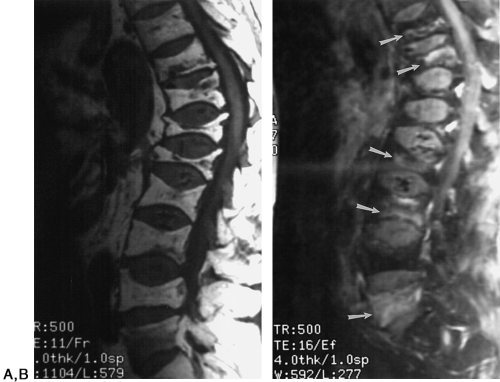 Fig. 6-7. An 87-year-old man with multiple spinal compression fractures. A: Sagittal T1-weighted magnetic resonance image (MRI) shows multiple spinal compression fractures. B: Sagittal T1-weighted MRI taken after administration of gadolinium shows enhancement of T10, T11, L1, L2, L3, and L5 vertebrae, suggesting that the fractures are pathologic fractures. Biopsy showed lymphoma. |
Idiopathic Osteoporosis of Males
Persons with alcoholism and cirrhosis have a reduced bone mass and an increased incidence of fractures of the vertebral bodies, hip, distal forearm, and proximal humerus, compared with controls. Although this condition was described initially in men, both men and women may be affected. The early onset of osteoporosis in men usually is associated with alcoholism and cirrhosis. The cause of bone loss is unknown, but undoubtedly there is a relation between bone mass, nutrition, and other variables such as physical activity and gastric surgery for peptic ulcer disease in alcoholic persons. The disease is usually manifested radiographically by deformities of the thoracic and lumbar vertebral bodies typical of osteoporosis (see Fig. 6-6) and by a generalized osteopenia in the peripheral skeleton revealed by thinning of the cortex and coarsening of the trabecular pattern. Loss of bone can be verified and quantified with bone densitometry.
Idiopathic Juvenile Osteoporosis
Idiopathic juvenile osteoporosis is an uncommon, self-limited disease of childhood.36 Afflicted children present about 2 years before puberty with spinal and extraspinal symptoms that may simulate those of arthritis; pain in the ankles, slowness in walking, and abnormal gait are characteristic. Radiographs show multiple compressed or biconcave vertebrae and often metaphyseal fractures of long bones. The serum calcium, phosphorus, and alkaline phosphatase levels are normal.
The differential diagnosis includes Cushing’s syndrome, celiac disease, homocystinuria, osteogenesis imperfecta, leukemia, and metastatic disease. The main diagnostic problem is ruling out mild osteogenesis imperfecta and metastatic disease or leukemia. In idiopathic osteoporosis, the width of the long bones is normal, although the cortex is thin and metaphyseal fractures are common. In osteogenesis imperfecta, the width of the bones may be abnormally thin and most fractures occur in the diaphysis; metaphyseal fractures are rare. Patients with osteogenesis imperfecta also have blue sclerae and progressive cranial, facial, and pelvic deformities. In contrast to the qualitative abnormality of bone seen on histologic examination in osteogenesis imperfecta, biopsies in idiopathic juvenile osteoporosis reveal no qualitative changes in bone.
Cushing’s Syndrome and Endogenous Steroids
Osteopenia is the principal skeletal manifestation of hypersteroidism, whether from endogenous or exogenous sources. Excessive endogenous production of steroids resulting in Cushing’s syndrome is usually caused by bilateral adrenocortical hyperplasia or, less frequently, by an adrenocortical adenoma or carcinoma.
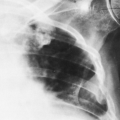
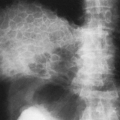
Excessive steroids result in a demineralization of bone, particularly in the vertebrae, which are prone to collapse with multiple compression fractures manifested by anterior wedging and biconcave deformities of the vertebral bodies (Fig. 6-8). Marginal condensation of the end-plates of compressed vertebrae is seen more commonly than in vertebral compressions resulting from other causes (Fig. 6-9). It has been suggested that this finding is a manifestation of attempted
repair with excess callus formation. Rib fractures are also common. Fractures of the pubic and ischial rami may also occur. The rib and pubic fractures often have exuberant callus formation.
repair with excess callus formation. Rib fractures are also common. Fractures of the pubic and ischial rami may also occur. The rib and pubic fractures often have exuberant callus formation.
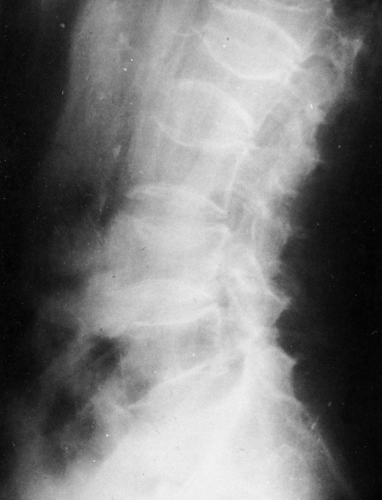 Fig. 6-8. Cushing’s syndrome. There is a “codfish” deformity of all the lumbar vertebral bodies. Expansion of the intervertebral discs into the softened vertebral bodies causes this characteristic biconcavity of the upper and lower end-plates. |
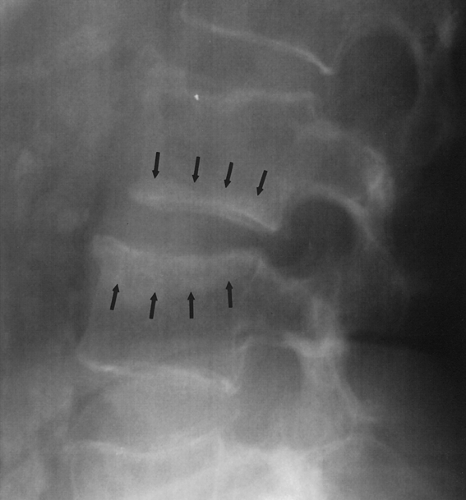 Fig. 6-9. Cushing’s syndrome. There are multiple compression fractures of lumbar vertebral bodies. Note marginal condensation of the vertebral end-plates (arrows). |
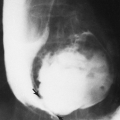
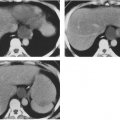
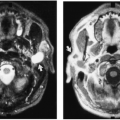
Ischemic necrosis of the head of the femur (Fig. 6-10) and the head of the humerus is another frequent complication of hypersteroidism.27 The exact cause is not known. The characteristic radiographic findings are an increase in radiodensity or sclerosis, sometimes called “snowcapping;” collapse of bone with loss of volume; and linear subcortical radiolucencies, the so-called crescent sign (see Chapter 7). On MRI, serpiginous regions of linear, low signal intensity, often paralleled by linear high signal, are virtually diagnostic of osteonecrosis (Fig. 6-11). In addition to involving the epiphyses, osteonecrosis commonly involves the shafts of long bones and may be seen in virtually any bone of the skeleton. Although in its late stages osteonecrosis is apparent on conventional radiographs, early diagnosis requires the use of MRI (Fig. 6-12).
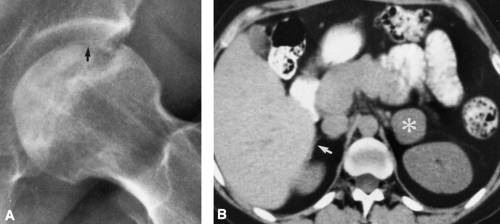 Fig. 6-10. Cushing’s syndrome in a patient presenting with the chief complaint of hip pain. A: Characteristic changes of avascular necrosis of the femoral head manifested by increased densities and lucencies and slight collapse of the femoral head. Note the subchondral fracture (arrow). B: Computed tomographic scan of the abdomen demonstrates presence of a left adrenal adenoma (asterisk). Note the normal thin, linear right adrenal gland (arrow). |
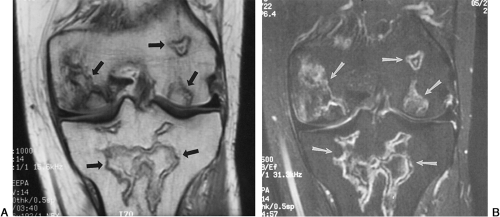 Fig. 6-11. Cushing’s syndrome in a 30-year-old man with knee pain. A: Coronal T1-weighted magnetic resonance image (MRI) of the knee shows multiple serpiginous areas of low signal (arrows) in the proximal tibia and distal femur. B: Coronal T2-weighted, fat-suppressed MRI of the same knee shows serpiginous areas of low and high signal (arrows) in the same regions, consistent with the diagnosis of osteonecrosis. |
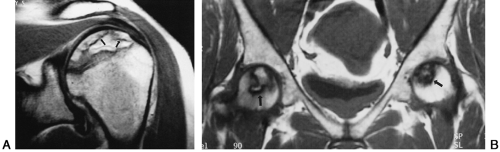 Fig. 6-12. Two cases of Cushing’s syndrome and osteonecrosis. A: Coronal T1-weighted magnetic resonance image (MRI) of the shoulder in a 38-year-old woman with shoulder pain shows serpiginous low signal (arrow) in the humeral head, consistent with osteonecrosis. B: Coronal T1-weighted MRI of the pelvis in a 39-year-old woman with left hip pain shows serpiginous areas of low signal (arrow) in both femoral heads, consistent with osteonecrosis. Conventional radiographs were normal in both cases. |
Nonskeletal findings of hypersteroidism on imaging studies include excess subcutaneous and intra-abdominal fat deposition and mediastinal widening. Extrapleural fat pads and epicardial fat accumulations may also be seen.
Malnutrition and Related Causes
Severe malnutrition and protein deficiency or abnormal protein metabolism cause osteoporosis. Osteoporosis and osteomalacia may both occur after periods of starvation. Osteoporosis may develop in nephrosis or celiac disease as a result of loss of protein; in poorly controlled diabetes; and in hyperthyroidism, probably owing to catabolic destruction of amino acids.
Scurvy
Vitamin C is necessary for normal osteoblastic activity. The organic matrix of bone cannot be laid down without it. Infantile scurvy is caused by a deficiency of vitamin C. Scurvy is not a disease of the immediate postnatal period but is encountered in children between the ages of 6 months and 2 years. There are no authentic cases of symptomatic or radiographic scurvy in infants younger than 3 months. It is a rare disease in present-day America. Heating of cow’s milk for the purpose of pasteurization destroys vitamin C in sufficient amount to lead to clinical scurvy. In such circumstances, the addition of orange juice or ascorbic acid to the diet easily and effectively prevents scurvy.
The clinical manifestations are irritability, digestive disturbance, loss of appetite, and tenderness and swelling, particularly of the lower extremities. Swelling of the gums is also characteristic. In far-advanced cases, hemorrhages occur in the skin, mucous membranes, and soft tissues because of the lack of intercellular substance in the capillaries.
Because of the lowered activity of the osteoblasts, the serum alkaline phosphatase level is usually low or occasionally normal. The serum calcium and phosphorus are normal.
Radiographic Findings
The diagnosis of scurvy usually is based on the radiographic findings in the long bones, especially at their distal ends. As a rule, the findings are most marked about the knee (Fig. 6-13).
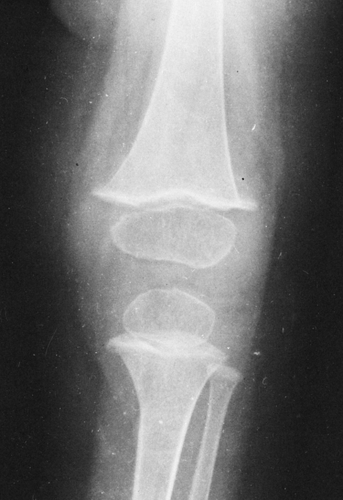 Fig. 6-13. Infantile scurvy. The white line of scurvy is particularly distinct in the metaphysis of the femur. Note the spur-like projection at the zone of provisional calcification laterally. The translucent scurvy zone is not visible because of impaction of the shaft into the zone of provisional calcification. Note the distinct ring-like contour of the epiphyses. |
A diffuse demineralization of the entire skeleton gives rise to a ground-glass appearance. The normal trabecular architecture is disrupted, and the cortices are thinned.
Characteristically there are two zones of increased density. The first forms at the margins of the epiphyseal centers. As the cancellous bone of the center becomes more translucent than normal, the dense outer rim has the appearance of a ring, known as the Wimberger’s ring sign. The second develops in the zone of provisional calcification at the metaphysis of long bones. This zone of radiodensity, known as the white line of scurvy, represents an abnormally wide zone of provisional calcification and is caused by a failure of normal proliferation of cartilage cells so that the change from cartilage to bone becomes arrested.
There are also two distinct areas of radiolucency. A small radiolucent area involves the cortex and trabeculae just proximal to the metaphysis. This is known as the corner sign of scurvy. It is an early and characteristic finding and represents the early development of the scurvy zone. The scurvy zone is a transverse band of radiolucency that crosses the shaft just beneath the white line of scurvy. This is an area in which active bone formation would normally be taking place but cannot occur in the presence of vitamin C deficiency. It is a weakened portion of the bone, and fractures may occur with or without displacement of the shaft, giving the appearance of an epiphyseal separation (Fig. 6-14). The scurvy zone often disappears as the epiphysis, together with the zone of provisional calcification, becomes impacted into the shaft.
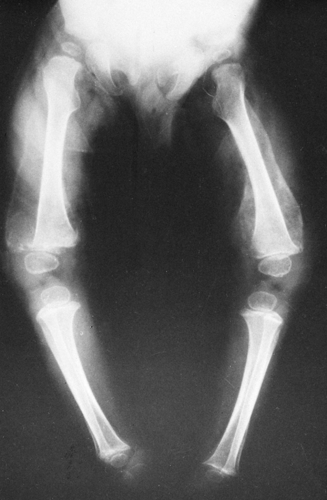 Fig. 6-14. Infantile scurvy. This examination was obtained shortly after the beginning of the patient’s treatment. There has been an epiphyseal fracture, with lateral displacement of the right lower femoral epiphysis. Large calcifying subperiosteal hematomas are present bilaterally about the femurs. Note the distinct ring-like contour of the epiphyses. |
During the active phase of the disease, extensive hemorrhages may develop beneath the periosteum. During infancy and childhood, the periosteum is loosely attached to the cortex of the bone and is easily elevated by hemorrhage beneath it. However, it is firmly attached at the end of the shaft; hemorrhage is limited at this point and therefore does not extend over the epiphysis. It is the subperiosteal hemorrhage that accounts for the swelling of the extremities.
Healing is first shown by new-bone formation beneath the elevated periosteum (see Fig. 6-14). As a result of adequate
treatment, bone is deposited throughout the area of hemorrhage surrounding the shaft, the scurvy zones recalcify, there is gradual remineralization of the skeleton, and cortices regain their normal thickness. As growth proceeds, the thickened zone of provisional calcification appears to migrate into the shaft, where it remains for a variable time as a thin, dense, white line (a growth-arrest line). In like manner, a ring of density may be visible within the epiphyseal center, as normal bone forms around the edge of the old center (ghost epiphysis, or bone within a bone). The calcified subperiosteal hemorrhages are gradually absorbed.
treatment, bone is deposited throughout the area of hemorrhage surrounding the shaft, the scurvy zones recalcify, there is gradual remineralization of the skeleton, and cortices regain their normal thickness. As growth proceeds, the thickened zone of provisional calcification appears to migrate into the shaft, where it remains for a variable time as a thin, dense, white line (a growth-arrest line). In like manner, a ring of density may be visible within the epiphyseal center, as normal bone forms around the edge of the old center (ghost epiphysis, or bone within a bone). The calcified subperiosteal hemorrhages are gradually absorbed.
Osteogenesis Imperfecta
Related posts:
Stay updated, free articles. Join our Telegram channel

Full access? Get Clinical Tree


