CHAPTER 13 Methods for Cardiac Magnetic Resonance Imaging
CLINICAL APPLICATIONS
TEMPORAL RESOLUTION AND SPATIAL RESOLUTION
Because the heart is in constant motion, the duration of image acquisition (temporal resolution) must be sufficiently brief (<100 ms) to avoid motion blurring artifacts. Single-shot MRI techniques that acquire all necessary k-space data after a single radiofrequency (RF) excitation, such as echo planar imaging (EPI),1–3 single-shot fast spin-echo (FSE),4 or spiral imaging methods,5,6 yield images with insufficient spatial resolution, insufficient signal-to-noise ratio (SNR), or too long an image acquisition window to image the beating heart properly. The necessary MRI (i.e., k-space) data required to reconstruct the image must be acquired in segmented fashion across multiple cardiac cycles.7 These segmented k-space acquisition techniques incorporate the repeated acquisition of MRI k-space data over a small temporal window in the cardiac R–R interval, after ECG triggering. The acquisition is repeated over multiple cardiac cycles until sufficient k-space data are collected to reconstruct an image.
APPLICATION-SPECIFIC CARDIAC MRI METHODS
Ventricular Function: Cine Imaging
For the assessment of ventricular function (e.g., assessment of left ventricular wall motion), images of the heart at multiple time points or phases in the cardiac cycle are acquired. An optimal MRI pulse sequence provides good contrast between the ventricular blood pool and the myocardium, and high spatial and high temporal resolution. Gradient-recalled-echo (GRE) techniques are typically used. A variant of steady-state GRE acquisition, balanced steady-state free precession (SSFP), has gained acceptance as the primary method for cardiac cine imaging at 1.5 T. Gradient-echo imaging is still used at 3.0 T, however, because of the sensitivity of balanced SSFP to off-resonance effects that can cause significant black banding and ghosting image artifacts. The balanced SSFP pulse sequence (depending on MRI scanner manufacturers known as trueFISP, FIESTA, or balanced-FFE) yields the highest image SNR by refocusing all available magnetization at the end of each sequence repetition period (TR).8,9
Images acquired at different cardiac time points are played back in a movie loop to enable the assessment of the contractile function of the left ventricle—hence the name cine (referring to the motion picture technique). There are several techniques for generating a cine series. Because the imaging pulse sequence is unable to complete image acquisition within the 25- to 100-ms time frame of a phase in the cardiac cycle, the acquisition is segmented over several cardiac cycles. As shown in Figure 13-1A, the number of views, or k-space lines, acquired in a cardiac cycle, or R–R interval, is known as the views-per-segment (vps). Segments are acquired repeatedly throughout the cardiac cycle, with each segment at a different temporal phase, starting from the R wave trigger. This segment acquisition continues until the next cardiac R wave trigger is encountered, at which time the next set of k-space encoding views are updated, and the process is repeated until all k-space encoding views have been acquired. An acquisition that is prescribed for a phase encoding matrix dimension of 128 requires a total of 128 views and 16 heartbeats to complete, using 8 vps (128 views ÷ 8 vps = 16 segments; 1 segment per heartbeat for a total of 16 heart beats).
where TR is repetition time. The number of acquired cardiac phases that can fit into an R–R interval is limited by the temporal resolution of the acquisition and the patient’s heart rate. The number of acquired phases is:
where avail_RRtime is the cardiac R–R interval time and is given (in ms) as:
where the heart rate is given in beats per min and trig_window is the fraction of the cardiac R–R interval where data acquisition is disabled to wait for the next cardiac R wave trigger. The number of heart beats that are required to reconstruct an image is given by:
where yres is the image resolution in the phase-encoding direction and represents the number of k-space lines in the image.
For a heart rate of 80 beats/min, TR = 5 ms, and vps = 12, with a 10% trigger window (trig_window = 0.10), 11 phases or segments can be acquired per cardiac interval. For fast heart rates and low temporal resolution, the number of acquired phases is small, and does not allow a smooth depiction of cardiac motion. The effective temporal resolution can be substantially increased, however, using view sharing.10
View sharing effectively doubles the number of reconstructed cardiac phases by sharing k-space lines between adjacent acquired data segments to generate an intermediate-phase image. As shown in Figure 13-1B, where a view-sharing factor of 2 is used for a 4-vps acquisition, k-space encoding lines k1, … , k4 are acquired in each segment. To generate an intermediate phase image, k-space encoding lines k3 and k4 from segment n are combined with k-space encoding lines k1 and k2 lines from segment n + 1 to form an intermediate time point or phase image between acquired phases n and n + 1.
This nearest neighbor interpolation reconstructs an image at a time point midway between two adjacent acquired phases. Although the acquired temporal resolution is still given by Equation 1, the effective temporal resolution is now doubled to:
where vvs is the view sharing factor, and typically, vvs = 2.
The number of acquired segments for each cardiac R–R interval can change owing to possible variations in the patient’s heart rate. These variations in the number of segments and the R–R interval are tracked over time, however, by the MRI scanner’s computer or real-time data processor. After data acquisition is complete for each cardiac cycle, the acquired views for each cardiac R–R interval are sorted retrospectively and binned or interpolated into the appropriate cardiac phase.11 As shown in Figure 13-2, with retrospective gating or sorting, we can choose to reconstruct an arbitrary number of phases for any given number of actual acquired segments. With retrospective interpolation, each cardiac R–R interval is divided into equal time points. The acquired views for each cycle are interpolated to each reconstructed time point using a linear interpolation scheme.
Black Blood Imaging
Blood suppression is achieved by using a double inversion recovery (IR) technique.12 As shown in Figure 13-3, a nonselective IR RF pulse inverts all spins in the RF coil volume. This inversion is followed immediately by a slice-selective IR RF pulse to restore the longitudinal magnetization only within the imaged slice. The aim of the reinversion RF pulse is to ensure that the spins within the imaged slice are unperturbed. At an appropriate inversion time (TI), selected so that TI = TInull,blood, the point in time where the inverted longitudinal magnetization of blood is zero (TInull,blood = T1,blood loge 2), the FSE image acquisition is applied. In this TI interval, blood within the imaged slice is replaced with blood from outside the slice (with inverted longitudinal magnetization). At the moment of data acquisition (just after application of the 90-degree RF excitation pulse), the longitudinal magnetization of blood passes through zero resulting in a suppression of blood signal in the imaged slice. Image acquisition usually spans two R–R intervals to allow for a more complete recovery of the longitudinal magnetization (in the second R–R interval), for increased image SNR.
Typical image acquisition parameters for a black blood FSE acquisition are a 256 × 192 acquisition matrix with an ETL = 20 and two R–R intervals per acquisition segment; this translates to an approximate breath-hold time per slice of about 20 seconds (assuming 60 beats/min heart rate). Complete coverage of the heart using black blood FSE requires about 8 to 12 slice locations with separate breath-holds at each location. To further improve the efficiency of the black blood FSE acquisition, the inversion and image acquisition can be compacted into a single R–R interval (e.g., FSEuno). By removing the time for recovery of the longitudinal magnetization in the second R–R interval, increased T1-weighting is also achieved. Additionally, the acquisition of four slices in the same time as a single slice in a conventional two R–R interval gated FSE pulse sequence (e.g., FSEquatro) can be realized by grouping adjacent slice locations together.13 As shown in Figure 13-4, two slice locations are acquired in each R–R interval (for four slices in total for a two R–R interval acquisition). Because the slices are adjacent to each other, the slice-selective reinversion RF pulse now spans two slice locations providing blood suppression for both slices. The number of breath-holds for whole heart coverage is reduced by a factor of 4 (Fig. 13-5), significantly speeding up the cardiac examination and reducing patient fatigue from frequent and repeated breath-holds.
Myocardial Perfusion
To achieve robust image contrast, a 90-degree saturation recovery magnetization preparation segment, followed by a fixed time TI, is used for myocardial perfusion studies. A 90-degree rather than a 180-degree preparation RF pulse is used because the longitudinal magnetization recovers from the same level (Mz = 0) during the TI interval for each ECG-gated acquisition during the contrast uptake. With saturation recovery magnetization preparation, the tissue signal intensity is independent of the cardiac R–R interval, eliminating signal variations caused by arrhythmia (Fig. 13-6). The relatively short TI time (100 to 200 ms) of the saturation recovery preparation pulse suppresses signals from long T1-weighted tissues, such as the unenhanced myocardium and blood, while emphasizing tissues with markedly reduced T1 times from contrast medium uptake. With the correct selection of acquisition parameters and contrast medium dose, saturation recovery magnetization preparation can yield signal intensity changes that are linear with contrast medium concentration, providing an opportunity for quantitative assessment of myocardial perfusion.
To achieve full coverage of the left ventricle during the first pass of the contrast medium, it must be possible to fit an optimal number of acquisition segments (with each segment consisting of the magnetization preparation pulse, TI interval, and data acquisition section) into either one or two R–R intervals. The TI interval section and the data acquisition segment can be optimized to provide the shortest possible time with best possible image quality. Although single-shot EPI (all k-space lines acquired after a single RF excitation pulse) has poor image quality for cardiac perfusion studies, a segmented and interleaved approach accomplishes short scan time and good image quality.14–16 In interleaved EPI, only a few echoes per RF excitation pulse (ETL = 4) are used, resulting in short (6 ms) TR times; this yields an acquisition approach with high efficiency (time per echo). With improvements in gradient hardware, however, fast gradient echoes (and balanced SSFP) with an ETL = 1 and TR = 2 ms or less have also yielded images with comparable image quality and with equal compactness in time.17–19
Effective assessment of myocardial perfusion defects requires maximal tissue contrast, which is obtained from an optimal TI time at typical contrast medium doses of 0.05 to 0.10 mmol/kg.20 To maximize the number of slice locations that can be acquired per R–R interval, however, the time for each acquisition segment needs to be as compact as possible. By minimizing the TI time, more slice locations can be acquired per R–R interval; however, this leads to compromises in image contrast because there is an inherent tradeoff between TI and image contrast-to-noise ratio (CNR). Several approaches allow for significantly reduced TI times, while maintaining sufficient tissue contrast. By interleaving the saturation recovery RF pulse and image acquisition using a slice-selective notched saturation, longer TI times can be achieved with minimal dead times.21 Alternatively, the center of k-space in the image acquisition section can be reordered to the end of the acquisition segment, yielding a longer “effective” TI time. Both approaches produce satisfactory image contrast with as compact an acquisition segment as possible.
Sections of the myocardium where there is a regional perfusion deficit are hypointense relative to the normal myocardium because of reduced uptake of contrast medium. By a qualitative assessment of signal intensity changes, myocardial perfusion deficits can be easily identified (Fig. 13-7). A troubling artifact with myocardial perfusion using MRI is the so-called “dark rim” artifact, which is characterized by a transient and distinct hypointense thin region in the endocardium that mimics a perfusion defect (Fig. 13-8).22 This phenomenon usually occurs immediately after the contrast medium bolus first arrives in the left ventricle, but does not persist over time. Improvements in spatial resolution and substantial reduction in image acquisition times reduce the occurrence of these artifacts, as does requiring positive identification of a defect that spans several slices and persists through multiple frames of the scan.
Myocardial Viability
Myocardial delayed enhancement (MDE) imaging provides an accurate method for determination of myocardial viability.23,24 On first-pass perfusion imaging, infarcted myocardial tissue does not enhance after gadolinium-chelate contrast agent administration because of its restricted blood flow. Over time, the gadolinium-chelate contrast agent diffuses into the infarcted region. The poor vascular supply to the infarcted region is associated with diminished washout of contrast agent. Infarcted tissue exhibits delayed gadolinium uptake and delayed washout. Normally perfused myocardium has much faster early uptake and brisk washout. Delayed imaging of the left ventricle (beginning 5 to 10 minutes after contrast agent administration) enables optimal differentiation of infarcted from noninfarcted (i.e., normal) myocardium. On delayed imaging, infarcted myocardium appears more enhanced (i.e., “hyperenhanced”) relative to that of normal enhancing myocardium (T1 shortening).
The best technique for visualizing delayed hyperenhancement is an IR GRE pulse sequence that suppresses signal of the normally enhancing myocardial tissue, while maximizing the signal difference with that of the hyperenhancing infarcted tissue.25 To maximize the image contrast between normal myocardium and hyperenhancing infarcted tissue, the TI time is selected to null normal myocardial signal during the acquisition of the central k-space view. Because hyperenhancing infarcted tissue has a higher concentration of gadolinium contrast agent, it has a substantially shorter T1 time (approximately 75 ms) relative to normal myocardium (approximately 290 ms). Nulling the signal from normal myocardium yields a high contrast image differentiating the bright infarcted regions from the dark background. The primary image acquisition technique is an ECG-gated, segmented k-space, two-dimensional acquisition where each slice is acquired in a single breath-hold (Fig. 13-9), requiring multiple breath-holds for complete coverage of the left ventricle.
Stay updated, free articles. Join our Telegram channel

Full access? Get Clinical Tree


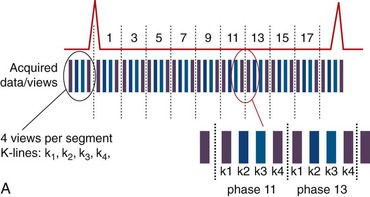
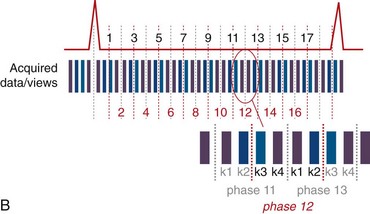
 FIGURE 13-1


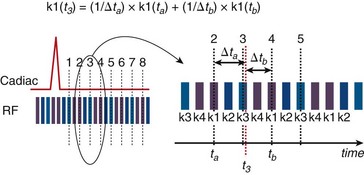
 FIGURE 13-2
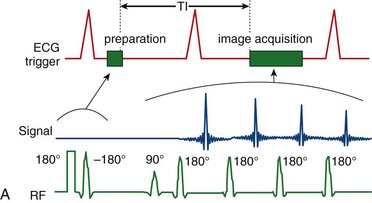
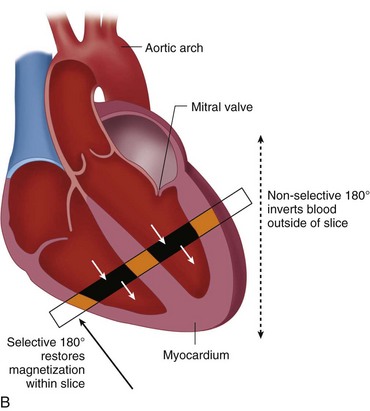
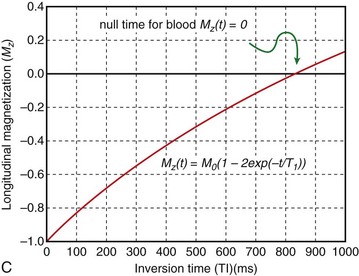
 FIGURE 13-3
 FIGURE 13-4
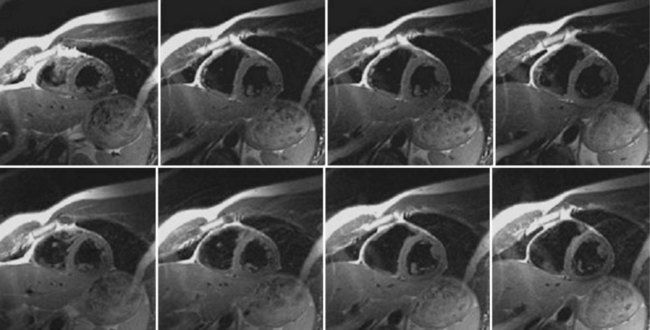
 FIGURE 13-5
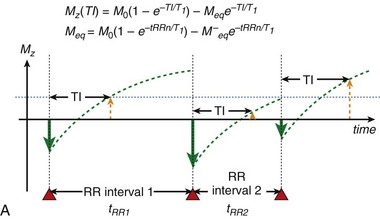
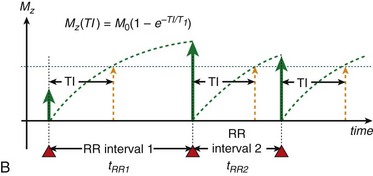
 FIGURE 13-6
 is defined as the longitudinal magnetization just prior to the application of the IR pulse in RR interval n (i.e., the longitudinal magnetization at the end of RR interval (n − 1).
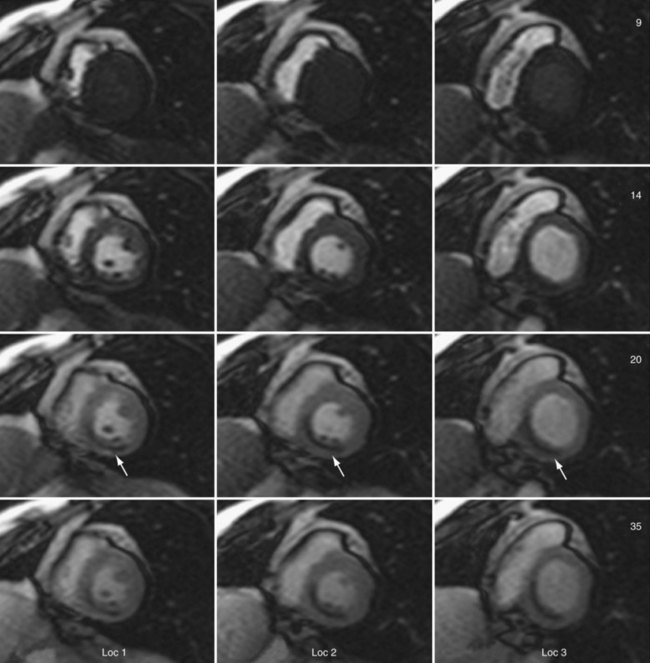
 FIGURE 13-7
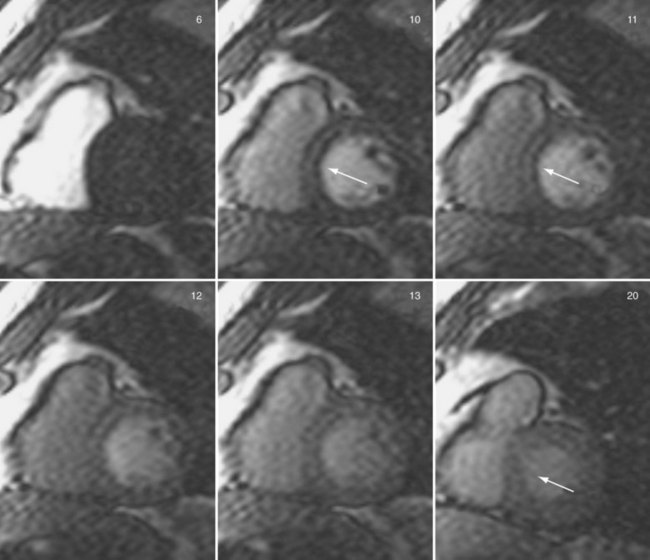
 FIGURE 13-8