In contrast to MRI, which gives a pictorial representation of body cross sections, MRS yields a “spectrum” of peaks at different radiofrequencies (“chemical shifts”). The chemical shift that results from differences in the local environment of the chosen nucleus is very small and is expressed in part per million (ppm) of the applied radiofrequency.
Since its introduction in 1946, MRS has emerged as a powerful technique for chemical analysis, molecular structure determination, and the investigation of molecular motion in solids and liquids. Since 1972, the advent of MRI has revolutionized the prospective application of 1H NMR in medicine, while the possibility that in vivo 31P MR spectra could be obtained gave the method a whole new dimension. With in vivo 31P MRS, a noninvasive method was developed for obtaining information regarding the cellular phosphate compounds which participate in tissue metabolism. Important indicators of bioenergetics obtained by 31P MRS are the ratios of the high-energy phosphates ATP and phosphocreatine (PCr) to inorganic phosphate (Pi). In addition, the intracellular pH can be determined from the chemical shift of the Pi peak. Localization methods have been developed to obtain 31P MR spectra of any desired region in animals and humans. However, hydrogen is the most sensitive nucleus to work with, that is, it gives the strongest signal back once excited in a magnetic field (Table 7.1). Therefore, in biomedical MRS of patients and other living matter, much effort has been put in suppressing the enormous signal arising from the protons of water in order to be able to detect the mobile protons of metabolites such as choline (Cho), creatine (Cr), inositol (In), glutamate/glutamine (Glx), N-acetyl aspartate (NAA), lactate (Lac), and lipids at concentration levels near the 1 mM range. This is five orders of magnitude lower than body fluids and tissues containing proton concentrations of up to 1,000[grams of water/L]/18[grams of water/mol] · 2[protons per mole of water] = 110 mol/L. Since the 1980s, the proton has thus become the most studied nucleus in biomedical MRS. The 15 times higher sensitivity of 1H MRS as compared with 31P MRS means that with the former method, 1 mM 1H in a given volume (“voxel”) will emit an equally strong RF signal as 15 mM phosphate at their respective RF frequency. Furthermore, unlike the 31P in phosphates, many 1H signals arise from multiple chemically equivalent protons, for example, as many as nine ones in the case of Cho (-N(CH3)3) resulting in a ninefold enhanced signal strength as compared with molecules represented by a single nucleus. With regard to the concentrations listed in Table 7.1, it should be remarked that especially in the case of phosphorus-31, a large number of nuclei are in macromolecules that are not detected under normal measurement conditions due to their very fast loss of magnetization.
Table 7.1
NMR-detectable nuclei in human tissues
Isotope with spin | Concentration (moles/L) | Gyromagnetic ratio (MHz/T) | Sensitivity (relative to 1H) |
|---|---|---|---|
1H | 110 | 42.58 | 1 |
2H | 0.015 | 6.53 | 0.0096 |
13C | 0.10 | 10.71 | 0.016 |
14N | 1.6 | 3.08 | – |
17O | 0.031 | 5.77 | 0.029 |
19F | 0.0066 | 40.05 | 0.830 |
23Na | 0.078 | 11.26 | 0.093 |
31P | 0.35 | 17.24 | 0.066 |
39K | 0.045 | 1.99 | 0.0005 |
There are many biomedical applications of MRI. The basic form, often referred to as conventional MRI, is to use frequency and phase encoding to be able to couple RF signals of specific frequency and phase to different areas in the image (pixels) or to volume elements in 3D (voxels). Thus, selected volumes in the human body can be imaged. Besides the water- and fat-concentration distributions, the signals in MRI are determined by the recovery of magnetization in the direction of the magnetic field (the longitudinal relaxation with time constant T1) and by the loss of magnetization in the perpendicular direction (the transverse relaxation with time constant T2). Other contrast phenomena used by MRI are the measurement of blood flow and tissue perfusion, whether or not with the use of a contrast agent or arterial spin labeling, diffusion, and blood-oxygen-level dependent (BOLD) so-called functional MRI (fMRI). Specific to MRS is the determination of cellular concentrations and dynamics (creatine kinase reaction, saturation transfer, diffusion).
During the past decades, MRS has gained a prominent position in neurology. In the next sections, the past, the present, and the future of MRS in neurology will be discussed.
7.2 The Past
The NMR phenomenon was independently discovered in 1946 by two groups (Purcell et al. 1946; Bloch et al. 1946). Their discoveries led to the use of NMR as a spectroscopic technique that could be used to determine chemical composition and the physical properties of a material and to probe the metabolism of a tissue. In medical applications, MRS was first used on tissues or fluids removed from the body and later developed for use on human subjects. Reviewed here are the results of neurological studies of the period up to 1997 when limitations in MRS localization and magnetic field homogeneity confined MRS studies to single voxels or poorly defined regions near surface coils. Subsequent technical improvements allowing for the acquisition of arrays of (multivoxel) brain MR spectra of higher spectral as well as spatial resolution, especially in studies performed at high magnetic field strengths (≥3 T), are described in Sect. 7.3.
The first MR spectra of the human brain in situ, 31P MR spectra, were those of a newborn human infant (Cady et al. 1983) that thanks to the earlier availability of small-bore magnets predated the first studies on adults (Bottomley et al. 1986). Metabolites detected by 31P MRS include phosphomonoesters (PME, mainly phosphoethanolamine and phosphocholine), Pi, phosphodiesters (PDE, mainly glycerophosphocholine and glycerophosphoethanolamine), PCr, and nucleoside triphosphates (mainly ATP). PME and PDE take part in lipid metabolism such as the formation and breakdown of cellular membranes. ATP is the form in which cell energy is stored, produced from the oxidation of glucose or from PCr by the creatine kinase reaction. Apart from the assessment of lipid and carbohydrate metabolism, 31P MRS is also used for noninvasive determination of intracellular pH, that is, from the (chemical shift) difference between the resonance frequencies of PCr and Pi. Metabolites, which have been detected in human brain by 1H MRS since 1989, include Cho (lipid metabolite), Cr (creatine kinase reaction), NAA (neuronal marker), and, depending on the experimental conditions, amino acids (protein components), In (sugars involved in neuroreception), and Lac (end product of glycolysis under hypoxic conditions). 1H MRS has been used in the study of cerebrovascular disorders, white matter disorders, metabolic disorders, epilepsy, and newborn infants (Henriksen 1992). Figure 7.1 shows examples of brain tumor spectra measured under conditions (TE=135 ms) that the Lac doublet is inverted relative to the Cho, Cr and NAA, and lipid signals and that amino acids and In are not detected. Natural abundance 13C spectra in the brain show mainly lipid resonances and also Cho, Cr, and carnitine. By this method, clear spectral changes were observed in patients with glycogen storage disease (Beckman et al. 1990). The study of specific metabolic processes after administration of 13C-enriched molecules will be discussed in Sect. 7.4.4.
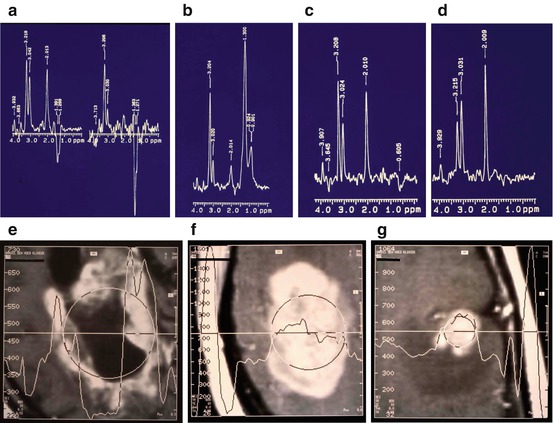

Fig. 7.1
Single voxel 1H MR spectra of brain metastases of breast cancer measured under conditions (TE=135 ms) that the Lac doublet is inverted relative to the Cho, Cr and NAA, and lipid signals. (a) Left part: large lesion with necrotic center showing Lac signal; right part: the center of the lesion showing lack of NAA and very high Lac; (b) Large lesion with a beginning of necrosis showing an intense Cho signal and lipids; (c) Small homogeneous lesion showing increased Cho and reduced NAA compared with a contralateral control voxel (d). The appearance of the corresponding lesions on MRI after Gd contrast are shown in (e–g) (Reproduced with permission from Sijens et al. (1994))
7.2.1 Cerebrovascular Disorders
31P MRS revealed PCr/Pi decreases during the first week after stroke (Levine et al. 1987) and also in migraine patients with prolonged auras or migraine strokes (Barbiroli et al. 1990). Loss of any phosphate metabolite was observed after chronic cerebral infarction (Bottomley et al. 1986). 1H MRS also revealed reduced metabolite levels (NAA, Cho, Cr) as opposed to detectable Lac at chronic infarction (Henriksen 1992; Duijn et al. 1992). Intense Lac signals show up during the first day after acute infarction (Barker et al. 1994; Bruhn et al. 1989a), an event coupled with drastic NAA decrease measured in the center of infarctions exceeding 2 cm (Lanfermann et al. 1995; Matthews et al. 1995). There seemed to be an inverse correlation between the Lac content and cerebral blood flow indicating that the Lac is washed out. If NAA loss reflects the degree of neuronal damage, 1H MRS could be used to assess neuronal affections caused by cerebrovascular disorders.
7.2.2 White Matter Disorders
In chronic white matter lesions (plaques) of multiple sclerosis patients, NAA is reduced and In increased compared with controls (Landtblom et al. 1996). NAA is reduced and Cho rather than In is increased in acute MS plaques showing Gd-contrast-induced signal enhancement on T1-weighted MRI (Roser et al. 1995), while lipid signals may be present (Narayana et al. 1992). Degenerative disorders of the elderly, Alzheimer and Parkinson diseases, were also studied by MRS. 1H MRS revealed NAA decreases and In increases in Alzheimer disease, even in cases of mild dementia (Shonk et al. 1995; Miller et al. 1993), whereas 31P MRS showed PME decreases compared with controls (Cuenod et al. 1995). In Parkinson disease, 1H MRS-measured NAA, Cho, and Cr are normal while Lac is present, especially in patients with superimposed dementia (Bowen et al. 1995). Distinct NAA decreases and Cho increases were observed in patients with AIDS-related dementia (Barker et al. 1995) as opposed to smaller spectral changes in asymptomatic patients (Laubenberger et al. 1996). In determining the presence of progressive encephalopathy in children with AIDS, MR spectroscopy appeared to be more specific than MR imaging and immunologic testing (Lu et al. 1996). Patients with other degenerative disorders, Alexander, Schilder, Cockayne, Leigh, and Pelizaeus-Merzbacher disease all showed decreased NAA and presence of Lac (Grodd et al. 1991). While showing promise as an early diagnostic tool for degenerative disorders, the potential of MRS for differentiation between these disorders appeared to be poor.
7.2.3 Epilepsy
1H MRS has revealed decreased NAA/Cho, normal to increased Cho/Cr ratios and occasionally Lac in epileptogenic hippocampus (Matthews et al. 1991; Ng et al. 1994). The reduction in NAA appeared to correspond with the neuronal loss seen on histology. 1H MR spectra thus seem to be excellent markers for locating a seizure focus. Despite the low spatial resolution of 31P MRS relative to the size of seizure foci, spectral changes were reported, that is, increases in Pi (Kuzniecky et al. 1992; Laxer et al. 1992) and pH (Laxer et al. 1992) and PME decreases (Laxer et al. 1992).
7.2.4 Neonatal Disorders
In order to interpret spectra correctly, age-dependent changes of brain metabolites have to be distinguished from alterations resulting from disease (Cady 1992). In 31P MR spectra, newborn infants PME peaks are larger and the PDE and PCr peaks relatively smaller than in older children (Laxer et al. 1992; Cady 1992); in 1H MR spectra, NAA increases with age while Cho decreases (Boesch et al. 1989; van der Knaap et al. 1990). Brain hypoxia due to asphyxia results in 31P MR spectra with reduced PCr/Pi ratios and (in severe cases) reduced ATP, shown to be useful prognostic indicators (Azzopardi et al. 1989). A promising 1H MRS application in the study of neonatal disorders appeared to be Canavan syndrome, a disease attributed to asparto-acylase deficiency, recognized from relative excess of NAA (Grodd et al. 1990; Austin et al. 1991).
7.2.5 Primary Brain Tumors
Primary brain tumors originate from glial, mesodermal, neuronal, and pituitary gland cells. The majority are gliomas graded histologically by two systems: Kernohan’s four grades (I, II, III, IV) and Burger’s three grades (well-differentiated astrocytoma, anaplastic astrocytoma, and glioblastoma multiforme). In 1992, Negendank reviewed the status of clinical tumor MRS, tabulated the results of 14 31P MRS studies and eight 1H MRS studies of primary brain tumors, and concluded that in 31P MRS it is generally difficult to discriminate glioma from normal brain, except for the observation of reduced PDE and increased pH in most high-grade gliomas (Negendank 1992). Tumors arising from tissue outside the nervous system such as meningiomas and pituitary adenomas resembled cancers outside the brain in the frequency of showing low PCr and high pH but differed by having decreased PDE (Negendank 1992). 1H MRS of primary brain tumors revealed increased Cho and reduced Cr and NAA compared with normal brain. Subsequent years showed that 1H MRS distinctions of increased Cho are observed in high-grade tumors compared with low grade (Arnold et al. 1990; Fulham et al. 1992; Gill et al. 1990), that is, in solid high-grade rather than necrotic high-grade brain tumors (Fulham et al. 1992). Increased lipid signals were reported in high grade vs low grade vs normal (Hagberg et al. 1995; Negendank et al. 1996) and decreased Cho/NAA and NAA/Cr in malignant vs benign vs brain (Sutton et al. 1992). Lac was often detected, though not considered to be a reliable indicator of malignancy (Fulham et al. 1992) or of tumor grade (Kugel et al. 1992; Ott et al. 1993). Alanine was observed in meningiomas (Gill et al. 1990; Kugel et al. 1992) and there have been some claims that 1H metabolic characteristics are specific for tumor type (Kugel et al. 1992; Bruhn et al. 1989b). One decade of experience in dozens of clinical research centers failed, however, to provide convincing evidence that, at least with the regular STEAM and PRESS studies performed at longer echo times (TE = 135 or 270 ms), 1H metabolic characteristics are specific for tumor type.
7.2.6 Metastatic Brain Tumors
Apart from a couple of metastatic brain tumors included in previous 1H MRS studies of primary brain tumors, the Dr. Daniel den Hoed Cancer Center in Rotterdam was the first to publish 1H MRS investigations of metastatic brain tumors (Sijens et al. 1994, 1995a, 1996, 1997a, 1998). An advantage in studying metastases rather than primary brain tumor is that metastases are more often untreated when examined for the first time in the cancer clinic. Furthermore, metastatic lesions tend to be multiple, unambiguous in origin and nature and smaller, more homogeneous, with dimensions (often spheric) that are more easily delineated, especially so after the administration of MRI contrast agent (van Dijk et al. 1997). The 1H MRS detected metabolite signals in brain metastases compared with those in normal brain revealed the same patterns as recently observed in primary brain tumors (previous paragraph): increased Cho and reduced NAA in tumor, generally accompanied by the presence of Lac or lipid signals (Sijens et al. 1994, 1995a). The results of MRS in the untreated metastatic brain tumors were correlated with the results of Gd-enhanced MRI (Sijens et al. 1994, 1996), and the spectra of Gd-enhancing tumor measured before and after Gd contrast administration were compared (Sijens et al. 1997b, 1998). Apart from a trend of reduced Cho and post-Gd MRI contrast in metastases of lung cancer compared with breast cancer and melanoma, MRI and MRS characteristics were independent of the tumor type (Sijens et al. 1995a, 1996). Untreated brain metastases can, however, be categorized into early stage (high Cho, homogeneous enhancement), intermediate stage (lipid, high Cho, strong homogeneous enhancement), and late stage metastases (Lac, lower Cho, heterogeneous enhancement). 1H MR spectra representative for these three tumor stages are shown in Fig. 7.1 together with a spectrum of normal brain tissue. At the used TE of 135 ms, the Lac doublet (1.32 ppm) is inverted relative to the Cho (3.2 ppm), Cr (3.0 ppm), NAA (2.0 ppm), and lipid peaks (CH3:0.9 ppm, -CH2-:1.3 ppm). Significant linear correlations were found between tumor Cho signals and post-Gd contrast in untreated metastatic brain tumor (Sijens et al. 1994, 1996). In 1H MR spectra of Gd-enhancing brain tumor, there was significant loss (12–15 %) in Cho peak area measured 5–10 min after contrast administration (0.1–0.2 mmol Gd/kg body weight) that was correlated with pre-contrast Cho linewidth, indicating an interaction of Gd with an extracellular Cho-containing tumor component (Sijens et al. 1997a, 1998).
7.2.7 Follow-Up After Radiation Therapy
One study of human brain cancer, examined by MRS and MRI shortly after treatment by radiation therapy and reexamined at intervals of 2 months, showed changes in post-Gd contrast that were inversely correlated with the changes in Cho level and in tumor volume (Sijens et al. 1995b). Changes in tumor Cho, Cr, and Lac signals were not correlated with changes in tumor volume. Decreases in the intensities of lipid signals and the appearance of Lac after radiation therapy, indicating a transition from microscopic necrosis to macroscopic necrosis, were observed in five of 13 cases. The main finding in this study, the Cho loss in tumors gaining post-Gd contrast after therapy, is paradoxical in view of the positive correlation between the two in untreated metastatic brain tumor (previous paragraph). Indicated is the use of 1H MRS to discriminate enhancing brain tumor with a high content of vital tumor cells (high Cho) from irradiated or otherwise treated tumor combining decreased cell density with increased interstitial space (low Cho).
With regard to the use of proton MRS in oncology, the following can be concluded: (1) 1H MR spectroscopy, though of little value in the discrimination between brain tumor types, can be used in follow-up under treatment, for example, to assess the loss of vital tumor tissue (Cho decreases) and the presence of microscopic (lipid) and macroscopic necrosis (Lac). (2) Indicated is the use of 1H MRS to discriminate enhancing brain tumor with a high content of vital tumor cells (high Cho) from tumor combining decreased cell density with increased interstitial space (low Cho) such as in radiation necrosis. (3) Diagnostic MRS examinations of brain tumors should not be performed immediately after contrast-enhanced MRI because of the observed loss of tumor Cho signal. However, with the implementation of technical improvements such as the use of shorter echo times (<135 ms; see Sect. 7.4.3) and higher magnetic fields (>1.5 T; Sect. 7.4.1), the detection of additional metabolites with short transverse relaxation times (T2) and low concentrations should be expected to open up new diagnostic possibilities in diagnostic radiology and neurology in general.
7.3 The Present
Originally, limitations in MRS localization and magnetic field homogeneity confined MRS studies to single voxels or poorly defined regions near surface coils. Subsequent technical improvements allowing for the acquisition of arrays of (multivoxel) brain MR spectra of higher spectral as well as spatial resolution, especially in studies performed at high magnetic field strengths (≥3 T), are described in this section. The first part (Sect. 7.3.1) deals with multivoxel MRS and the second part with high-field MRS (Sect. 7.3.2).
7.3.1 Multivoxel MRS
Multivoxel MRS, also referred to as chemical shift imaging (CSI) or as spectroscopic imaging (MRSI), has the advantage that pathology and contralateral normal brain tissue are measured simultaneously (Brown et al. 1982), and its advantages over single-voxel MR spectroscopy are widely established (Ebel et al. 2001; Howe and Opstad 2003). Unlike single-voxel MRS, multivoxel methods which have been applied in clinical neurology for well over a decade now (Sijens et al. 1997a) offer the opportunity to express the levels of Cho, Lac, and other metabolites in focal pathology directly in those detected in unaffected brain tissue.
However, in most clinical MRS studies published to date, single-voxel MRS methods have been used, allowing neither for quantitative comparison of focal pathology and normal brain tissue signals nor for the assessment of heterogeneity if an entire organ is affected by disease. Multiple problems complicate quantitative MRS. First, magnetic field homogeneity (B 0) is adjusted (“shimmed”) in each MRS experiment to get the narrowest possible line shape and the highest peak integral for the water peak in the volume of interest. This magnitude will differ between measurements in a non-reproducible manner and so will therefore the peak areas of the metabolites detected in subsequent water-suppressed 1H spectra or spectra of another nucleus such as 31P. Second, the profile of the RF field generated by the transmitter coils will cause differences in sensitivity over the volume of interest. Among other complications are uncertainties in the T1 and T2 relaxation times of the measured metabolites. In any MRS examination, there will be some extent of T1 and T2 weighting which can be corrected for if the true relaxation times are known, a condition not easily met in pathology. Gradient performance, the quality of noninvasive localization of the MR signal in the brain with minimization of eddy currents induced near gradient coils, is also crucial in localized MRS.
Stay updated, free articles. Join our Telegram channel

Full access? Get Clinical Tree


