Fig. 1.1
Magnetic resonance. A hydrogen proton absorbs radiofrequency energy and flips into a higher-energy state. As the radiofrequency is turned off, the proton relaxes back to a lower-energy state and releases energy in the form of radio waves which are detected and used to create MR image (B0 = direction of the main magnetic field)
Most MR imaging units use a superconducting magnet that is made up of wires coiled around the open bore of the machine. These wires are supercooled with cryogens such as liquid helium to reduce electrical resistance and as such, the machine is always “on,” and anyone working in the magnetic field must be careful to not bring any ferromagnetic objects into the scanning room since these can become lethal missiles if they are pulled into the magnet’s bore.
The field strength of clinical MR machines range from 0.2 Tesla (T) to 3 T, with most operating at 1.5 or 3 T. Typically, the higher the field strength, the better the images, and although that is not always the case, lower-field-strength units are not able to produce very high-resolution images, even with an optimized technique. Because a certain percentage of patients are too claustrophobic to tolerate the rather small bore of a standard machine, some MR units are designed with a larger bore (known as an “open” magnet), and smaller “extremity” scanners are also available in which only the affected extremity is placed within the machine. A major drawback of this type of machine is that it cannot be used to image more central joints such as the shoulder or hip.
In addition to placing the patient within the large “body” coil that surrounds the bore of the machine, smaller “surface” coils that conform more closely to the size of the body part being imaged are used for most MSK MR imaging examinations (Fig. 1.2). These are critical for producing high-resolution images since they can be positioned very close to the tissues of interest and maximize the amount of signal detected.
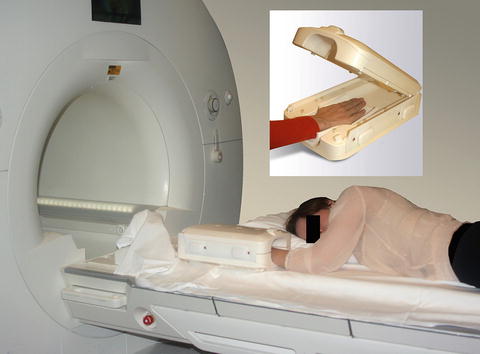

Fig. 1.2
Surface coil. In preparation for an MRI of the wrist, the patient’s hand is placed into the surface coil (inset) which is then placed into the bore of the magnet during scanning
Because of the nature and configuration of the machine, two patient-related factors should be considered before ordering an MR imaging study. First, because of the large magnetic field involved, patients must be screened for certain implants such as a pacemaker or some types of intracranial aneurysm clips as well as for a history of metal fragments within the eyes. These may be affected by the magnetic field and cause potentially fatal injuries.
Also, because of the relatively small bore of many machines, some patients will be too claustrophobic to complete the examination. Possible solutions include performing the exam with a larger “open-bore” magnet or “extremity” scanner or by administering sedatives either before or during the study.
Why Does the Image Look the Way It Does?
T1 and T2
Protons are influenced by the local molecular environment of the tissue in which they reside. As a result, protons in one type of tissue will behave differently from protons within a different tissue, and these differences provide the basis for the superb soft tissue contrast observed on MR images. The manner in which protons within a given tissue react during an MR scan is described by two characteristics known as “T1” and “T2” that are unique to each type of tissue. By changing the way in which the parameters for a given scan are set up, the images produced may emphasize differences in these values resulting in what are called “T1-weighted” (T1W) or “T2-weighted” (T2W) images, respectively. By comparing the appearances of a tissue on T1W and T2W images, the type of tissue present can often be deduced based on its signal characteristics.
For example, the signal intensity of fluid is quite low on a T1-weighted (T1W) image and very bright on a T2-weighted (T2W) image (Fig. 1.3a, b). This is why each MR examination is composed of several imaging “sequences” that are obtained with different scanning parameters, and a basic understanding of the most common pulse sequences used in musculoskeletal (MSK) imaging is important.
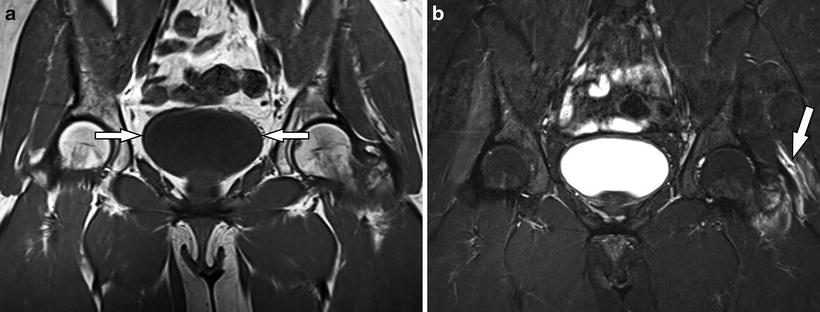

Fig. 1.3
(a, b) Fluid. (a) Coronal T1-weighted image demonstrates low-signal fluid within the bladder (arrows). (b) The corresponding coronal STIR (T2W) image reveals increased signal-intensity fluid within the bladder as well as tearing of the left gluteus medius/minimus tendons along the greater trochanter (arrow)
Pulse Sequences
When performing an MR imaging study, several different “sequences” are obtained with each sequence displaying the tissues in a different way. The most common sequences used in MSK imaging are T1, T2, proton density, inversion recovery, and gradient echo. It is not critical to know the details of how each sequence is performed, but it is helpful to know what the normal appearances of various tissues are on each. (See the next section on Normal Musculoskeletal Tissues and Table 1.1.)
Table 1.1
Tissue appearance by MR pulse sequence
Fat | Fluid | Fibrocartilage | Hyaline cartilage | Tendons, ligaments | Yellow marrow | Red marrow | |
|---|---|---|---|---|---|---|---|
T1 | Bright | Dark | Dark | Intermed | Dark | Bright | Intermed |
T2 | Bright | Bright | Dark | Intermed-dark | Dark | Bright | Bright |
Proton density | Bright | Intermed | Dark | Intermed | Dark | Bright | Intermed-bright |
Inversion recovery (STIR) Also fat-sat T2 | Dark | Bright | Dark | Dark | Dark | Dark | Bright |
Gradient echo | Variable | Variable | Dark | Usually bright | Intermed-dark | Variable | Variable |
Gadolinium Contrast Agents
Gadolinium-based contrast agents are commonly used in MR imaging studies. This agent produces increased signal intensity on T1W images and can be administered intravenously (analogous to iodinated contrast with CT scanning) or as a dilute solution that is directly injected into a joint to perform an MR arthrogram. (The latter is considered an “off-label” use by the Food and Drug administration, but it is a routine procedure in most practices.)
Intravenous
Any tissue that contains increased vascularity will take up intravenous gadolinium and demonstrate bright enhancement on T1W images (Fig. 1.4a). Typical situations in which intravenous gadolinium is used include suspected infection in the soft tissue or bone, evaluation of a soft tissue mass, or in a postoperative tumor case.
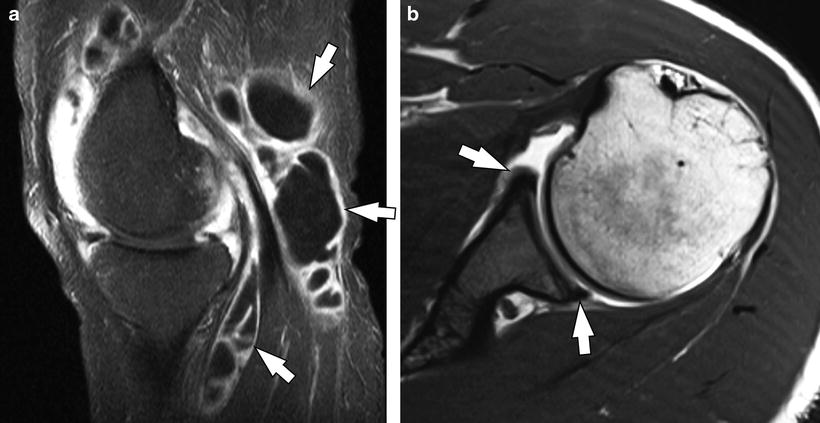

Fig. 1.4
(a, b) Gadolinium contrast. (a) Sagittal T1-weighted image with fat saturation obtained after the intravenous injection of gadolinium contrast material reveals pronounced synovial thickening and enhancement throughout the joint and a multilocular popliteal (Baker’s) cyst (arrows). Note the central areas of nonenhancing fluid within the cyst. (b) Axial T1-weighted image from an MR arthrogram showing high-signal-intensity gadolinium distending the joint and outlining the glenoid labrum (arrows)
Intra-articular (MR Arthrography)
Many intra-articular structures become more conspicuous when a joint is distended with fluid, and while this can be accomplished with simple saline, a dilute gadolinium solution is typically used combined with T1W imaging (Fig. 1.4b). This is most commonly performed in the shoulder and hip but can be used in any joint to better assess articular cartilage or other structures such as a previously repaired meniscus or labrum.
Fat Saturation
Another technique that is commonly used in MSK examinations is the application of “fat saturation” during scanning. This refers to techniques that turn the typically bright signal intensity of fat dark, and a fat-saturated sequence is usually easy to recognize since most of the image will be quite dark overall. This technique can be advantageous for a number of reasons.
Since most types of pathology result in increased fluid content in the affected tissues, these areas will be bright on a T2W image, and by darkening the normally high-signal-intensity fat, the areas of pathology will become much more conspicuous than if fat saturation is not used (Fig. 1.5a, b). Additionally, when gadolinium contrast is administered intravenously, any tissues that have increased vascularity will take up the contrast and brighten on T1W images and once again, if fat saturation is applied, any areas of enhancement will be much easier to identify (Fig. 1.4a).
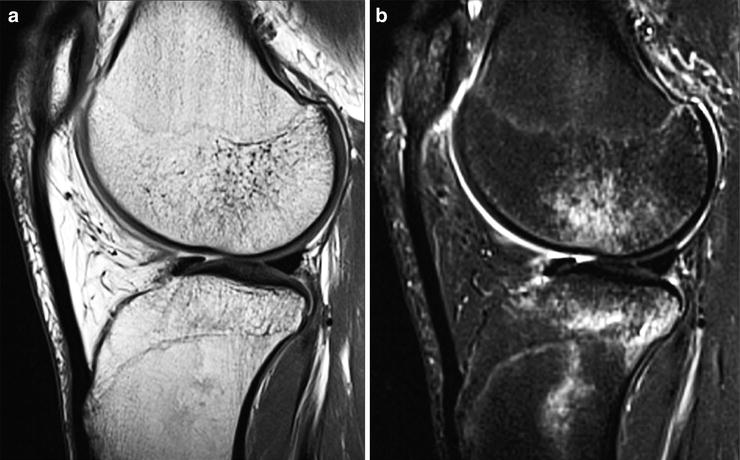

Fig. 1.5
(a, b) Bone marrow contusions. (a) The marrow within the distal femur and proximal tibia appears normal on this sagittal proton-density-weighted image; however, a corresponding sagittal STIR image (b) in which the fat is suppressed reveals prominent high-signal-intensity edema/hemorrhage at the sites of bone marrow injury
What Should Normal Musculoskeletal Tissues Look Like on MRI? (Table 1.1)
Fluid
As mentioned previously, fluid displays a characteristic appearance on MR images. On a T1W sequence, the signal intensity of fluid will be homogeneously low (lower than skeletal muscle), while on a T2W image, it becomes very bright (Fig. 1.3a, b). As such, if you can identify a structure that is known to be fluid filled such as the bladder or thecal sac, you can determine whether you are viewing a T1W or T2W image based on whether the fluid is dark (T1) or bright (T2). Also, since most types of pathology result in increased fluid content within the affected tissues, these will be most easily detected on a fat-saturated T2W sequence since the fluid will be very conspicuous against the dark background of suppressed fat.
Fibrocartilage
Fibrocartilaginous structures such as the menisci in the knee or the glenoid labrum demonstrate low signal intensity on all sequences (Fig. 1.6).
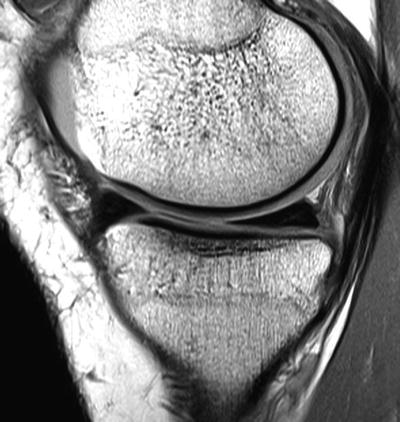

Fig. 1.6
Normal meniscus. Sagittal proton-density-weighted image shows diffusely low signal intensity within the anterior and posterior horns of a normal medial meniscus, a characteristic appearance of fibrocartilage. Note the small areas of intermediate signal intensity within the meniscal substance compatible with mild mucoid degeneration
Hyaline Cartilage
The MR appearance of hyaline articular cartilage is variable and depends upon which imaging sequence is used. The most important thing when evaluating articular cartilage is to use a sequence that provides excellent contrast between cartilage and joint fluid. The common techniques for doing this include proton density or fat-saturated T2W (or STIR) sequences in which the articular cartilage is of lower signal intensity than adjacent joint fluid (Fig. 1.7).


