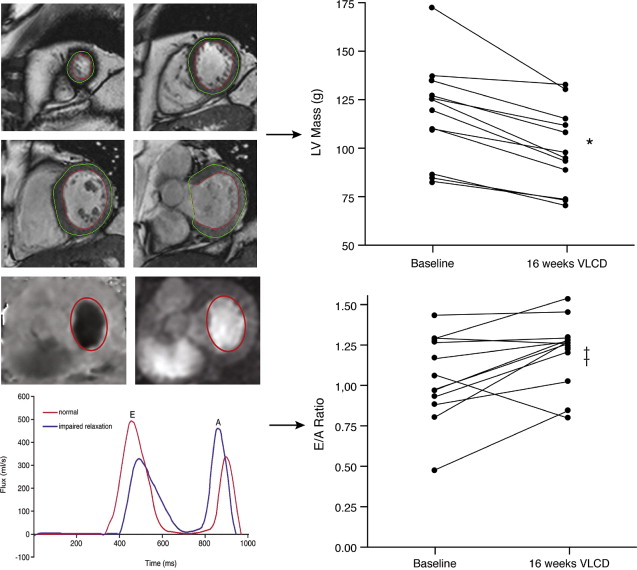
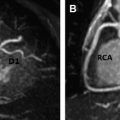
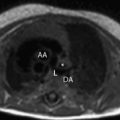
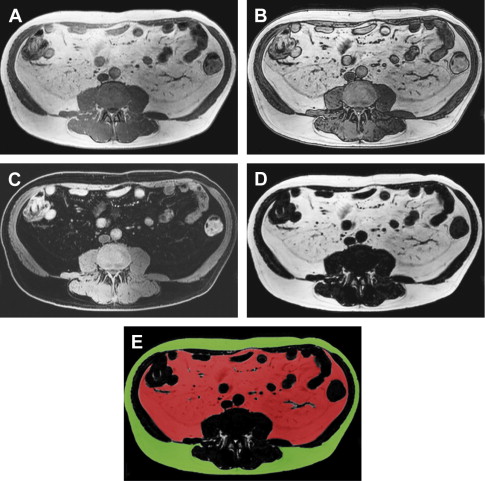
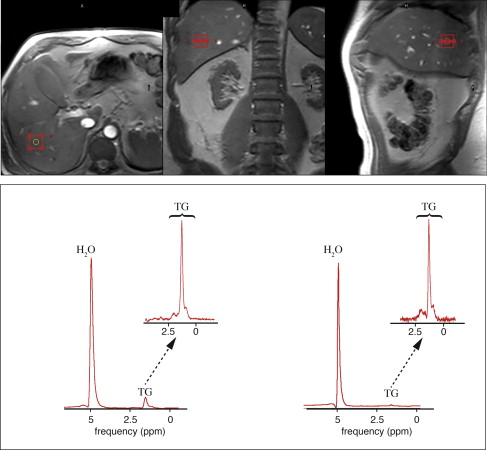
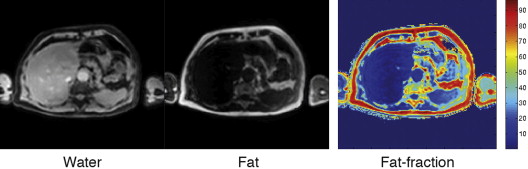
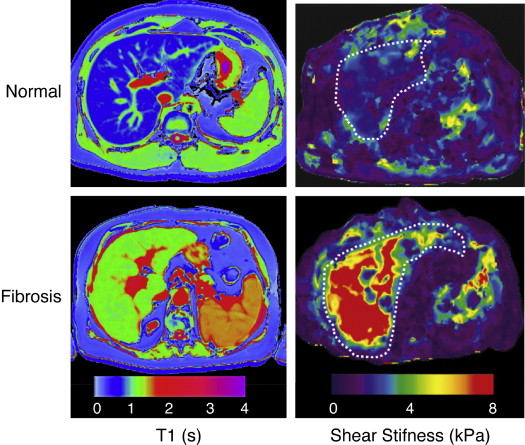
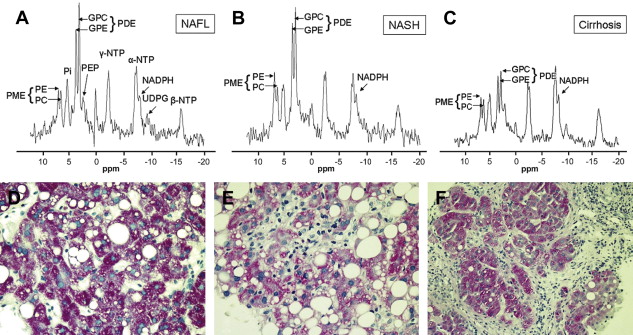
The metabolic syndrome (MetS) is characterized by ectopic lipid accumulation. Magnetic resonance (MR) imaging and spectroscopy can quantify ectopic lipid accumulation. Consequences of MetS can be evaluated with MR on a whole-body level. In the liver, several techniques are used to quantify hepatic steatosis and differentiate stages of nonalcoholic fatty liver disease. Cardiac MR can quantify myocardial steatosis and associated complications. In the brain, magnetization transfer imaging and diffusion tensor imaging can detect microstructural brain damage. Various other organs can be assessed with MR. MR is a powerful tool to unravel whole-body MetS pathophysiology, monitor therapeutic efficacy, and establish prognosis. State-of-the-art magnetic resonance (MR) technologies provide whole-body assessment of metabolic syndrome (MetS) pathophysiology and complications. MRI and MR spectroscopy image and quantify ectopic lipid accumulation, such as pericardial/perivascular fat, visceral abdominal fat, and fatty infiltration of organs, associated with adverse outcome. By using MR elastography, T1-mapping, phosphorus MR spectroscopy, and diffusion-weighted imaging, MR can assist in staging nonalcoholic fatty liver disease. Using cardiac MRI, spectroscopy, and mapping techniques, key features of diabetic cardiomyopathy, such as diastolic dysfunction, left ventricular hypertrophy, myocardial steatosis and fibrosis, can be quantified. Novel MR techniques, such as magnetization transfer imaging and diffusion tensor imaging, demonstrate microstructural brain damage in MetS. About one third of the United States population of 20 years or older has metabolic syndrome (MetS) and its prevalence increases with advancing age and body mass index, stressing its tight association with the obesity epidemic. Diagnosis of MetS requires positive identification of at least 3 out of 5 criteria displayed in Table 1 . As such, approximately 90% of type 2 diabetes mellitus (DM2) patients have MetS. Patients with MetS are heterogeneous in nature with varying risk of disease and consequently require personalized care, for example, by MR prognosis, in terms of future cardiovascular and cerebrovascular events ( Fig. 1 ). MetS is a systemic disease with complex pathophysiology including insulin resistance, atherogenic dyslipidemia, hypertension, ectopic lipid accumulation, low-grade inflammation, prothrombotic state, and fibrosis resulting in end-organ damage. MRI and magnetic resonance spectroscopy (MRS) can be used to quantify ectopic lipid accumulation. Importantly, as shown in Fig. 2 , functional and structural consequences of MetS can be evaluated with MR on a whole-body level. In the liver, several techniques—ranging from MRS and water fat imaging to magnetic resonance elastography (MRE) and T1 mapping—are used to quantify hepatic steatosis and differentiate between stages of nonalcoholic fatty liver disease (NAFLD). In parallel, cardiac MR can quantify myocardial steatosis and associated complications, such as diastolic dysfunction and fibrosis. In the brain, magnetization transfer imaging and diffusion tensor imaging (DTI) can detect microstructural brain damage associated with MetS. The involvement of various other organs ranging from kidney to pancreas and skeletal muscle can be assessed with MR. This review highlights MR techniques that assess multi-organ involvement in MetS. Ectopic lipid accumulation in white adipose tissue (WAT) predominantly occurs in the visceral abdominal compartment. Visceral white adipocytes can contribute to MetS etiology by secreting excessive amounts of plasma free fatty acids, adipokines, and cytokines. MetS prevalence correlates with waist circumference, reflecting the role of abdominal obesity. However, waist circumference does not differentiate between subcutaneous adipose tissue (SAT) and visceral adipose tissue (VAT). Given that VAT has a stronger association with MetS than SAT, differentiation between SAT and VAT is critical. Several MR techniques can be used to reliably quantify SAT and VAT. These include T1-weighted imaging, frequency-selective lipid imaging, and chemical shift-encoded water–fat imaging, all different methods that can be lumped under the umbrella of water–fat MRI ( Figs. 3 and 4 ). An appropriate sequence can be chosen on the basis of local accessibility, available scanning time, and presence of image postprocessing expertise. An overview of MR techniques for lipid quantification and their advantages/disadvantages is reviewed by Hu and Kan. In addition to abdominal VAT, ectopic lipid accumulation around the heart (pericardial fat) and vessels (perivascular fat) is increased in MetS. Pericardial/perivascular fat is physiologically protective in terms of mechanical support and as a source of biochemical substrates, hormones, and cytokines. However, increased pericardial/perivascular lipid accumulation in MetS has been linked with low-grade systemic inflammation, adverse metabolic profile and risk of ischemic heart disease. Various electrocardiogram-gated MR sequences, including steady-state free precession short axis sequences, fat-selective imaging (see Fig. 4 ), and water–fat MRI, can be used to image pericardial fat and enable volume quantification in a reproducible manner. In contrast to WAT, brown adipose tissue (BAT) volume and activity are diminished in obesity and may play a role in its development. BAT contributes significantly to total resting energy expenditure by dissipating glucose and free fatty acids into heat. The reference method for imaging BAT volume and activity is fluorodeoxyglucose PET-CT after mild cold exposure. The desire for a nonirradiating alternative has led to many MR techniques being evaluated to image BAT. These techniques identify BAT by its higher water fraction compared with WAT. However, MR of BAT is limited by the fact that, in humans, BAT and WAT are not entirely separated anatomically, complicating reliable BAT volume quantification. MRI of BAT activity is still in its infancy, although promising results using T2* imaging have been published recently. Ectopic lipid accumulation in the liver, that is, hepatic steatosis, is present in the majority of MetS patients and plays a central role in the pathogenesis of insulin resistance, hyperglycemia, and atherogenic dyslipidemia. The gold standard to determine hepatic steatosis is histology which requires a biopsy. However, several MR techniques can assess hepatic triglyceride (TG) content noninvasively with lower sampling error. Currently, proton MRS ( 1 H-MRS) is the noninvasive gold standard to quantify hepatic TG content ( Fig. 5 ). 1 H-MRS has the best sensitivity for detection of small amounts of fat. A drawback of this technique is the risk of sampling error inherent to quantifying TG content in a small voxel. Recently, the mDIXON technique using multiple echoes has been shown to enable liver fat quantification ( Fig. 6 ). By applying the mDIXON technique, T2* effects caused by the relatively high iron content in the liver can be compensated. The technique is becoming increasingly popular because of its advantages of small sampling error (because it is a whole-organ imaging technique) and fast data acquisition. Multidimensional chemical shift imaging is a multivoxel 1 H-MRS technique that measures a grid of multiple voxels, thus reducing sampling error. The disadvantage of chemical shift imaging is that data acquisition is slow and technically challenging. Hepatic steatosis can progress into nonalcoholic steatohepatitis, fibrosis, and ultimately cirrhosis and hepatic failure, a disease spectrum termed NAFLD. MRE, T1 mapping, phosphorus MRS ( 31 P-MRS), and diffusion-weighted imaging (DWI) are the focus of ongoing research to differentiate between NAFLD stages, and explore potential advantages compared with histology, that is, lower sampling error and fewer complications. MRE ( Fig. 7 ) is an emerging technique that quantitatively images shear waves in the liver produced by external mechanical waves. A few validation studies have shown MRE’s capability of differentiating between stages of NAFLD. T1 mapping is more readily available than MRE in terms of commercially available imaging sequences. This technique is based on the increased T1 relaxation time of edematous (nonalcoholic steatohepatitis) and fibrotic tissue. In NAFLD, several studies have been performed, showing a strong correlation between increasing T1 and increasing stages of fibrosis (see Fig. 7 ). In parallel with quantification of extracellular volume (ECV) expansion in cardiac imaging, ECV quantification in the liver is also feasible. However, validation studies for ECV mapping to quantify liver fibrosis have yet to be published. 31 P-MRS can quantify metabolites involved in cell membrane metabolism as well as regulators of fibrosis pathogenesis can be assessed ( Fig. 8 ). Additionally, hepatic energy metabolism can be assessed by quantifying high energy phosphates. DWI is a promising technique that measures water movement in extracellular space. Unfortunately, DWI is less reliable in the presence of fat, which limits its use in NAFLD. Future studies must focus on correcting for the influence of fat in order for DWI to become suitable for NAFLD staging. Cardiac MRI (anatomic, functional, angiography, perfusion, late gadolinium enhancement) is an important component in the assessment of a major complication of MetS, namely ischemic heart disease, which is reviewed elsewhere. This section covers MR techniques to assess nonischemic remodeling in MetS, that is, “diabetic cardiomyopathy,” which is characterized by diastolic dysfunction, hypertrophy, disrupted cardiac energy metabolism, and ECV expansion related to myocardial fibrosis. Diastole comprises a combination of active (energy-consuming) relaxation and passive compliance. In MetS, diastolic dysfunction is an early feature and independent predictor of mortality. Diastolic dysfunction is caused by altered myocardial energetics and by diminished ventricular compliance. MR using phase contrast imaging with velocity encoding is a robust technique to quantitatively assess diastolic function ( Fig. 9 ). Although the left ventricle (LV) has been the primary focus of research, recent findings show that right ventricular diastolic dysfunction is analogous to LV diastolic dysfunction.
Key points
Introduction
Epidemiology
Definition
MetS Criteria (NCEP-ATP III Criteria)
Definition
Abdominal obesity: waist circumference
Men >40 inches
Women >35 inches
Increased plasma triglyceride level
>150 mg/dL
Decreased plasma HDL level
Men <40 mg/dL
Women <50 mg/dL
Elevated blood pressure
>130/85 mm Hg
Increased plasma fasting glucose
>100 mg/dL

MRI of Multi-Organ Involvement in the Metabolic Syndrome

Purpose of Review
Adipose tissue
White Adipose Tissue
Abdominal visceral obesity
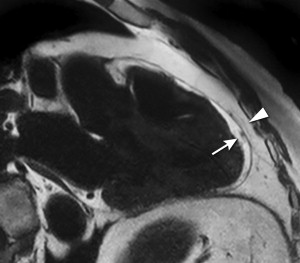
Pericardial and perivascular fat
Brown Adipose Tissue
Liver
Hepatic Steatosis
Progression of Hepatic Steatosis into Inflammation, Fibrosis, and Cirrhosis
Heart
Diastolic Dysfunction