MR Spectroscopy in the Brain
Overview
Proton magnetic resonance spectroscopy (MRS) is an MR-based chemical analytical technique that can be performed on any high field magnet. Rather than providing images, it usually provides spectra consisting of individual peaks, the chemical shift of which from a universal standard helps identify the species comprising the peak. The normal spectrum from gray matter is different from the normal spectra from white matter (Fig. 29-1). MRS is the equivalent of the nuclear magnetic resonance (NMR) used in organic chemistry—only now performed on a patient in a whole-body MR magnet.
MRS is a functional technique. It can identify abnormalities not seen on conventional MRI, for example, invasion of a glioblastoma multiforme (GBM) into adjacent brain where there is no enhancement or T2 abnormality on MRI. It can distinguish between two or more abnormalities that appear the same on MRI, for example, recurrent GBM versus radiation necrosis.
As in NMR, the area under a given peak is proportional to the number of protons contributing to the peak. So, taking ethanol (CH3— CH2—OH) as an example, the area under the methyl (CH3) peak would be 3 (in relative units), the area under the methylene (—CH2—) peak would be 2, and the area under the hydroxyl (—OH) peak would be 1. Since the peaks generally have the same shape, this ratio of peak areas also holds for peak heights. In general, peak height is proportional to the concentration of a given species. MRS requires a species to be present in at least a 1 mM concentration to be seen.
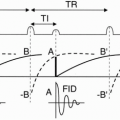
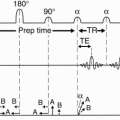
The above discussion is somewhat simplified. In actuality, the protons on adjacent carbons influence the net magnetic field on each other. So the magnetic field experienced by the methyl protons in ethanol would be influenced by the adjacent methylene protons. In quantum mechanical sense, these two protons can either both point up, both point down, or one up and one down or one down and one up. When they both point up the net magnetic field experienced by the adjacent methyl protons is slightly higher than B0 and when they both point down, it is slightly lower than B0, which shifts the peaks. Up-down and down-up cancel each other and results in the same peak position as one would have without any adjacent protons. This is known as “spin-spin splitting,” and it results in a big peak with area or peak height of 3 to be split into three peaks (called a “triplet”) of area 1-2-1 (Fig. 29-2). Spin-spin splitting or “J-coupling” smears the chemical shift, making peak identification more difficult. It increases with increasing TE.
MRS in the brain is generally performed in conjunction with MRI which identifies the abnormality. For single voxel techniques, a volume of 8 cc is generally recommended at 1.5 T. A smaller voxel can be used but the signal-to-noise ratio (SNR) will be reduced (Fig. 29-3). Since peak height is generally proportional to field strength, a smaller voxel can be used at 3 T, reducing partial volume averaging. Generally, a second spectrum is acquired in the contralateral normal brain.
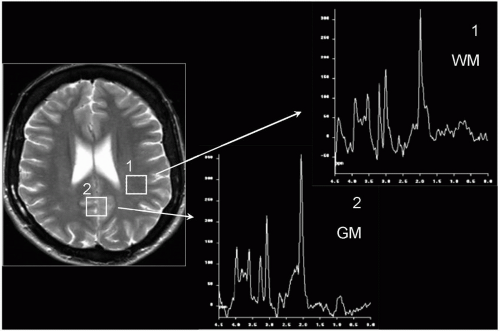 Figure 29-1. Normal spectra for white matter (1) and gray matter (2). Note: the higher Cho level in normal white matter (third highest peak). |
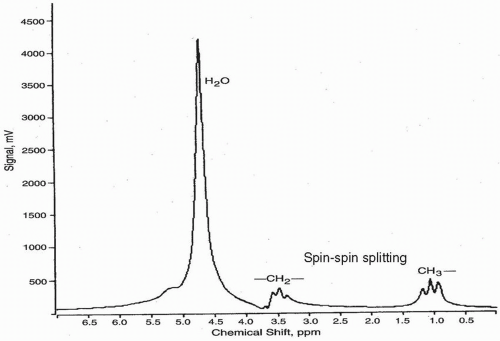 Figure 29-2. Spectrum from ethanol. Note: spin-spin splitting of methylene and methyl peaks. |
Occasionally, the voxel is not placed on a lesion but in gray matter or white matter. Figure 29-1 shows the recommended voxel placement and resulting normal spectra. For gray matter, it is both calcarine cortices, spanning the posterior interhemispheric fissure. A standardized white matter voxel is in the high parietal lobe.
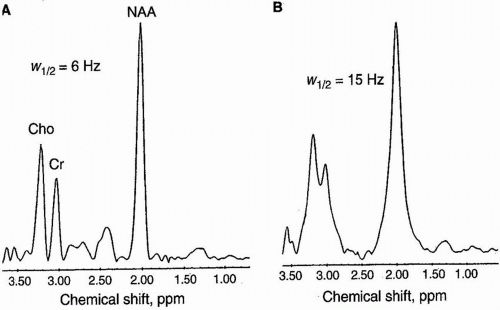
Once the voxel is placed on a lesion, the magnetic field in that voxel is made more uniform or “shimmed.” Shimming results in improving the
uniformity from 1 part per million (ppm) in the main magnetic field to 0.1 ppm inside the voxel (Fig. 29-4). For multivoxel techniques, the shimming must be performed throughout a slice, which now provides multiple 1 cc voxels.
uniformity from 1 part per million (ppm) in the main magnetic field to 0.1 ppm inside the voxel (Fig. 29-4). For multivoxel techniques, the shimming must be performed throughout a slice, which now provides multiple 1 cc voxels.
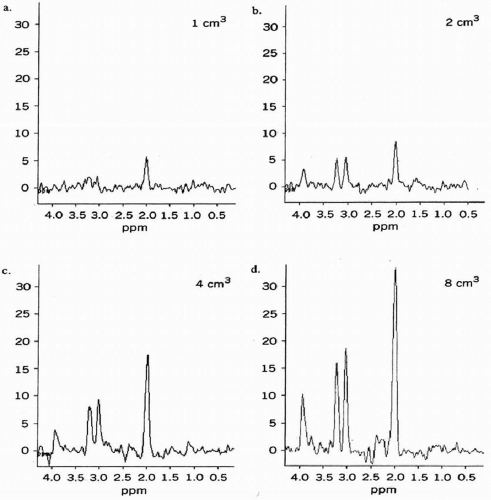 Figure 29-3. Signal-to-noise ratio as a function of voxel volume. |
In addition to shimming, the technologist must also suppress the signal coming from water—which has 100,000 times more signal than that coming from the metabolites comprising the peaks in the spectrum. Water suppression is accomplished by exposing the voxel to an RF pulse that is 4.7 ppm from the universal standard, which, by definition, is at 0 ppm. This universal standard is TMS (tetramethylsilane). Having 4 methyl groups (12 protons) all in the same chemical environment gives it a peak height of 12! Peak position is always expressed in ppm relative to TMS because it doesn’t change
between field strengths, whereas the actual frequency shift would go linearly with field strength. Thus data obtained at 1.5 T can be applied at 3 T as long as it is expressed in ppm.
between field strengths, whereas the actual frequency shift would go linearly with field strength. Thus data obtained at 1.5 T can be applied at 3 T as long as it is expressed in ppm.
 |