It is often clinically difficult to differentiate among the various neurodegenerative disorders such as dementias, hydrocephalus, and movement disorders, and even between pathologic and normal aging. In recent years, more specific and sensitive neuroimaging criteria have evolved to more accurately establish the correct diagnosis in these disorders. Magnetic resonance imaging (MRI), with its ability to image both the structure and function of the living brain, is an invaluable tool. In general, the tendency is to move away from simply excluding other (brain) diseases toward finding specific pointers to a diagnosis in the field of neurodegenerative disorders. The contribution of MRI to the evaluation of neurodegenerative disorders will no doubt increase as the population ages and as new pharmacologic and surgical therapies for these disorders develop.
Normal Aging
Normal aging of the brain can be defined as a set of structural, metabolic and functional abnormalities of both the gray (GM) and white (WM) matter. Incidental WM hyperintensities (WMHs) can be seen on computed tomography (CT) scans, but they are better visualized on proton density–weighted, T2-weighted, and fluid-attenuated inversion recovery (FLAIR) MRIs of the brain in about 30% of healthy subjects older than 60 years. Their prevalence rises steadily with increasing age. Age-related WMHs are usually located in the deep and subcortical WM and around the ventricles ( Fig. 15-1 ). Brainstem lesions are less common. They have different features on MRI scans, the most typical of which are punctate hyperintensities, periventricular caps and halos, and large lesions (which can be confluent).
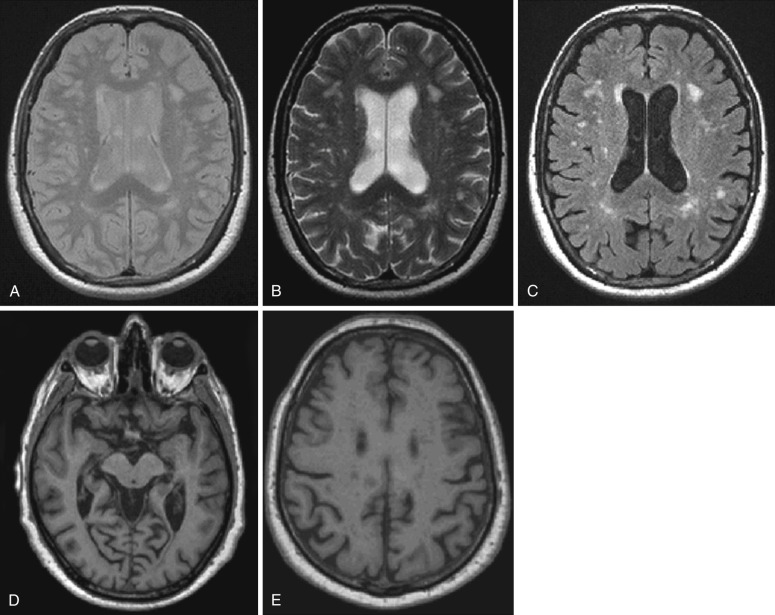
The severity of normally occurring brain volume loss is variable, ranging from minimal to moderately severe. Age-related changes in brain volume are apparent in both postmortem and in vivo MRI studies (see Fig. 15-1 ). Pathologic studies have found that brain weight peaks by the middle to late teens and declines slowly (0.1%-0.2% a year) until the age of 60 to 70, after which losses accelerate. Longitudinal MRI studies report that rates of global atrophy in healthy people increase gradually with age from an annual rate of 0.2% a year at age 30 to 50 to 0.3% to 0.5% at age 70 to 80. GM volume starts to decrease early in life (at the end of the first decade), whereas WM volume starts to decrease at the fourth decade. On average, GM volume loss is greater in the cortex than in subcortical structures. Age-related cortical density decrease seems to follow a gradient, with greatest and earliest changes occurring in association areas, especially those of the prefrontal cortex. However, recent MRI studies have described, in addition to an age-related atrophy of associative cortices, a widespread age-related thinning of a large portion of the cortical ribbon, including several primary areas, which were previously considered to be spared by aging. Cerebral WM also exhibits various types of degenerative changes. Although WM loss starts later in life than that of GM, the rate of such a tissue loss seems then to be faster. WM age-related loss is more pronounced in subcortical regions (with a preferential involvement of the frontal lobe). Diffusion tensor (DT) MRI studies confirmed reduced WM integrity in elderly people, especially in the frontal lobes.
Dementia
Dementia can be caused by myriad pathologic processes, including anatomic (e.g., abscess, tumor, subdural hematoma, posttraumatic encephalomalacia, diffuse axonal injury), metabolic (e.g., electrolyte imbalance, nutritional deficiency, endocrinopathy, toxic exposure, medications), psychiatric (depression), degenerative (e.g., Alzheimer’s disease [AD], Parkinson’s disease [PD], frontotemporal dementia [FTD], dementia with Lewy bodies [DLB]), vascular (e.g., cerebral infarction, Binswanger’s disease, CADASIL), infectious/inflammatory (e.g., chronic meningitis, vasculitis, prion disease, Hashimoto’s encephalopathy), demyelinating disease (e.g., multiple sclerosis), and paraneoplastic phenomena (e.g., limbic encephalitis). It is often not possible to establish the cause by clinical examination alone. Neuroimaging assessment, traditionally and currently, is used to rule out the presence of some treatable causes of dementia. Current imaging techniques allow us to determine whether findings are consistent with or even typical of a certain diagnosis.
Alzheimer’s Disease
AD, the most common dementing disorder in older adults, has been recognized as one of the most significant health problems of the 20th and 21st centuries. AD is estimated to affect 10% of people older than 65 years and 50% of individuals older than 85 years. Two abnormal protein aggregates characterize AD pathology: neuritic plaques and neurofibrillary tangles (NFTs). Neuritic plaques are extracellular deposits and consist of a dense central core of amyloid β fibrils with inflammatory cells and dystrophic neurites in its periphery. The second major proteinopathy in AD is aggregated tau, which consists of intraneuronal polymers primarily composed of hyperphosphorylated tau in the form of NFTs.
In typical late-onset (arbitrarily defined as age at onset > 65 years) AD, the medial temporal lobes (MTL), especially the hippocampus and entorhinal cortex, are among the earliest sites of pathologic involvement ( Fig. 15-2 ). MTL atrophy in the presence of memory loss is now one of the supportive biomarkers to make a diagnosis of AD proposed by the new diagnostic criteria. Other severely affected regions include the posterior portion of the cingulate gyrus and the precuneus on the medial surface (see Fig. 15-2 ), and the parietal, posterior superior temporal, and frontal regions on the lateral cerebral surfaces.

Structural MRI studies in mild cognitive impairment (MCI) have produced mixed results, both in terms of hippocampal and posterior cingulate and parietal involvement (absent, unilateral, or bilateral). The reasons for this variability may consist of different subject selection (i.e., diverse diagnostic inclusion criteria), small sample size (i.e., studies are not adequately powered to pick up differences even at the group level), and methodological differences. It is also worth noting that the largest source of variance in MCI studies is likely to be the intrinsic heterogeneity of the MCI population, because a relevant proportion of these subjects will not progress to dementia. MCI patients with predominant memory impairment (amnestic MCI), who are at increased risk of developing AD, have atrophy in a consistent set of cortical regions (the “cortical signature of AD”), including the MTL and temporoparietal cortex. Conversely, nonamnestic MCI shows a different pattern of atrophy characterized by relative sparing of the MTL and a regional involvement that is typically highly consistent with the observed clinical deficits. It should be emphasized that MTL atrophy may occur in other diseases as well; thus MTL atrophy alone lacks the specificity to confidently exclude other dementias, in particular in patients at the MCI stage.
Early-onset AD patients (i.e., onset of symptoms before age 65) showed less prominent MTL atrophy and greater involvement of the parietal, lateral temporal, and frontal regions compared to late-onset AD cases. A specific visual rating scale has been designed, evaluating the posterior cingulate, precuneus, and superior parietal regions. The utility of such a scale has been assessed in pathologically proven (mostly early-onset) AD and frontotemporal lobar degeneration (FTLD) patients. Thirty percent of AD patients had posterior atrophy in the absence of abnormal MTL atrophy, whereas only 7% of the FTLD group had abnormal posterior atrophy scores and normal MTL. Adding the posterior atrophy to the MTL visual rating score improved discrimination of early-onset AD from normal controls and all AD from FTLD cases.
Cerebral blood flow (CBF) single-photon emission computed tomography (SPECT) and F-fluorodeoxyglucose (FDG) positron emission tomography (PET) scans of typical AD patients demonstrate predominant hypoperfusion or reduced glucose metabolism in the temporoparietal regions, including the precuneus and the posterior cingulate cortex ( Fig. 15-3 ). Functional frontal lobe involvement is also often reported in AD but usually in conjunction with and characteristically less severe than temporoparietal involvement. Overall hypoperfusion or hypometabolism in early-onset AD is much greater in magnitude and extent than that of late-onset AD, with similar dementia severity. The primary visual and sensorimotor cortices, cerebellum, thalamus, and basal ganglia are relatively spared in AD. FDG PET differentiates patients with MCI from healthy controls. Amnestic MCI typically shows regional hypometabolism consistent with AD, although the magnitude of reduction is milder than that in clinically probable AD cases. Longitudinal studies of patients with MCI found that if the baseline FDG PET scan suggests an AD-like pattern, the probability of clinical progression within several years is extremely high.
Frontotemporal Dementia
FTD is the umbrella term encompassing a group of progressive proteinopathies that are heterogeneous with regard to etiology and neuropathology but share (1) atrophy of the frontal and/or temporal cortex as a morphologic feature and (2) deposition of abnormal ubiquitinated protein inclusions in the cytoplasm and nucleus of neuronal and glial cells as major pathologic constituents. FTD includes three clinical syndromes and three major underlying neuropathologic subtypes. The clinical syndromes, which are distinguished by the early and predominant symptoms, are: a behavioral dysexecutive disorder (behavioral variant [bv]FTD); a language disorder (primary progressive aphasia [PPA] variants); and a motor disorder such as amyotrophic lateral sclerosis (ALS), corticobasal syndrome (CBS), and progressive supranuclear palsy (PSP) syndrome. The neuropathologic subtypes are characterized by an abnormal accumulation of proteins : microtubule-associated protein tau (MAPT), TAR DNA-binding protein (TDP) 43, and fused in sarcoma protein (FUS). FTLD-tau, FTLD-TDP, and FTLD-FUS represent 45%, 50%, and 5% of all FTLD cases, respectively, at postmortem examination.
The designation of probable bvFTD by the revised diagnostic criteria restricts diagnosis to patients with demonstrable functional decline and typical neuroimaging findings, including frontal and/or temporal atrophy, and hypoperfusion or hypometabolism on PET or SPECT.
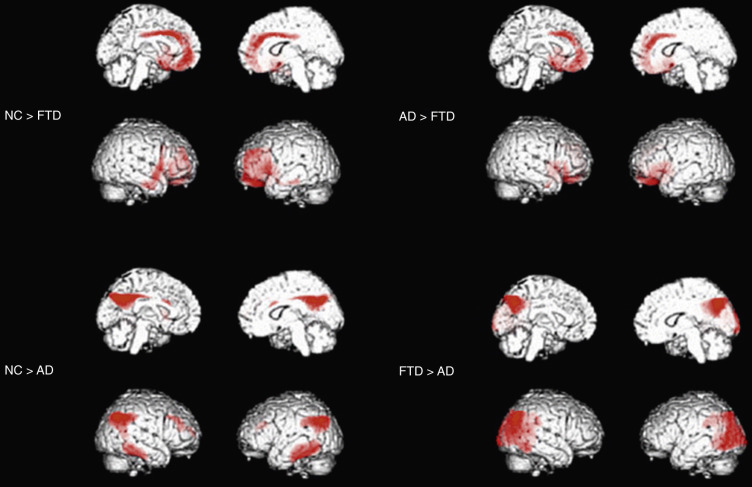
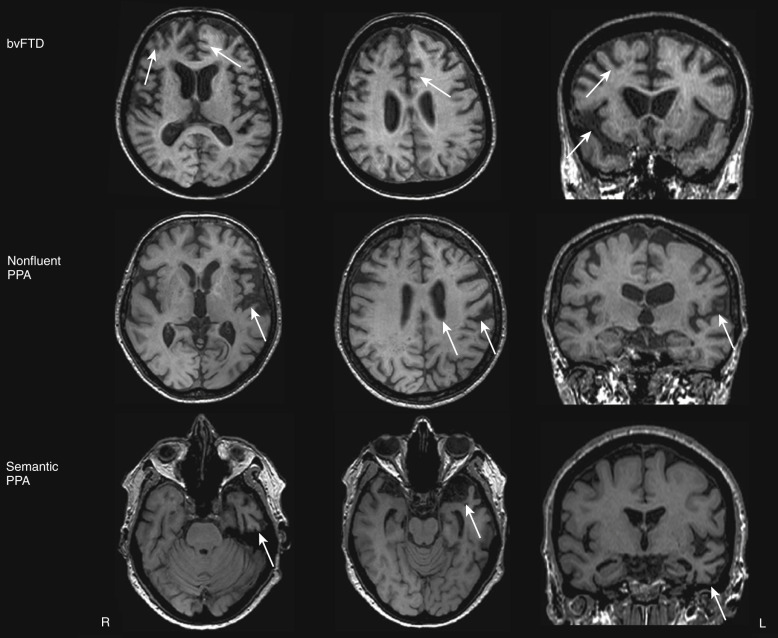
Structural MRI studies showed that classic bvFTD presents with a combination of medial frontal, orbital-insular and anterior temporal cortical atrophy ( Fig. 15-4 ). Such an atrophy pattern can be readily appreciated on coronal T1-weighted MRI scans (knife-edge atrophy) (see Fig. 15-4 ). The MTL is more affected anteriorly (i.e., the amygdala is more affected than the hippocampus and posterior hippocampus often appears normal). Nevertheless, the typical pattern is not necessarily present in all cases, particularly in patients with FTD and motor neuron disease, and the pattern of atrophy in bvFTD varies significantly across different cohorts. In some cases, bvFTD presents with remarkable atrophy of the right anterior temporal lobe and lesser involvement of the frontal regions.
BvFTD is identified on SPECT or PET scans by patterns of hypoperfusion or hypometabolism in frontal, insular, and anterior temporal regions that are typically quite asymmetrically centered into the frontolateral cortex (see Fig. 15-3 ). The regions mostly impaired are the medial frontal cortex, followed by the frontolateral and anterior temporal cortices. The regional pattern of predominantly frontal functional impairment in bvFTD, with relative sparing of posterior brain regions, usually allows a clear distinction between these patients and those with AD (see Fig. 15-3 ).
In patients clinically diagnosed with PPA, who are then divided into clinical variants based on specific speech and language features characteristic for each subtype, an “imaging-supported” diagnosis can be made if the expected pattern of focal atrophy on structural MRI scans or functional involvement on SPECT and FDG is found.
Semantic variant PPA is associated with left anterior temporal atrophy (temporal pole) affecting the lateral and ventral temporal surfaces (see Fig. 15-4 ) as well as particularly the anterior hippocampus, amygdala, and fusiform gyrus. Semantic patients may have left hippocampal atrophy that is at least as severe as that seen in AD patients. In these patients, the hippocampal atrophy is predominantly located anteriorly, with relative preservation of the posterior hippocampal regions. As the disease progresses, the right temporal lobe becomes more involved. The nonfluent PPA variant is associated with a characteristic pattern of left anterior perisylvian atrophy involving inferior, opercular, and insular portions of the frontal lobe (see Fig. 15-4 ). Motor and premotor regions and Broca’s area are also involved. Compared with controls, nonfluent patients also have atrophy of the left hippocampus; however, it is less severe than that in AD patients. In the logopenic PPA variant, the pattern of atrophy primarily affects the left temporoparietal junction, including the left posterior superior and middle temporal gyri, as well as the inferior parietal lobule. Involvement of the left MTL is reported less consistently. Such a posterior temporoparietal pattern of atrophy chiefly discriminates this syndrome from the other subtypes of PPA.
In patients with semantic variant PPA, FDG PET studies showed asymmetric hypometabolism of the temporal lobes, more marked on the left side. A functional deficit of the left frontal opercular regions of the brain has been reported in nonfluent variant PPA patients. In these cases, functional involvement of bilateral caudate nuclei and thalami was also described. Logopenic PPA patients usually show a pattern of left posterior temporoparietal hypometabolism on FDG PET scans.
Dementia with Lewy Bodies
DLB is the second most common type of degenerative dementia, accounting for 10% to 15% of cases. The core clinical features of DLB include fluctuating attention, recurrent visual hallucinations, and spontaneous parkinsonism, as well as cognitive impairment characterized by deficits of attention, executive functions (e.g., planning deficits), and complex visual abilities. Memory deficits are not inevitably present, particularly in the early stages. Fluctuations of cognitive function over minutes, hours, or days are a core feature and affect mainly the level of arousal.
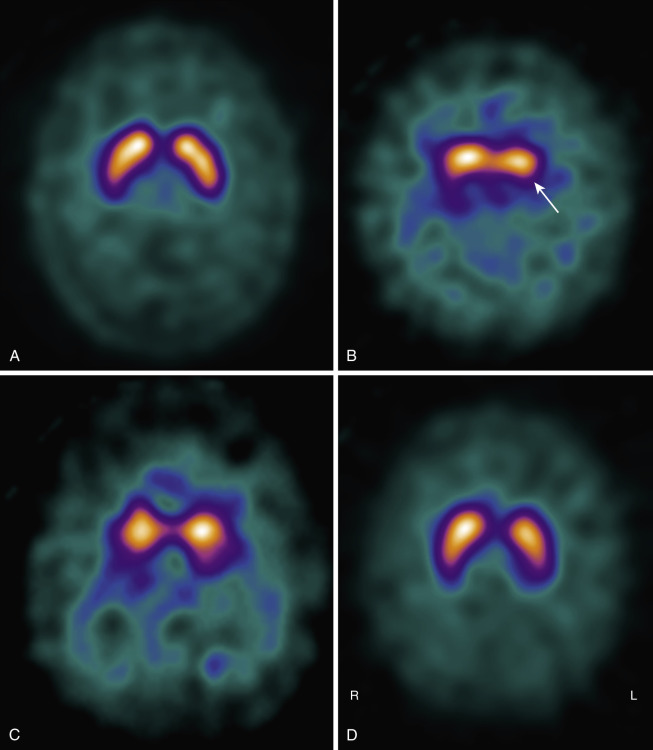
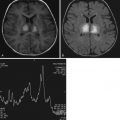
DLB is characterized by nigrostriatal dopaminergic neurodegeneration, making dopaminergic imaging a potentially useful diagnostic tool in the differential diagnosis with AD ( Fig. 15-5 ). Low dopamine transporter uptake in the basal ganglia demonstrated by SPECT or PET has been included as a suggestive feature in the diagnostic criteria for DLB. On the contrary, its negativity does not exclude a clinical diagnosis of probable DLB; about 20% of probable DLB cases have a normal or inconclusive scan.
Numerous studies reported predominant medial occipital cortex hypoperfusion or hypometabolism in DLB patients compared with AD, with a parietotemporal reduction common to both the diseases. Occipital lobe hypometabolism differentiated patients with DLB from AD in both clinically diagnosed and autopsy confirmed cohorts.
No clear signature pattern of cerebral atrophy associated with DLB has been established so far. Similar to AD, a diffuse pattern of global GM atrophy including temporal, parietal, frontal, and insular cortices may occur in DLB, but at the same time a pattern of cortical GM loss restricted to frontal and parietal lobes has also been reported. On the whole, several volumetric studies have not found significant or disproportionate occipital atrophy in DLB. A relatively robust MR finding in DLB is that of a relative preservation of the MTL when compared with AD of similar clinical severity. This finding is supported by a prospective MRI study with pathologic verification that found that MTL atrophy on MRI has a robust discriminatory power for distinguishing AD from DLB (sensitivity of 91% and specificity of 94%). Thus a relative preservation of MTL structures on CT or MRI supports a diagnosis of DLB in the consensus diagnostic criteria. Subcortical structural alterations in terms of putamen atrophy have been described in some cases of DLB relative to AD, whereas no significant atrophy was detected in the caudate nucleus. A pattern of relatively focused atrophy of the midbrain, hypothalamus, and substantia innominata, with relative sparing of the hippocampus and temporoparietal cortex, has been found in DLB compared to AD cases. Whether these findings can contribute to an early diagnosis remains unknown. Furthermore a substantial overlap between DLB and AD with regard to atrophy in these regions detracts from the usefulness of these markers in individual cases.
Creutzfeldt-Jakob Disease
Creutzfeldt-Jakob disease (CJD) is a rare cause of rapidly progressive dementia and is one of several associated neurodegenerative illnesses whose pathogenesis is related to a small, nonviral, 30- to 35-kD proteinaceous infectious particle known as a prion . The loci of pathology involve the cerebral and cerebellar cortices as well as the basal ganglia, where neuronal loss, reactive astrocytosis, and formation of cytoplasmic vacuoles within the glia and neurons give the tissue a characteristic spongiform appearance on light microscopy. The clinical syndrome is typically one of rapid cognitive decline, often with psychosis and delirium. Motor abnormalities of cerebellar dysfunction can appear, and almost all patients show pronounced myoclonus before the final phase of deepening unresponsiveness and coma. The time course of the disease from presentation until death is usually less than 1 year.
Brain MRI, particularly diffusion-weighted imaging (DWI), has become increasingly important in the clinical diagnosis of prion diseases, both excluding nonprion forms of rapidly progressive dementias and demonstrating features considered typical of prion diseases. In sporadic CJD (sCJD), FLAIR and especially DWI sequences show hyperintensity in subcortical GM nuclei (striatum and thalamus) and cortical GM (so-called cortical ribboning) ( Fig. 15-6 ). In addition, increased signal on T2 images is accompanied by restricted diffusion with signal hypointensity on apparent diffusion coefficient (ADC) maps (see Fig. 15-6 ), probably owing to specific histopathologic findings, in particular vacuolation, gliosis, and prion deposition. Because typical vacuoles in sCJD are filled with fluid, it makes sense they would restrict water movement.
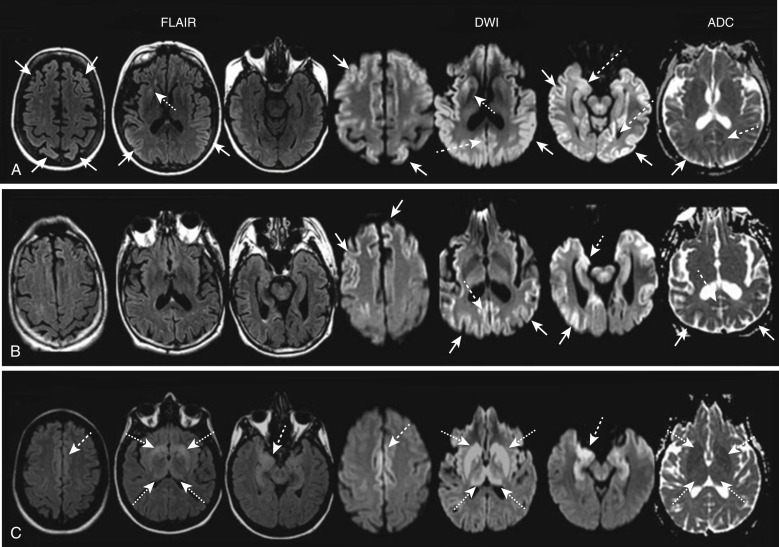
In sCJD, MRI hyperintensities usually present with a typical neuroanatomic pattern of involvement. Three main patterns of GM involvement are recognized on DWI and/or FLAIR images : concomitant cortical and subcortical involvement (≈two thirds of patients); only cortical involvement (<one third); only subcortical involvement (rarely). The cortical ribboning frequently involves both hemispheres, often asymmetrically, especially the cingulate cortex. Other cortical regions frequently involved are the superior and middle frontal gyri, insula, precuneus, angular gyrus, and parahippocampal gyrus, with relative sparing of the precentral gyrus. At a subcortical level, striatal involvement is supportive for sCJD diagnosis, frequently showing an anterior-posterior gradient, with the caudate head and anterior putamen being brighter than the posterior putamen. Thalamic DWI involvement in sCJD is often coupled with bilateral striatal increased signal involving the dorsomedian and posterior (pulvinar) regions. A study evaluating the relationship between DWI alterations and the severity of the clinical course in sCJD suggested that patients showing hyperintensities in both the cortex and basal ganglia experience a significantly shorter interval from disease onset to akinetic mutism than those with only cortical ribbon hyperintensity.
DWI signal changes usually are more evident and earlier in the disease course than T2 or FLAIR hyperintensities, showing focal changes not yet apparent on FLAIR images in up to 20% of cases. In sCJD, DWI has approximate sensitivity and specificity greater than 90%, which are higher than those of current clinically available cerebrospinal fluid (CSF) biomarkers such as 14-3-3, total tau, and neuron-specific enolase. The 2009 European criteria for probable sCJD consider increased signal intensity on FLAIR or DWI as an equivalent diagnostic finding to either elevated CSF 14-3-3 protein or periodic sharp and slow wave complexes on the electroencephalogram. In clinical practice, sCJD is frequently misdiagnosed as other conditions. According to UCSF (University of California, San Francisco) MRI criteria, four MRI features may help differentiate sCJD from nonprion diagnoses : (1) greater hyperintensity on DWI than on FLAIR, (2) subcortical GM hyperintensities on DWI associated with ADC hypointensity (i.e., restricted diffusion), (3) cortical GM involvement usually not isolated to only limbic structures, and (4) a characteristic neuroanatomic pattern of involvement.
The imaging hallmark of variant CJD is a bilateral FLAIR/T2 hyperintensity of the posterior portion of the thalamus (pulvinar), which is brighter than the anterior putamen (pulvinar sign). FLAIR hyperintensity of the dorsomedial thalamic nuclei (“double hockey stick” sign) is also common in vCJD, although this finding is found in other forms of CJD.
Normal-Pressure Hydrocephalus
The term normal-pressure hydrocephalus (NPH) was introduced in 1965 by Adams and Hakim and their colleagues to describe a condition of hydrocephalus presenting with a clinical triad of symptoms (gait instability, mental deterioration, urinary incontinence) associated with ventricular enlargement and normal CSF pressure. Primary (idiopathic) NPH (iNPH) is distinguished from secondary NPH (sNPH), whose common causes are subarachnoid hemorrhage (23%), meningitis (4.5%), and traumatic brain injury (12.5%). A common feature of iNPH and sNPH is that neither involves any obstruction to the flow of CSF within the ventricular system of the brain.
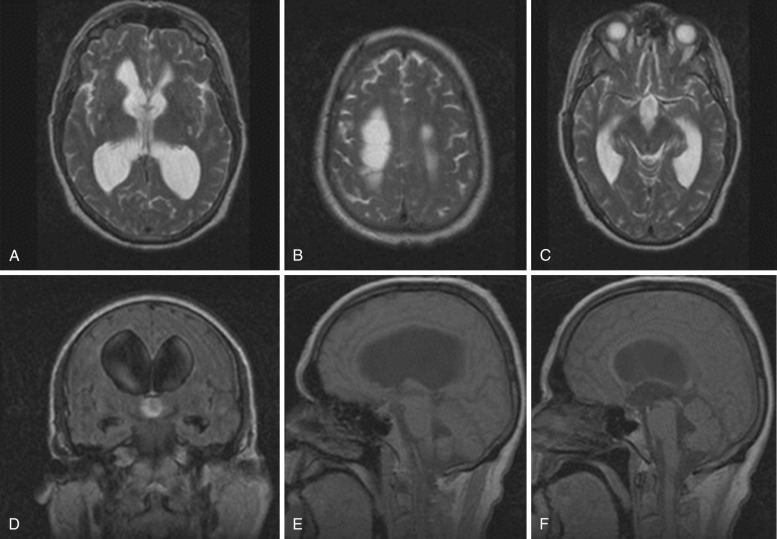
CT or, preferably, MRI is used to evaluate the presence of the cardinal findings in iNPH, which are disproportionate widening of the ventricles in comparison to the cerebral sulci, upward bowing of the corpus callosum or small corpus callosum angle, and dilatation of the temporal horns ( Fig. 15-7 ). Specifically, ventricular widening is defined as an Evan’s index (frontal horns to inner table skull) greater than 0.3. A coronal section at the level of the posterior commissure reveals a narrow subarachnoid space surrounding the outer surface of the brain (a “tight convexity”) and narrow medial cisterns. The third ventricle is usually enlarged as well, while the fourth ventricle may or may not be enlarged. As a result of transependymal CSF diapedesis, iNPH can be associated with periventricular lucencies (i.e., relatively thin, slightly blurry zone of increased signal best seen on T2-weighted or FLAIR images) extending homogeneously around the whole ventricular system, which have to be differentiated from periventricular diffuse, smooth hyperintensities extended to the corona radiata and centrum semiovale due to microvascular disease.
Symptoms can be relieved by ventricular shunting, with the greatest improvement usually seen in gait. The typical patient with iNPH who is likely to respond to a shunt exhibits a significant motor deficit and gait disturbance in the absence of cognitive deficits. Radiologically, absence of WM changes, Evan’s index greater than 0.4, and absence of cortical atrophy have all been associated with good response. Enlargement of temporal horns has been reported as a poor prognostic sign.
White Matter Diseases
MRI is exquisitely sensitive to the detection of WM disease. As in the atrophic changes described in the first part of this chapter, understanding the MRI characteristics and underlying pathophysiology of WM abnormalities can allow one to arrive at the accurate diagnosis. Because this chapter focuses on neurodegenerative diseases, it covers only the limited number of WM diseases that apply to this category.
Vascular Dementia
Vascular dementia is the second most common cause of dementia in older adults, representing 10% to 20% of cases in patients older than 65 years. Clinically these patients may present with sudden cognitive change and a clinical course marked by periods of acute deterioration and spontaneous improvement, often with motor impairment. These patients present radiologically with focally dilated fissures and multiple areas of focal cortical or subcortical volume loss. Multiple subcortical infarcts or single strategic infarcts (e.g., involving parts of the thalamus, caudate, cingulate gyrus, MTL, or internal capsule) can also result in dementia.
Cerebrovascular disease can be detected by CT and structural MRI. Although both modalities perform relatively well in depicting large vessel infarcts, MRI is more sensitive to subtle small vessel vascular changes than CT. T2-weighted and FLAIR sequences are highly sensitive for detecting major strokes as well as small strategic infarcts and small vessel ischemic WM damage. FLAIR performs less well than T2-weighted sequences in detecting thalamic infarcts. Extensive WM changes visible as diffuse hyperintense abnormalities on T2 and FLAIR, predominantly involving the periventricular and deep WM but relatively sparing the U-fibers, are the imaging correlate of Binswanger’s disease. Marked hypointensity on T1-weighted images usually represents tissue destruction in the presence of a complete large vessel infarct, whereas WM changes are usually not prominently hypointense on T1-weighted images. Finally, lacunar infarcts are focal complete infarcts of deep small vessels, which are hyperintense on T2-weighted images and markedly hypointense on T1 and FLAIR images. On FLAIR, lacunae are often surrounded by a hyperintense rim.
According to the NINDS-AIREN (National Institute of Neurological Disorders and Stroke and Association Internationale pour la Recherché et l’Enseignement en Neurosciences) international criteria, structural brain imaging is an essential element for the diagnosis of vascular dementia, and without it vascular dementia will be “possible” at best. In addition the operational radiologic definitions for the NINDS-AIREN criteria provided indications on the topography and severity of vascular lesions. Bilateral infarcts in the area of the anterior cerebral artery, posterior cerebral artery, association areas, or in the watershed regions are thought to be causative of large vessel vascular dementia. Extensive WM lesions involving at least 25% of the WM, or multiple basal ganglia, thalamic, and frontal WM lacunar infarcts, or bilateral thalamic lesions are considered relevant radiologic lesions associated with small vessel vascular dementia. Research criteria to specifically diagnose subcortical ischemic vascular dementia have also been proposed : the presence of extensive periventricular and deep WM lesions and lacunar infarcts in the deep GM, or multiple lacunae in the deep GM and at least moderate WM lesions in the absence of cortical and/or cortical-subcortical (nonlacunar) territorial infarcts, watershed infarcts, hemorrhages, and other specific causes of WM lesions.
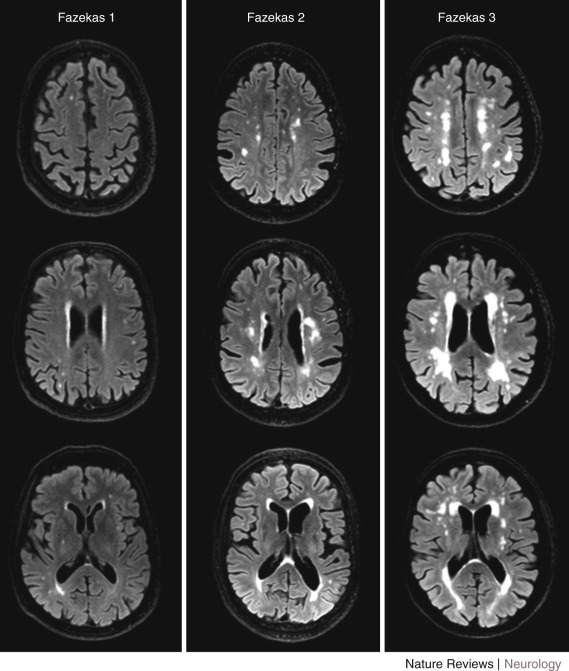
Different methods can be used to measure the extent of WM changes to diagnose subcortical ischemic vascular dementia. Visual rating of WM hyperintensities is relatively easy, and several scales are available with good reproducibility. Widely used visual rating scales include those introduced by Fazekas and Scheltens. The Fazekas scale rates WMHs in the periventricular and subcortical region, combined, on a 0- to 3-point scale. The Scheltens scale rates WMHs separately in the periventricular region on a 0- to 6-point scale and in the subcortical region on a 0- to 24-point scale on the basis of the size and number of lesions. This scale also includes ratings for basal ganglia and infratentorial areas. Figure 15-8 shows examples of brain scans graded according to the Fazekas scale. In addition to these scales, Wahlund and coworkers introduced a scale applicable to both CT and MRI, which is easy to use and compare between modalities.
Related posts:
Stay updated, free articles. Join our Telegram channel

Full access? Get Clinical Tree


