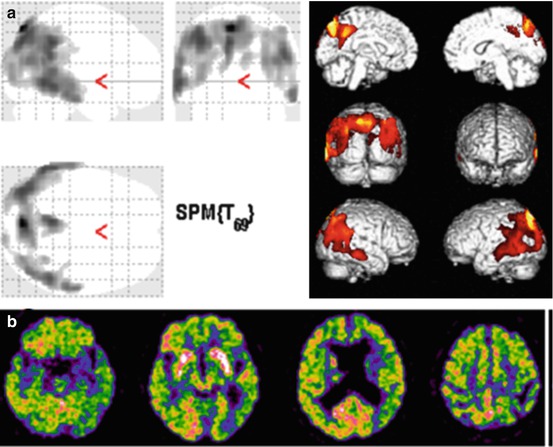
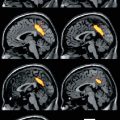
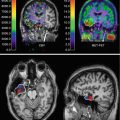
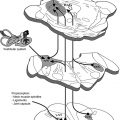
Fig 12.1
Sample of MRI coronal sections showing regional atrophy. Subjective visual rating and linear measurements of the medial temporal lobe atrophy can be assessed on these MR films: (a) absent, (b) minimal, (c) moderate, and (d) severe
Several automatic techniques have been proposed in order to characterize the brain atrophy pattern of AD. While earliest studies focused on volumetric measurements, more complex procedures based on multidimensional approaches have been recently proposed. Most studies in literature follow some general practices for cohort selection: controls, AD and MCI subjects are carefully age and sex matched; typical age ranges from 55 to 90 years. Cohort selection is usually accompanied by either a list of cognitive tests, CSF protein fraction analysis, and genetic data (apolipoprotein E = ApoE, genotype) when available. In addition to the Mini-Mental State Examination (MMSE) score, most used clinical scales include the Clinical Dementia Rating Scale, the Global Deterioration Scale, and the Cognitive Impairment Rating Scale. Frequently, subjects undergo further cognitive tests exploring specific cognitive domains. Inclusion/exclusion criteria are also typically reported. Inclusion criteria are usually based on age and recruitment protocols (such as being newly referred for the assessment of cognitive complaints). Exclusion criteria relates to the presence of pathologies such as diagnosis of dementia of non-AD type or any somatic, psychiatric, or neurological disorder that might have caused the cognitive impairment. In order to provide for statistically significant findings, multicentric studies share clinical protocols and select an adequate number of subjects for each cohort (>100). Research-grade MR scans used in automatic analyses are usually 1.5 T, T1-weighted volumetric images, with nearly cubic voxels and typical slice thickness of approx. 1 mm. The acquisition protocol proposed by Jack et al. (2008a, b) and used in the ADNI study is becoming the de facto standard. To enhance standardization of images across sites and platforms and to minimize acquisition noises, images usually undergo post-acquisition corrections such as gradient nonlinearity and intensity nonuniformity due to uneven receiver coil sensitivity. Other artifacts and general image-quality controls are usually performed either by human readers or by automatic procedures. These include blurring/ghosting, flow artifact, intensity and homogeneity, signal-to-noise ratio (SNR), susceptibility artifacts, and gray-white/cerebrospinal fluid contrast. These processing steps can be performed directly on the MRI console and thus seem feasible in clinical routine. To overcome the influence of interindividual variability, images are processed with registration and intensity normalization steps. In addition, brain regions are further locally aligned, segmented, or aggregated by means of tissue probability atlases, region of interests, and pathology-driven parcellation. These steps are meant to standardize brain volumes, spatially align anatomical regions, and recalibrate gray-level intensity so that images can be compared one to another. Image registration methods are varied, the most common being a 12-parameter affine registration on the Montreal Neurological Institute template and an optional elastic field morphing, such as the diffeomorphic image registration (Ashburner 2007).
Once images are aligned and normalized, there are several possible marker choices, and we can identify two main categories: voxel-intensity and segmentation-driven markers. Under the former category, a non-exhaustive list include direct voxel-by-voxel-intensity comparison, proposed by Klöppel et al. (2008) (this can be computed either on the whole brain or on a volume of interest); tissue map probability of the whole brain (GM, WM, and CSF probability maps) with sequential feature selection/aggregation to reduce dimensionality (Vemuri et al. 2008); atlas-based anatomical region grouping (Magnin et al. 2009), where tissues are parceled into several regions of interest using an automatic anatomical labeling; pathology-driven atlas parcellation; and pathology-driven region-of-interest extraction (Chincarini et al. 2011) (Fig. 12.2). Under the latter category (segmentation) falls cortical thickness measures and the hippocampus segmentation (such as in Lötjönen et al. 2011). Cortical thickness represents a direct index of atrophy and thus it is a potentially powerful candidate to assist in the diagnosis of AD, whereas the hippocampus is known to be affected at the earliest stages of the disease and has been used as a marker of early AD in a vast number of studies. Besides volumetric measures, a marker can also be derived by shape analysis of the segmented anatomical region. Shape analysis is often used in hippocampal measurements to test whether local features are more accurate predictors than global properties such as the volume. For example, the reader is referred to Hua et al. (2009) and Gerardin et al. (2009). In order to summarize the clinically relevant information into a single outcome, intensity- and segmentation-based features are generally further processed through a classifier. A thorough discussion on classifiers is outside the scope of this work, and the reader is referred to Shawe-Taylor and Cristianini (2004) and Breiman (2001).
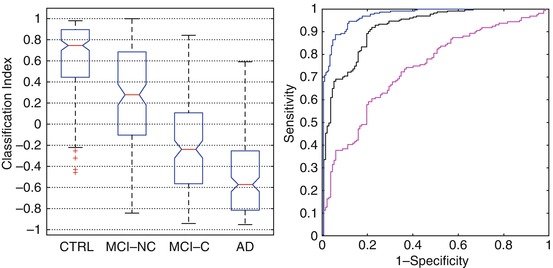

Fig. 12.2
Boxplot representation and ROC curve of a MRI marker based on regional atrophy measure (on the left). The marker provides a classification index for each subject; group comparison is shown for controls versus AD (CTRL/AD), controls versus MCI converters (CTRL/MCI-C), and MCI non-converter versus MCI converter (MCI-NC/MCI-C) cohorts. Boxplot notches represent the 95 % confidence level for the median value (red horizontal line). On the right, the area under the ROC curve for the CTRL/AD is 0.97 (blue line) with a sensitivity ≃89 % and specificity ≃94 %. The performance on the prodromal AD (CTRL/MCI-C) is AUC =0.92 (black line) with a sensitivity ≃89 % and specificity ≃80 %. The performance on MCI-NC/MCI-C gives an AUC = 0.74 (magenta line) with a sensitivity ≃ 72 % and specificity ≃65 % (For interpreting the references in color in this figure legend, the reader is referred to the web version of the paper by Chincarini et al. (2011))
Classifiers are typically trained on controls and AD cohorts and tested on MCI cohorts, while classifier performance on controls and AD cohorts can be estimated via a cross-validation approach. The preferred outcome of a classifier is a number normalized on a limited range (i.e., {−1,1}). While binary classification is also an option, a real, continuous number serves many purposes, from straightforward correlation to other clinical quantities to follow-up measures. Performance is usually assessed by tabulating its sensitivity at a given specificity value or by the area under the ROC curve (AUC), the latter quantification being a direct measure of the discrimination ability between any two cohorts and is typically used to rank the overall performance of the analysis procedure.
12.2.2 Utility in MCI
Image-based markers may be particularly interesting if they show a statistically significant prediction ability for those MCI subjects who will develop AD.
Table 12.1 summarizes some main data on sensitivity and specificity values of structural MRI-based markers (for a thorough comparison and discussion on MRI-based marker and analysis techniques, see Cuingnet et al. (2011)). Even though there are some differences in performance, the ability to predict conversion is still rather limited. Without going into the details of the various method, it seems that a whole-brain analysis does not lead to significantly better results with respect to a localized analysis, restricted to the hippocampal region. Indeed, atrophy is much more widespread only at more advanced stages of AD, so it is reasonable that region analysis can capture the early atrophy signatures as finely as a whole-brain analysis. Overall, structural MRI-based markers seem to be still far from the requirements of sensitivity, specificity, and reliability needed for the clinical assessment of a single subject. Their current usefulness may come into play as a supportive feature in the greater scheme of the diagnosis process or in the case of cohort enrichment for drug trials.
Table 12.1
Sensitivity and specificity values of structural MRI-based markers
Original method reference | Controls/AD | MCI conv/MCI non-conv | ||
|---|---|---|---|---|
Sensitivity (%) | Specificity (%) | Sensitivity (%) | Specificity (%) | |
Klöppel et al. (2008) | 71 | 95 | 43 | 70 |
Vemuri et al. (2008) | 69 | 90 | 57 | 78 |
Fan et al. (2007) | 69 | 81 | 54 | 78 |
Desikan et al. (2006) | 79 | 90 | 27 | 85 |
Chincarini et al. (2011) | 89 | 94 | 72 | 65 |
71 | 77 | 62 | 69 | |
There are studies aimed at overcoming the limitations of structural MRI-based markers. One possible solution is to implement a single-subject longitudinal study (such as in McEvoy et al. 2011). In this framework, several MRI markers can be computed for each subject and for each follow-up scan. Marker value as well as speed can be computed and the combination shows significant improvement over baseline marker performance. While the method is very promising, it might not be feasible in the clinical practice. Another possible improvement over standard MRI markers comes from high-field MR imaging scanners (3 T up to 7 T). The higher resolution and signal-to-noise ratio shown in high-field images should allow an earlier and more precise detection of the incipient atrophy. Histopathological studies at high field (Frisoni et al. 2008; Mueller et al. 2010) suggest that hippocampal subfields may be differently affected by aging, AD, and other diseases. High-resolution images specialize the structural markers to very small anatomical regions and show that compared to controls, AD has smaller volumes of entorhinal cortex, subiculum, CA1, CA1-2, and total hippocampal volumes, while MCI have smaller CA1-2 volumes. A marker based on subregion segmentation shows that CA1-2 would be superior to total hippocampal volume for distinction between controls and MCI. Three Tesla MRI scanners are becoming common tools in the clinical practice thus paving the way to better structural markers in the near future. In addition, the ADNI study phase II shall acquire 3 T MRI images, offering the necessary database for statistically significant findings. Ultrahigh-field MRI is starting to allow the detection of features that are well within the dimensions of the cortical ribbon, an important target for morphometric studies and to enable the identification of anatomical details that before were not visible. For example, structural studies using at 7 T have allowed visualization of laminar structure in several cortical regions including visual and motor cortices and the cerebellum (Duyn et al. 2007; Marques et al. 2010). Within subcortical structures such as the hippocampus, this contrast has allowed anatomical subdivisions (Thomas et al. 2008). In mild AD on images revealing the anatomic landmarks of hippocampal subfields and strata, 7 T imaging permits the identification of thinning of the CA1 apical neuropil compared to controls and no differences in the thickness of the CA1 cell body layer or of the entire CA1 subfield (Kerchner et al. 2010). Ultrahigh-field MRI has also a higher sensitivity for microbleeds, and data obtained at 7 T suggest that the prevalence of microbleeds at MRI in patients with MCI and Alzheimer’s disease (AD) is higher than previously thought, in line with histological studies on its presumed pathological correlate, cerebral amyloid angiopathy (Brundel et al. 2012).
12.2.3 Combined Use of MRI and Other Biomarkers
A combined approach using two or more biomarkers of AD-type neurodegeneration tries to overcome the accuracy limitation of each biomarker. The earliest attempts used together a measure of atrophy on MRI and posterior temporoparietal hypoperfusion on SPECT, showing an increase in overall accuracy in distinguishing between patients with MCI converting to AD dementia and those who do not (El Fakhri et al. 2003). Perfusion SPECT and MRI have been meaningfully used together in patients with incipient AD to highlight the regions of functional depression (i.e., with hypoperfusion but without atrophy) and regions of functional compensation (i.e., with atrophy but without hypoperfusion in the near structures) (Caroli et al. 2010). A similar combined approach has been used with CSF biomarkers. In a recent study, combining MRI and CSF biomarkers gave the best accuracy when distinguishing between MCI versus controls (77.6 %) at baseline. MCI subjects who converted to AD by 12- and 18-month follow-up were accurately predicted at baseline using an AD vs. controls model (82.9 % and 86.4 %, respectively), with lower prediction accuracies for those MCI subjects converting by 24- and 36-month follow-up (75.4 % and 68.0 %, respectively). The overall prediction accuracies for converters and non-converters ranged from 58.6 % to 66.4 % at different time points. Combining MRI and CSF measures in a multivariate model at baseline gave better accuracy for discriminating between MCI and controls and for predicting future conversion from MCI to AD, than using either MRI or CSF separately (Westman et al. 2012). In a study using together MRI automatic measure of hippocampal atrophy and standardized uptake value ratios (SUVR) of amyloid PET imaging with 18F-flutemetamol in 25 healthy volunteers and 20 subjects with aMCI followed up for 2 years, MCI cases had a bimodal distribution of SUVRs. 18F-flutemetamol-positive MCI subjects showed a large variability in hippocampus volumes, indicating that these subjects were in different stages of neurodegeneration. Some 18F-flutemetamol-negative MCI scans had hippocampus volumes that were well below the range of controls. Clinical follow-up showed that eight of nine MCI to AD converters came from the 18F-flutemetamol-positive group. The authors conclude that combining 18F-flutemetamol PET with structural MRI provides additional information for categorizing disease and potentially predicting shorter time to progression from MCI to AD, although these findings obtained in small groups have to be validated in larger longitudinal studies (Thurfjell et al. 2012). Using a linear support vector machine to evaluate the classification accuracy of CSF biomarkers, FDG-PET and MRI biomarkers in distinguishing between MCI and controls, a classification accuracy of 76.4 % (with a sensitivity of 81.8 % and a specificity of 66 %) was achieved in a ADNI group with combination of biomarkers, as compared to only 72 % even using the best individual modality of biomarkers. Further analysis on MCI sensitivity of the combined method indicates that 91.5 % of MCI converters and 73.4 % of MCI non-converters were correctly classified (Zhang et al. 2011).
12.3 Functional MRI and Diffusion Tensor Imaging
12.3.1 Blood-Oxygen-Level-Dependent (BOLD) Functional MRI (fMRI) Principles
BOLD enables the assessment of hemodynamic changes associated with regional brain activity during a task (e.g., a motor or a cognitive task). Hemoglobin (Hb) in erythrocytes delivers oxygen to neurons. When neurons are activated, there is an increased demand for oxygen, eliciting an increase of rCBF to the brain regions involved in neural activity. Hb is diamagnetic when oxygenated, while it is paramagnetic when deoxygenated. This difference in magnetic properties is associated with small differences in the magnetic resonance signal of blood, depending on the degree of oxygenation. Since blood oxygenation changes according to the neural activity, these differences can be used to explore brain activity. A detailed description of the neurophysiological basis of BOLD signal can be found in Logothetis (2002).
12.3.2 Utility in MCI
Performing fMRI studies in patients with cognitive impairment can be challenging. Even small amounts of head motion may compromise fMRI data quality. Differences in task performance between patient and control groups make the interpretation of data difficult (Price and Friston 1999). Associated pathology (e.g., vascular pathology) can complicate the identification of the source of BOLD signal modifications (D’Esposito et al. 2003). Since the loss of mnemonic abilities is a key clinical feature of MCI and AD, anatomical regions and networks involved in memory have been explored by fMRI with appropriate tasks. Functional MRI has been utilized in normal subjects to investigate brain activity in memory processes in order to comprehend how neural activation differs, in memory tasks, for subsequently remembered and subsequently forgotten experiences. Successful retrieval of information is associated with fMRI evidence of activation in the MTL, prefrontal cortex, and ventral temporal cortex (Wagner et al. 1998; Kirchhoff et al. 2000; Brewer et al. 1998). Moreover, fMRI studies have demonstrated a brain network that “deactivates” during successful memory formation (Daselaar et al. 2004). These data evoke a theoretical model of memory formation that requires activation of the hippocampal nodes and concomitant deactivation of the retrosplenial–parietal nodes to function. Functional MRI studies in MCI report different, and apparently conflicting, results when evaluating task-related BOLD signal changes. Johnson et al. (2004) demonstrated that MCI patients behave differently than controls in a paradigm of repetitive presentation of faces. In fact, subjects with MCI do not show a pattern of decreasing hippocampal activation with face repetition that characterizes controls. A number of studies have found a reduced MTL and posterior cingulate activation in MCI with respect to controls (Johnson et al. 2006; Machulda et al. 2003). Interestingly, other studies have found greater MTL activation in MCI with respect to controls, for instance, in an associative face–name encoding paradigm (Dickerson et al. 2005) or in an associative encoding of novel picture–word pairs task (Hämäläinen et al. 2007). It seems that heterogeneity in patients’ selection and methodological aspects cannot completely explain this variability in fMRI studies results. In fact, many authors hypothesize that there is a phase of increased MTL activation early in the course of MCI, most likely representing a compensatory response to AD pathology. Beyond this phase, as the disease progresses, there is a decrease in functional activation. This “compensatory” hypothesis is supported by data derived from studies in cognitively intact ApoE-epsilon4 allele carriers (Bookheimer et al. 2000). Dickerson and coworkers suggest that MTL hyperactivation could be useful to predict MCI to AD progression. They report in a study on 25 MCI subjects with a follow-up of more than 5 years that the degree of cognitive decline was predicted by hippocampal activation at the time of baseline scanning, with greater hippocampal activation predicting greater decline. This finding was controlled for baseline degree of impairment, age, education, and hippocampal volume, all variables that should be taken into account as they can modify the degree of functional activations (Miller et al. 2008). However, correct interpretation of fMRI hyperactivation with respect to particular brain regions and behavioral conditions is not always straightforward and might indeed pose interpretation problems. Considering a theoretical model with an “inverse U-curve” of fMRI activation along the course of the disease, hyperactivation can be detected in the setting of minimal clinical impairment (and relatively little MTL atrophy) in the upgoing phase along the curve, while the same level of hyperactivation in the setting of more prominent clinical and memory impairment and MTL atrophy would be consistent with the downgoing phase of the curve.
Thus, the same degree of fMRI hyperactivation may be associated with different biological stages of disease. Brain activation at fMRI may also be affected by cognitive training. Mnemonic strategies, frequently used as part of cognitive rehabilitation programs, are effective in some patient populations (Cicerone et al. 2011) and result in increased prefrontal (Kondo et al. 2005; Miotto et al. 2006) and hippocampal activity (Nyberg et al. 2003) in healthy participants. Some authors (Hampstead et al. 2011; Belleville et al. 2011) have reported increased prefrontal activity accompanying behavioral improvement after cognitive training in MCI patients and a facilitation of hippocampal function (Hampstead et al. 2012).
More recently, the attention of researchers has turned to the use of resting-state fMRI (rs-fMRI) and to the study of “default mode” activity in people with MCI and AD. This fMRI modality has some advantages, particularly in the study of individuals with more severe cognitive impairment who may have difficulties performing a given task. Studies examining rs-fMRI data have found low-frequency fluctuations of the measured cerebral hemodynamic that exhibit high temporal coherence between spatially distinct but functionally related regions (Biswal et al. 1995). Different researchers have theorized that these signal variations, temporally correlated across the brain, correspond to functional resting-state networks that together characterize the neuronal baseline activity of the human brain in the absence of stimulated neuronal activity. The coherent resting fluctuations that have been identified include functionally relevant networks involved in motor function, visual processing, executive functioning, auditory processing, memory, and the DMN. The DMN is composed of the bilateral parietal cortex, the precuneus and posterior cingulate cortex, the anterior cingulate cortex, the medial prefrontal cortex, the hippocampus, and the thalamus. This network is active during resting state but has a decrease in its activity during the performance of cognitive tasks, which indicates that the DMN is fundamental for modulating cognitive processing. The existence of a brain DMN is also supported by PET studies (Raichle et al. 2001), and simultaneously acquired EEG and fMRI data under rest demonstrate a variation in alpha rhythm in EEG correlating with the fMRI measurements, with an increase in alpha power that correlates with decreased BOLD signal in multiple regions of occipital, superior temporal, inferior frontal, and cingulate cortex, and with increased signal in the thalamus and insula (Goldman et al. 2002). These results suggest a neuronal cause for these fluctuations in the resting-state networks. Alternatively, it has been proposed that these fluctuations simply reflect vascular processes unrelated to neuronal function (Obrig et al. 2000; Wise et al. 2004). At an early stage of AD and MCI, functional connectivity between structures belonging to the DMN has been reported to be disrupted (Greicius et al. 2004; He et al. 2007; Sorg et al. 2007; Wang et al. 2006, 2007; Zhang et al. 2009, 2010).
Finally, better spatial resolution achieved thanks to ultrahigh-field devices in fMRI studies with voxel dimensions below the cortical thickness are starting to allow the resolution of column and layer specific signals (Yacoub et al. 2008; Polimeni et al. 2010). Also anatomical applications greatly benefit from increased spatial resolution.
In conclusion, besides unsurprising hypoactivation of brain regions associated with progression of neuropathological changes, fMRI studies have also identified areas of hyperactivation in brain regions belonging to memory and cognitive circuits, possibly representing attempted compensatory activity. More recently, fMRI data, also using rs-fMRI data, are beginning to reveal relationships between abnormalities of functional activity in the MTL memory system and in functionally connected brain regions, such as the precuneus, adding to our understanding of the functional anatomic brain circuits and their involvement as the disease progresses.
12.3.3 Diffusion Tensor Imaging (DTI) Principles
DTI is a quantitative MRI modality that measures water diffusion properties noninvasively and that has evolved as a powerful technology to probe central nervous system microstructure. It is highly sensitive to subtle structural changes in brain tissue, given the diffusion anisotropy characterizing white matter (i.e., in normal white matter, diffusion is not identical in all directions, but, for a given diffusion time, displacement of water molecules is on average greater along the length of axons, than across the axons) (Basser et al. 1994; Moseley et al. 1990). Several DTI-derived metrics can be obtained, among which are fractional anisotropy (FA) (Beaulieu 2002; Pierpaoli et al. 1996), mean diffusivity (MD), and parallel (i.e., axial diffusivity, DA) and perpendicular diffusivity (i.e., radial diffusivity, RD). In general, a decrease in anisotropy is considered a marker of white matter integrity loss. Anisotropy can be reduced due to a decrease in parallel diffusivity and an increase in perpendicular diffusivity or some combination of these parameters. Even though inferring the histological contributors of anisotropy changes is not straightforward, experimental studies have shed some light on the biological basis of the different DTI-derived parameters; for instance, decreases in DA have been correlated with axonal loss, whereas increases in RD would indicate loss of myelin (Song et al. 2002, 2003). The diffusion measurements obtained in a DTI acquisition can be analyzed using different approaches. Among them, region-of-interest (ROI) analysis and voxel-based methods have been used in the study of MCI. Moreover, DTI can be used to isolate white matter pathways in vivo and thus enables diffusion measurements along a given anatomical structure. We can thus, for instance, use DTI to obtain measurements within the voxels estimated to belong to a white matter bundle of interest.
The ROI analysis is one of the most utilized methodologies. It entails the identification of an anatomical region, which is outlined using dedicated software tools. DTI parameters, such as FA, are then quantified within the selected region from the corresponding parametric image. Researchers can identify and draw ROIs on the non-diffusion-weighted (b = 0) images or MRI images with different weightings (e.g., high-resolution T1-weighted images). In this latter case, the images utilized to identify the ROIs have to be co-registered to the DTI maps in order to obtain the measurements within the ROI. The ROI analysis can be utilized in studies with a priori hypotheses and information from anatomical regions that are not selected is obviously lost. From a technical point of view, there are some potential pitfalls related to this method. For instance, the placement of a ROI is a subjective process associated with variable reproducibility. Reproducibility of ROIs repositioning is particularly important in longitudinal studies. Moreover, voxel contamination from gray matter or cerebrospinal fluid can confound the results by including tissue types with different biophysical properties in the same ROI, resulting in false DTI measurements. This issue can be particularly relevant in MCI (and AD) studies where investigated brain structures suffer from atrophic changes. Many studies of MCI have utilized this approach and a recent review well summarizes them (Sexton et al. 2011).
Voxel-based methods can be applied to DTI images. To this end, each subject FA image is warped into a standard space and then voxel-wise statistics are utilized to identify areas correlating with the covariate of interest (e.g., MCI versus controls). These approaches, allowing the unbiased investigation of the whole brain still maintaining anatomical identification of significant voxels, pose complex methodological challenges (for instance, related to the accuracy of registration algorithms). Among the most recent tools for voxel-wise DTI analysis, we mention tract-based spatial statistics (TBSS) (Smith et al. 2006). In most recent years, there has been great interest in whole-brain voxel-wise studies (Medina et al. 2006; Douaud et al. 2011; Liu et al. 2011).
The use of different methodologies accounts for the heterogeneous findings reported in different studies. Nonetheless, even studies that use the same methods of DTI data analysis may be difficult to compare. In fact, patients’ characteristics may vary among studies; DTI acquisition parameters are often very different (the technical details of DTI are beyond the scope of this chapter, but many acquisition parameters such as “b” values and acquisition matrix can be dissimilar among studies). Also when comparing “significant” findings among different studies, it must be noted that different statistical approaches can be utilized and when comparing results from multiple ROIs, for example, more or less “liberal” statistical analysis will lead to different results (Sexton et al. 2011). These challenges need to be solved before DTI can find an established role in the clinical arena.
12.3.4 Utility in MCI
Researchers using DTI have without doubts contributed to amplify the interest on white matter (WM) pathology in MCI (and AD) and added information to the debate on the relevance of WM pathology and on its pathogenesis. The most important question is whether WM pathological changes are related to gray matter (GM) pathology or not. According to one theory, WM pathology occurs as a consequence of GM pathology that first involves the hippocampus and the entorhinal cortex and then progresses to temporal and parietal association cortex. Thus, WM microstructural damage would be the result of secondary degeneration. Other researchers hypothesize that WM pathology would be independent from GM one and would follow the myelogenesis pattern in a reverse order; according to this “retrogenesis” hypothesis, myelin breakdown would start in small diameter, early myelinating tracts (Bartzokis 2004). Vascular changes may also contribute to WM pathology (Brun and Englund 1986). DTI studies can be useful to better understand the relationship between GM and WM changes. For instance, in an interesting study on AD patients, Sydykova et al. (2007) found a significant regional correlation between FA within the corpus callosum and GM thickness in the lobes these fibers connect. The authors conclude that decline of FA in the corpus callosum may be related to neuronal degeneration in corresponding cortical areas. Nevertheless, in the published DTI studies, there is no overall consensus, with some studies supporting secondary degeneration and others supporting primary myelin pathology.
DTI studies have extensively showed, in vivo, the presence of WM changes in MCI patients with respect to control subjects. At first, studies using regional approaches reported changes in MD and anisotropy in the MTL, especially within the hippocampal formation (Kantarci et al. 2001; Wang and Su 2006), and higher baseline hippocampal MD has been reported useful in identifying patients with MCI who will progress to AD (Fellgiebel et al. 2006; Kantarci et al. 2005). Other anatomical locations have then been assessed. Using multiple ROIs, Zhang et al. (2007) identified the posterior cingulate, at the apex of the posterior curve of the tract, as the region most suitable in discerning between healthy controls and MCI or AD. In this study, MTL volume was only 63 % accurate for discriminating between healthy controls and subjects who have MCI, but accuracy increased to 78 % with the information derived from left posterior cingulate FA. In a larger study, Chua et al. reported microstructural alterations in aMCI individuals in the parahippocampal WM, frontal WM, splenium of corpus callosum, and posterior cingulate region. In naMCI subjects, DTI data analysis demonstrated microstructural pathology in the frontal WM, internal capsule, occipital WM, and the posterior cingulate region (Chua et al. 2009).
As we already remarked, the ROI methodology is unable to reveal the global pattern of WM changes in MCI. Voxel-based approaches can be utilized to overcome this limitation (Smith et al. 2006). Using TBSS, O’Dwyer et al. (2011) studied 19 naMCI and 14 aMCI subjects. They found significantly higher DA in naMCI subjects compared to healthy controls in the right posterior cingulum/precuneus. They also found significantly higher DA in aMCI subjects compared to healthy controls in the left prefrontal cortex, particularly in the forceps minor and uncinate fasciculus. In a study of 96 aMCI and 69 naMCI subjects, Zhuang et al. (2010) found a decrease in FA in the frontal, temporal, parietal, and occipital WM, together with an involvement of several commissural, association, and projection fibers in aMCI subjects. The best discrimination between aMCI and controls was achieved by combining FA measures of the splenium of corpus callosum and crus of fornix, with accuracy of 74.8 %. For naMCI subjects, the authors found anatomically widespread WM abnormalities but also a relative sparing of the temporal lobe WM. Wang and Su (2006) compared 28 adults with MCI, 29 adults with cognitive complaints but without psychometric impairment, and 35 healthy controls using DTI acquisitions and TBSS analysis. They reported lower FA and higher radial diffusivity in the MCI group with respect to controls in bilateral parahippocampal WM. An example of DTI findings in a patient with aMCI is reported in Fig. 12.3.
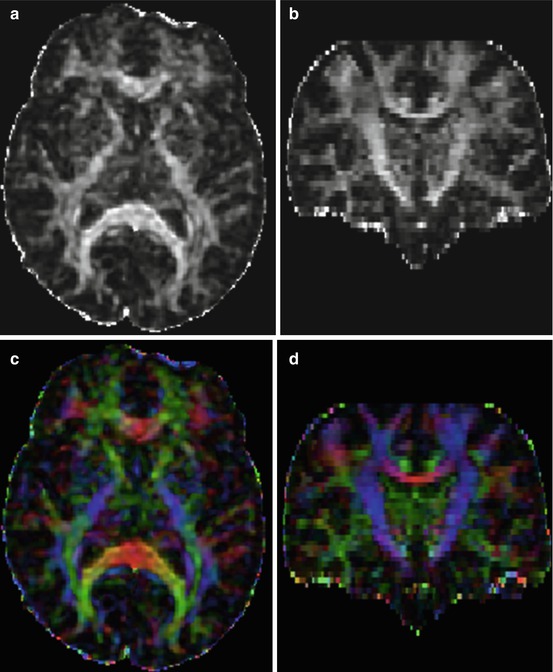

Fig. 12.3
Diffusion tensor imaging (DTI) acquisition in a 75-year-old female patient with MCI. Images (a, b) are axial and coronal reformats of fractional anisotropy (FA) maps, respectively. Image intensity reveals differences in anisotropy across different anatomical regions. (c, d) are color-coded maps. In color-coded maps, the principal direction of diffusion can be associated with the underlying white matter bundle orientation. The color red, for example, can be used to indicate diffusion along the left/right axis, green for diffusion along the anterior/posterior axis, and blue for diffusion along the superior/inferior axis (e.g., superior to inferior direction of corticospinal tracts can be seen in blue)
In conclusion, DTI studies indicate a pathological involvement of WM in MCI. The nature of these pathological changes, primary or secondary, is still matter of debate.
12.3.5 Combined Use of DTI and Other Biomarkers
Some studies are appearing dealing with the combined use of DTI and other biomarkers. In one such study (Bozoki et al. 2012) in MCI patients, AD patients, and controls, the authors found that in the combined MCI–AD cohort, posterior cingulate cortex (PCC) metabolism directly correlated with both FA and volume of the descending cingulum. Thus, disconnection of the PCC from MTL at the cingulum bundle contributes to PCC hypometabolism during incipient AD. In a combination study with DTI and CSF biomarkers in patients with MCI and subjects with subjective memory complaints versus controls, significantly lower FA and higher radial diffusivity (DR) values were observed in patients with pathologically high versus patients with normal CSF total tau levels and versus controls in left posterior cingulum fibers. Total tau values were negatively correlated with FA and positively correlated with DR values in the posterior cingulum fibers. Cingulum fiber diffusivity was related to T-tau pathology in SCI/MCI patients and altered DR may suggest that loss of myelin contributes to early white matter changes in patients at risk of developing AD (Stenset et al. 2011).
12.4 SPECT
12.4.1 Principles
Brain SPECT is commonly performed by means of injection of 99mTc radiopharmaceuticals, including hexamethylpropylene amine oxime (HMPAO) and ethylcysteinate dimer (ECD). Mainly in Japan, 123I-iodoamphetamine (IMP) is also used. Technology is widely available, as general-purpose gamma cameras equipped with two- or three-head detectors and low-energy, high-resolution collimators are used. The brain-dedicated cameras and the fan-beam collimators, both yielding a higher spatial resolution, are however less widely available. Reconstruction algorithms of bidimensional projections allow tridimensional imaging with satisfying (i.e., 6–8 mm) spatial resolution. Injection, acquisition, and reconstruction protocols are crucial for obtaining reliable imaging and should follow the guidelines of the American Society (Juni et al. 2009) and of the European Association (Kapucu et al. 2009) of Nuclear Medicine. It should be underlined that although the term “rCBF” is often used to report SPECT findings, what is actually measured is the nonquantitative distribution of a perfusion tracer within the brain, thus it is more correct to refer to it as “brain perfusion” rather than rCBF, which should instead be reserved to “quantitative” measures, as obtained by means of 133Xe SPECT or H2 15O PET techniques.
12.4.2 Utility in MCI
Sites of hypoperfusion in aMCI patients closely follow those highlighted by FDG-PET, although the two modalities actually measure different parameters. However, the studies undertaken by Magistretti’s group have revealed that both FDG and SPECT tracers show an image of the brain by tracking the function of astrocytes that are closely connected to synaptic neurotransmission (Magistretti 2000). Therefore, the resulting imaging is similar, although with some differences, mainly between 99mTc-ECD and 99mTc-HMPAO (Koulibaly et al. 2003).
Patients with aMCI often show hypoperfusion in the associative portion of the parietal lobe, in the posterolateral part of the temporal lobe, and in the precuneus (Borroni et al. 2006; Encinas et al. 2003; Hirao et al. 2005; Høgh et al. 2004) (Fig. 12.4). Perfusion reduction in the posterior cingulate has been reported less frequently in MCI patients, mainly by studies using 99mTc-HMPAO (Huang et al. 2003; Johnson et al. 2007) or 123I-iodoamphetamine (Ishiwata et al. 2006), whereas studies using 99mTc-ECD often fail to demonstrate posterior cingulate hypoperfusion (Borroni et al. 2006; Encinas et al. 2003; Nobili et al. 2008a, b). Hypoperfusion in lateral frontal association cortex is often milder and becomes clearer when AD dementia develops. SPECT images are often asymmetric at the aMCI stages of AD, and asymmetries tend to be reflected by “asymmetric” neuropsychological impairment, with language disturbances predominating in left hemisphere impairment and visuospatial disturbances in right hemisphere impairment. Another source of strong variability comes from age at onset of AD, as in presenile cases neocortical (i.e., posterior temporal–parietal) impairment predominates, whereas in senile cases, medial temporal lobe dysfunction is more evident than neocortical impairment. Again, neuropsychological profiles parallel imaging findings, because presenile cases show a neocortical presentation with combination of the triad aphasia–apraxia–agnosia and a relatively spared memory, while the opposite happens in senile onset. Genetic traits also have their impact on brain perfusion pattern. Those aMCI patients carrying at least one ε4 allele of the gene for apolipoprotein E (ApoE) have more profound hypoperfusion than severity-matched aMCI patients without ε4 alleles.


Fig. 12.4
Perfusion SPECT (99mTc-HMPAO) showed in three transaxial sections in an 82-year-old woman (15 years of full education) with aMCI. The Mini-Mental State Examination score is 27/30. The patient maintains autonomy in everyday life activities and lives alone. The scan shows reduced tracer uptake in the medial temporal lobe (on left), lateral temporal cortex (middle), and posterior cingulate cortex (right) in the right hemisphere
When baseline SPECT was evaluated in subjects with MCI with a 2-year follow-up, hippocampal perfusion was able to predict conversion to AD dementia in comparison to non-converters, while perfusion in inferior parietal lobule was lower in converters and in MCI patients showing cognitive worsening with time as compared to stable MCI patients. There was a statistically significant correlation between either baseline hippocampal or parietal perfusion and verbal delayed recall score at follow-up. Receiver operating characteristic (ROC) curves for hippocampal perfusion showed 0.81 sensitivity with 0.86 specificity in separation of converters from non-converters. Thus, baseline SPECT can support outcome prediction in subjects with MCI (Nobili et al. 2009).
The phenomenon of functional compensation in aMCI has been investigated by means of perfusion SPECT and co-registered MRI. Relatively preserved perfusion was found in the posterior cingulate, in the head of the hippocampus, in the amygdala, and in the insula bilaterally, while functional depression occurred in bilateral parahippocampal gyri. Functional compensation has been hypothesized to be compensatory in the setting of neuronal loss, helping to understand the reactive phenomena induced by the brain to try and counteract the pathological changes of AD (Caroli et al. 2010).
SPECT literature is much more limited in naMCI patients. In one study, perfusion values of naMCI patients often fell between the aMCI group and either controls or subjects with subjective cognitive impairment and reached statistical significance in the bilateral temporal cortex compared to CTR (Nobili et al. 2008a, b). Moreover, perfusion levels were the lowest in naMCI patients among all the other groups at the right frontal cortex, reaching statistical significance in comparison to subjects with subjective cognitive complaints. In the quoted study, naMCI patients had a high prevalence of arterial hypertension, depression, and white matter hyperintensities (WMHs) on MRI, suggesting that either a vascular etiology or depression may underlie cognitive impairment in naMCI group. In fact, WMHs have been reported to be associated with executive dysfunction in MCI (Reed et al. 2004), which are driven especially by the activity of the dorsolateral prefrontal cortex. Moreover, frontal hypoperfusion has been reported in depression, regardless of the presence of WMH (Oda et al. 2003). Hypertension is the most frequent underlying mechanism for chronic hypoperfusion and WMH, and it is characterized by reduced rCBF, especially in frontal and temporal areas (Rodriguez et al. 1987).
Concerning advantages and disadvantages of SPECT versus FDG-PET, this issue has been debated for a long time but it has become clear that FDG-PET can pick up subtle abnormalities especially in MCI patients, thanks to its higher spatial resolution. Apart from selected cases of MCI due to vascular disease where perfusion SPECT can be more informative, because glucose metabolism can be spared, FDG-PET is generally preferable if available. Costs of PET are higher if the FDG is bought from an external supplier but may be lower if it is produced in-house. Pros and cons of SPECT and PET have been deeply analyzed and discussed in ad hoc reviews (Ishii and Minoshima 2005; Pupi and Nobili 2005).
12.4.3 Combined Use of SPECT and Other Biomarkers
Besides the already quoted study by El Fahkri et al. (2003) who employed SPECT and MRI in combination (see Sect. 2.3), a correlation study was conducted in a pooled population of control subjects, patients with MCI and patients with mild AD, showing no significant correlation between Abeta 1-42 concentrations and brain perfusion and a significant correlation between either T-tau or P-tau concentrations and brain perfusion in the left parietal cortex (Habert et al. 2010). Thus, perfusion SPECT appears as a marker of neurodegeneration, in agreement with tau CSF level.
12.5 18F-FDG-PET
12.5.1 Principles
Among the functional neuroimaging techniques able to assess functional abnormalities in central nervous system disorders, 18F-FDG-PET has the unique ability to estimate the local cerebral metabolic rate of glucose consumption (CMRgl), thus providing information on the distribution of neuronal death and synapse dysfunction in vivo (Herholz 2003). In fact, glucose enters the neuron–astrocyte functional unit where it is phosphorylated by a hexokinase, which is the first pivotal step of that metabolic pathway. Active energy production takes place at the synaptic terminals via the tricarboxylic acid pathway, requiring oxygen and leading to high ATP availability (aerobic glycolysis). On turn, astrocytes mainly utilize anaerobic glycolysis which gives much less energy but is faster. For these reasons, glucose metabolism has been shown to be closely coupled to neuronal function at rest and during functional activation (Magistretti 2000). By performing 18F-FDG-PET at rest, glucose uptake distribution is mainly driven by basal neuronal activity and represents general neuronal integrity (Herholz 2003). For a tissue unit, reduced glucose uptake essentially stands for either a reduction in number of synapses or a reduced synaptic metabolic activity and although the specific molecular mechanisms of neuronal activity that are coupled to energy metabolism have not been exactly identified, it seems that much of the glucose metabolism measured by PET is coupled to glutamate-driven astrocytic glucose uptake (Magistretti et al. 1999; Mosconi 2005). 18F-FDG-PET has a very low temporal resolution as radiolabeled glucose brain uptake takes about 20 min. During this time, any condition that affects the “psychosensorial resting” of the subject may significantly alter the results of scan. Besides sensorial stimulation and speech, which must be avoided, vigilance and anxiety are among the most relevant variables that can be hardly controlled. Guenther et al. (2011) reported a significant negative correlation between vigilance measures and FDG metabolism in bilateral frontal and temporal regions, bilateral cingulate gyrus, and right thalamus. Simultaneous EEG recording during glucose brain uptake has revealed that brain regions associated with EEG vigilance partly overlapped with regions of impaired FDG metabolism in depression and MCI. Thus, differences in vigilance might influence scan results, and whether vigilance needs to be taken into account for routine diagnostic application of 18F-FDG-PET has to be decided by further studies.
12.5.2 Utility in MCI
In the last 30 years, AD and dementia of other types have been extensively studied with 18F-FDG-PET (Mosconi 2005; Salmon et al. 2009), and more recently, PET-based diagnostic effort has moved to the early stages of dementia and to MCI with the specific aim to identify patients affected by AD in the prodromal phase (Anchisi et al. 2005; Nobili et al. 2008a, b). FDG-PET plays a major clinical role in this context by showing (or not showing) specific disease patterns. When a typical single- or multi-domain aMCI patient with a clinical suspicion of AD undergoes 18F-FDG-PET and thus he/she has a high pretest probability to show typical brain metabolic abnormalities, the positive predictive value of 18F-FDG-PET is higher than 90 %. In fact, in the resting state, brain metabolism is abnormally lower in typical sites of the association cortex in early AD patients as compared with matched normal subjects (Fig. 12.5a). Hypometabolism can be found in posterior parietotemporal cortex, lateral occipital cortex, precuneus, and PCC (Mosconi 2005; Nobili et al. 2008a, b; Morbelli et al. 2010) in various combinations in the individual cases. In particular, PCC hypometabolism is among the most common findings in FDG-PET studies of early AD (Minoshima et al. 1997). On the opposite, while several observations suggest that early hippocampal structural brain damage of AD is coupled with hypofunction and specifically reduced brain glucose metabolism, PET-assessed hippocampal hypometabolism is often not reported probably due both to the limited resolution of the first-generation PET equipments and, particularly, to the use of the statistical parametric mapping (SPM) analysis method (Mosconi 2005). It has been thus hypothesized that decreased PCC activity in prodromal AD reflects decreased connectivity especially with entorhinal cortex and hippocampus, which are among the first regions targeted by AD pathology (Meguro et al. 1999). An in vivo confirmation to the concept of metabolic disconnection of medial temporal cortex in early AD dementia was recently given by the evidence of lacking functional/metabolic connectivity between hippocampus and PC in prodromal AD even in the absence of specific hippocampal hypometabolism (Morbelli et al. 2012). In the clinical setting, a different reorientation, the so-called Ohnishi transaxial plane (i.e., about 30° with the nose upward with respect to the bicommissural plane; Ohnishi et al. 1995), has been successfully proposed for SPECT to analyze transaxial slices, in order to overcome the abovementioned issues in the evaluation of hippocampal hypometabolism. In fact, the bicommissural plane is inadequate to segment the hippocampus that indeed is not parallel to it. This tool is appropriate for 18F-FDG-PET as well.

