Acknowledgments
VG has received funding from the Swiss National Science Foundation (project n. 185028, 188355 and 169876), the Velux Foundation, the Schmidheiny Foundation and research/teaching support through her institution from Siemens Healthineers, GE Healthcare, Roche, Merck, Cerveau Technologies and Life Molecular Imaging.
Introduction
Neurologic disorders encompass a wide range of pathologies which overall are the leading cause of disability and second leading cause of death worldwide ( ). Neuroimaging has long been a mainstay in the diagnosis and treatment for neurologic disorders and plays a particularly important role in the evaluation of neurodegenerative disorders, brain tumors, and seizure disorders. Both magnetic resonance imaging (MRI) and positron emission tomography (PET) are well-established modalities for the evaluation of these pathologies, allowing for the identification of relevant structural abnormalities, mass lesions, and physiologic changes.
Recently, hybrid PET/MRI systems have been tested and validated for a wide variety of clinical indications in neuroimaging, frequently outperforming separately acquired PET and MRI ( ; ; ). For instance, the possibility of simultaneously acquiring PET and MRI data rather than sequentially allows for imaging of the brain in the same physiological condition, offering greater accuracy and consistency of evaluation ( ). Additionally, evolving developments allow for MRI information to be used to correct the PET signal for atrophy, partial volume effects, motion, and attenuation, leading to “augmented” PET information ( ). As with other organ systems, emerging PET/MRI techniques are an exciting frontier in imaging.
Protocols
Sequences
Imaging protocols are strongly influenced by institutional preferences, disposal of experimental MRI and PET acquisition/processing technologies, and local availability of specific radiopharmaceuticals. However, most institutions employ a similar set of fundamental neuroimaging sequences, including: 3D T1-weighed isotropic sequences, T2-weighted fluid attenuated inversion recovery (FLAIR) sequences, T2-weighted fast spin echo sequences, and diffusion weighted imaging (DWI). In addition, most protocols include either a T2 ∗ -weighted gradient echo sequence or susceptibility imaging (SWI) for assessment of iron and calcium deposits. A number of sequences/methods can be used to achieve PET attenuation correction both in a clinical and research setting ( ; ). Postcontrast imaging with gadolinium based intravenous contrast agents is mainly employed in the oncologic setting.
More specialized MRI sequences are also available, depending on the indication. Perfusion weighted imaging (PWI) is a noninvasive method to visualize hemodynamic changes using techniques such as arterial spin labeling (ASL), dynamic susceptibility contrast (DSC) perfusion, or dynamic contrast enhanced (DCE) perfusion. Of note, ASL comprises multiple related techniques (e.g., pulsed, continuous, pseudo-continuous, velocity-selective) which confer different advantages. Resting state functional MRI (rs-fMRI) is increasingly used and offers a spatial correlation of altered functional networks and metabolism ( ). In the setting of oncologic imaging, MR spectroscopy is also frequently employed for more advanced tissue characterization.
PET and radiopharmaceuticals
The specific brain imaging radiopharmaceuticals will be discussed in greater detail in each following subsection. In general, and as with the imaging of other organ systems, FDG is the most frequently utilized radiopharmaceutical for brain imaging. FDG readily crosses the blood–brain barrier and its localization is a marker of glucose metabolism and an indirect marker of perfusion. Highlighting abnormal perfusion and cellular metabolism proves useful for evaluation of a wide range of brain pathologies, including neurodegenerative disorders, neoplastic processes, and seizure disorders ( ). In addition to FDG, other tracers are used for evaluation of specific neurotransmitter pathways or pathologic protein aggregates (as in the case of neurodegenerative disorders), or cellular amino acid metabolism (as in the case of neoplastic processes). PET, regardless of the radiopharmaceutical used, is typically acquired at least for the entire duration of the MRI acquisition. According to the specifics of the radiopharmaceuticals and clinical indications, dynamic PET acquisitions can also be used ( ; ). Attenuation correction of PET signal is an inherent difficulty with PET/MRI. Over the years, several methods have been developed, generally yielding results within 5% of CT reference ( ; ).
Neurodegenerative disorders
Neurodegenerative disorders encompass a broad set of diseases characterized by loss of cellular function in the central or peripheral nervous system. Neuroimaging plays a growing role in diagnosis due to the ability to discern brain parenchymal atrophy patterns, hypometabolism patterns, pathologic proteins, or neurotransmitter pathway derangements. Dementias are a specific subcategory of neurodegenerative disorders and are particularly important in terms of morbidity and mortality, with the prototypical case of Alzheimer’s disease alone estimated to have a worldwide prevalence of 712 cases per 100,000 and accounting for 28.8 million disability-adjusted life years (DALYs) ( ). Dementia is defined by the progressive loss of cognitive abilities, leading to a loss of autonomy ( ). While dementia can be secondary to both primary neurologic processes or systemic conditions (e.g., vascular disease or hepatic insufficiency), the term dementia is most often used to refer to primary neurologic processes contributing to cognitive decline ( ). These processes may affect different regions of the brain parenchyma, different cellular mechanisms, and different neurotransmitter pathways, resulting in diverse clinical syndromes. Therefore, the taxonomy of dementias depends on the combination of the specific pathophysiology (classically identified neuropathologically) and the associated clinical expressions. The three most common degenerative dementias are Alzheimer’s disease, accounting for over 60% of such cases, followed by dementia with Lewy Bodies, and frontotemporal lobar degeneration ( ). In addition to these disorders, diseases of neurotransmitter pathways, specifically Parkinson’s disease (or variants thereof), are also of particular concern, with a global prevalence of 106 per 100,000 and accounting for 3.2 million DALYs ( ; ). In patients with these clinical syndromes, MRI and PET are standard imaging investigations.
Current standard of care imaging
MRI is typically the initial imaging modality in suspected neurodegenerative disorders, largely due to its ability to confidently exclude other potential secondary causes of cognitive decline (e.g., mass lesions) and its utility in guiding diagnosis. For instance, high-resolution T1-weighted images can qualitatively and quantitatively assess patterns of parenchymal atrophy, providing insight into the underlying disorder (e.g., mesial temporal cortex atrophy in Alzheimer’s disease or mesencephalon atrophy in progressive supranuclear palsy). T2-weighted, T2-FLAIR, and T2 ∗ -weighted/SWI can demonstrate the presence of prior infarcts, chronic small vessel disease, and microbleeds, thus assessing potential underlying vascular dementia or cerebral amyloid angiopathy. ASL can allow for identification of areas of relative hypoperfusion, correlating to areas of neurodegeneration, prior to the development of measurable/perceptible parenchymal atrophy (similar to the hypometabolic patterns which would be observed on FDG-PET). Other sequences, such as diffusion tensor imaging or functional MRI techniques, have been investigated in neurodegeneration, with promising results. However, these are less established in clinical practice.
The PET tracers used in neurodegenerative diseases can be categorized into three main classes: (1) tracers assessing brain metabolism/perfusion, such as FDG (or rarely 15 O–H 2 O); (2) tracers targeting specific neurotransmitter pathways (particularly the dopaminergic system); and (3) tracers targeting β-Amyloid plaques or tau protein. In the case of FDG, decreased uptake is typically observed in areas of neurodegeneration and thus the pattern of hypometabolism can aid in the diagnosis of the overall neurodegenerative condition. For imaging of disorders of neurotransmitter pathways, the prototypical case involves the dopaminergic pathway, relevant in Parkinson’s disease (and variants thereof) and dementia with Lewy bodies ( ; ). For these pathologies, 18 F-FDOPA and 18 F-FP-CIT (the PET counterpart to 123 I-FP-CIT/DaTscan) have shown utility. For imaging of β-Amyloid, 11 C-PiB has been the most widely used tracer. However, given inherent half-life related limitations in 11 C imaging, 18 F radiopharmaceuticals have been developed, such as florbetapir, florbetaben, and flutemetamol, all of which also target β-Amyloid. While FDG-PET, dopaminergic PET, and amyloid PET are established diagnostic tools for different neurodegenerative conditions ( ), several other targets have also been investigated. These novel agents include tracers specific for tau protein (such as 18 F-flortaucipir, which in 2020 became the first agent targeting tau to receive FDA approval), for neuroinflammation, and for other neurotransmission systems such as the cholinergic or serotonergic pathways. Multiple groups are also working on the development of novel tracers for more specific target proteins, such as alpha-synuclein (associated with Lewy body dementia, Parkinson’s disease, and multiple system atrophy) or TDP-43 (associated with forms of frontotemporal lobar degeneration).
PET/MRI in neurodegenerative disorders
Combined acquisition of PET and MRI yields many benefits and has been shown to be technically feasible and well-tolerated. Among its strengths is providing information that can be more readily and systematically combined than information acquired in two separate sessions, allowing for improved interpretation and the potential adoption of abbreviated protocols for each modality ( ; ; ; ; ; ).
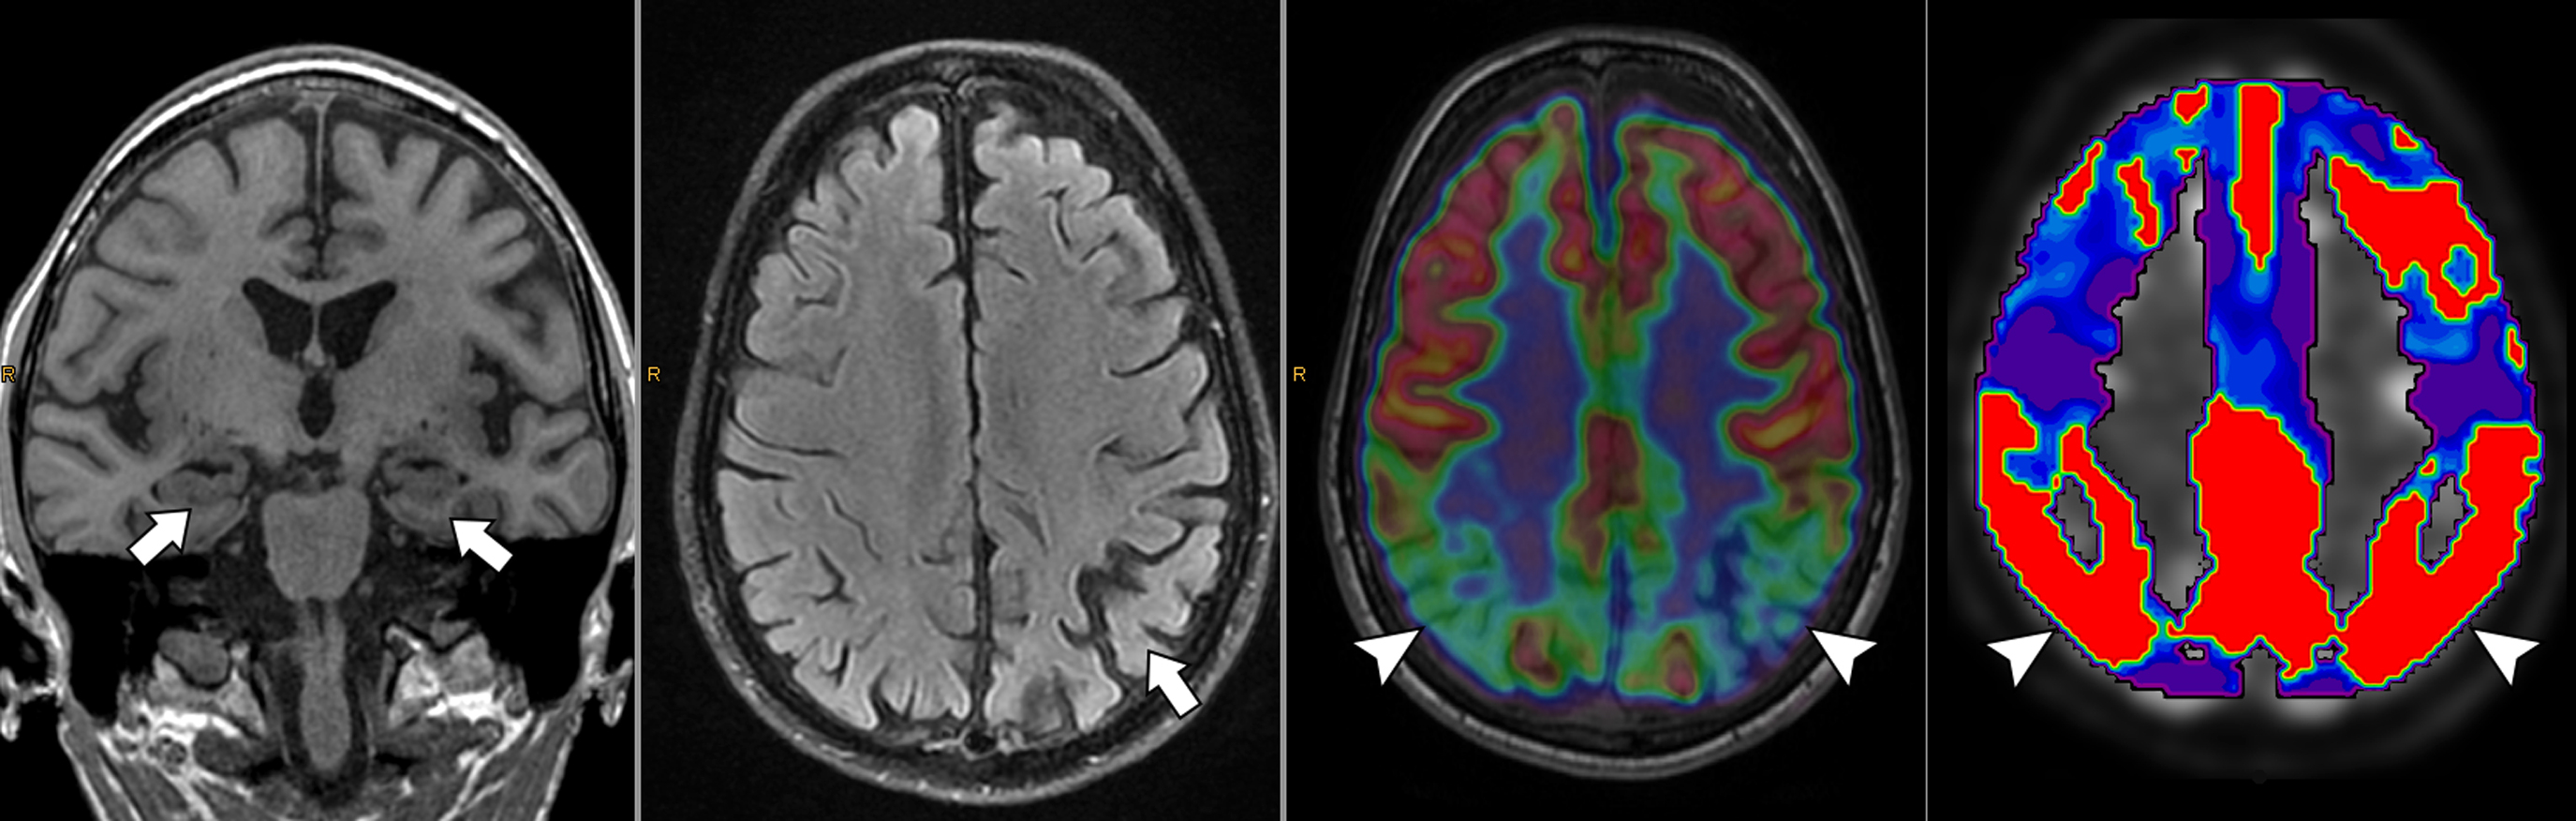
A few studies used simultaneously acquired FDG PET/MRI to study the association between structural and functional changes in different neurodegenerative conditions ( ; ; ; ; ; ). While overall correlation between atrophy and hypometabolism was observed in a variety of dementias, this correlation was variable, suggesting complementary information between PET and MRI depending on the stage of disease Fig 5.1, Fig 5.2, Fig 5.3, Fig 5.4 .
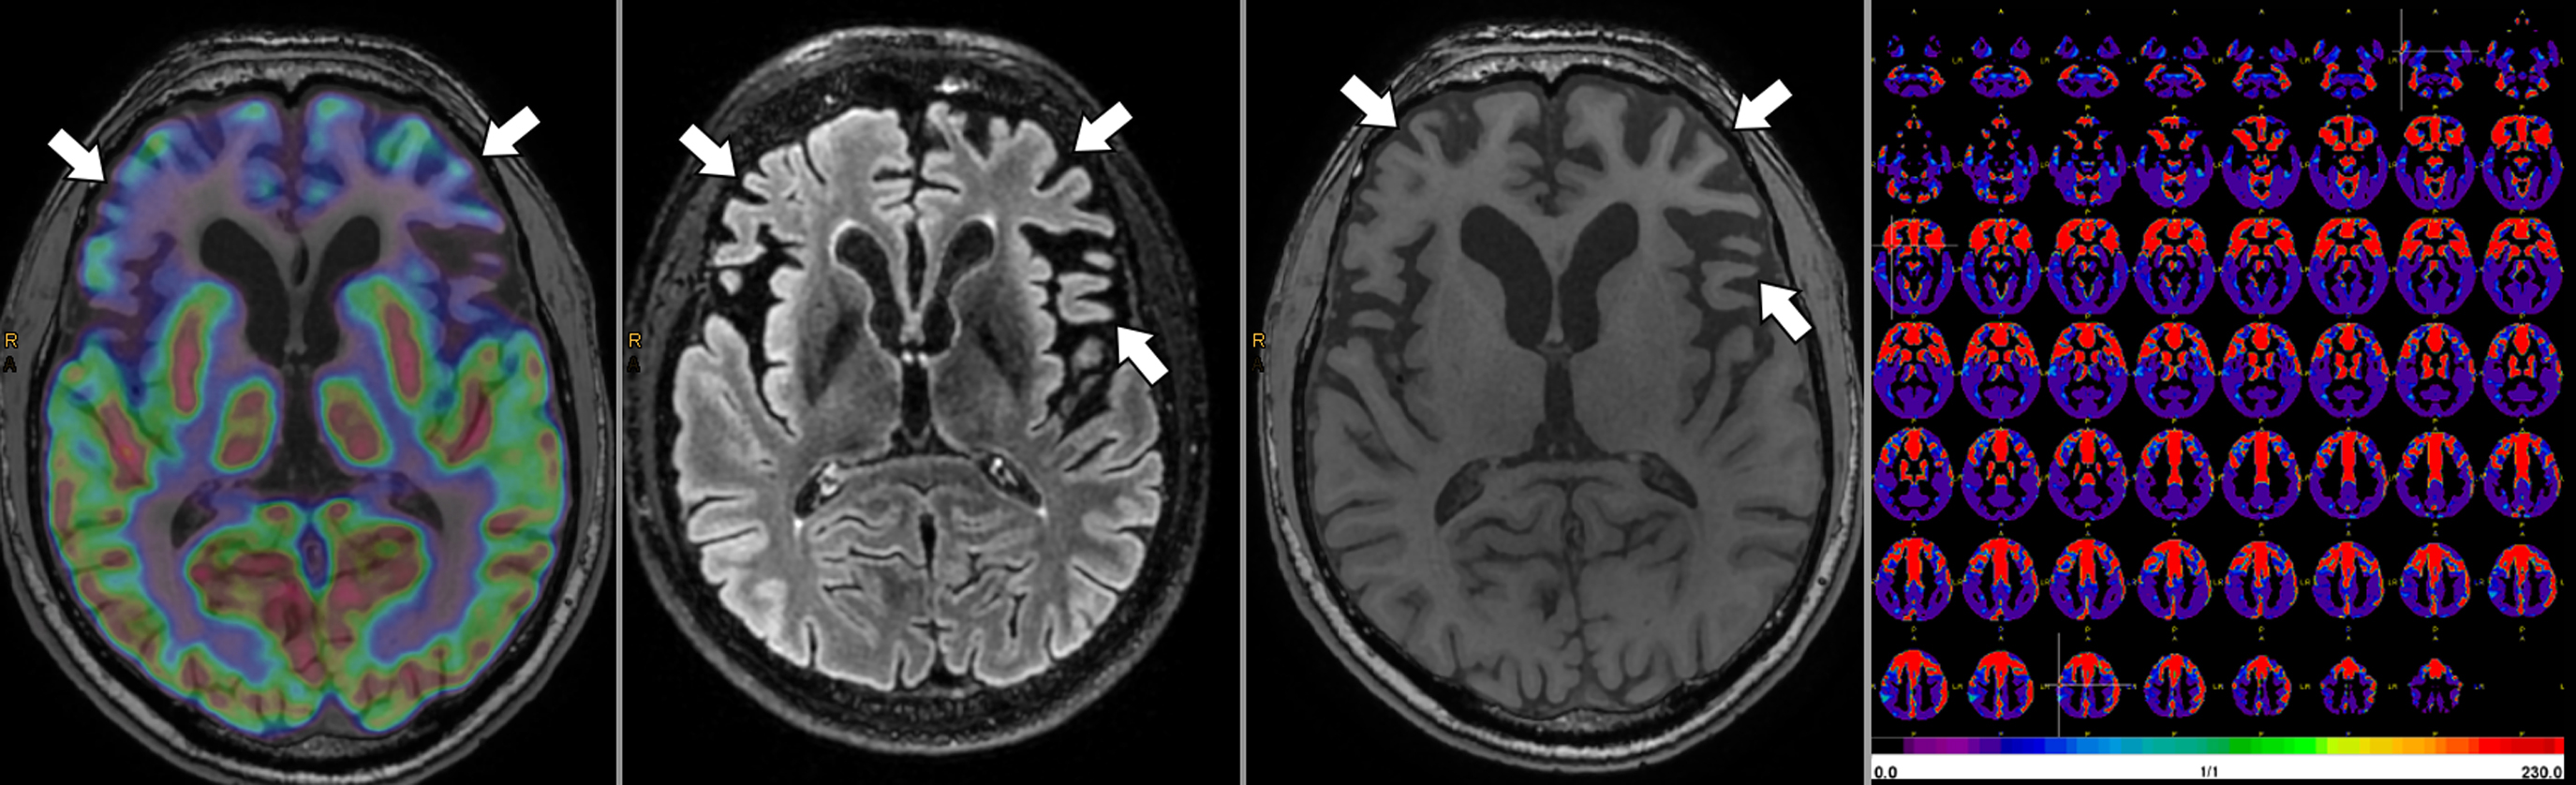
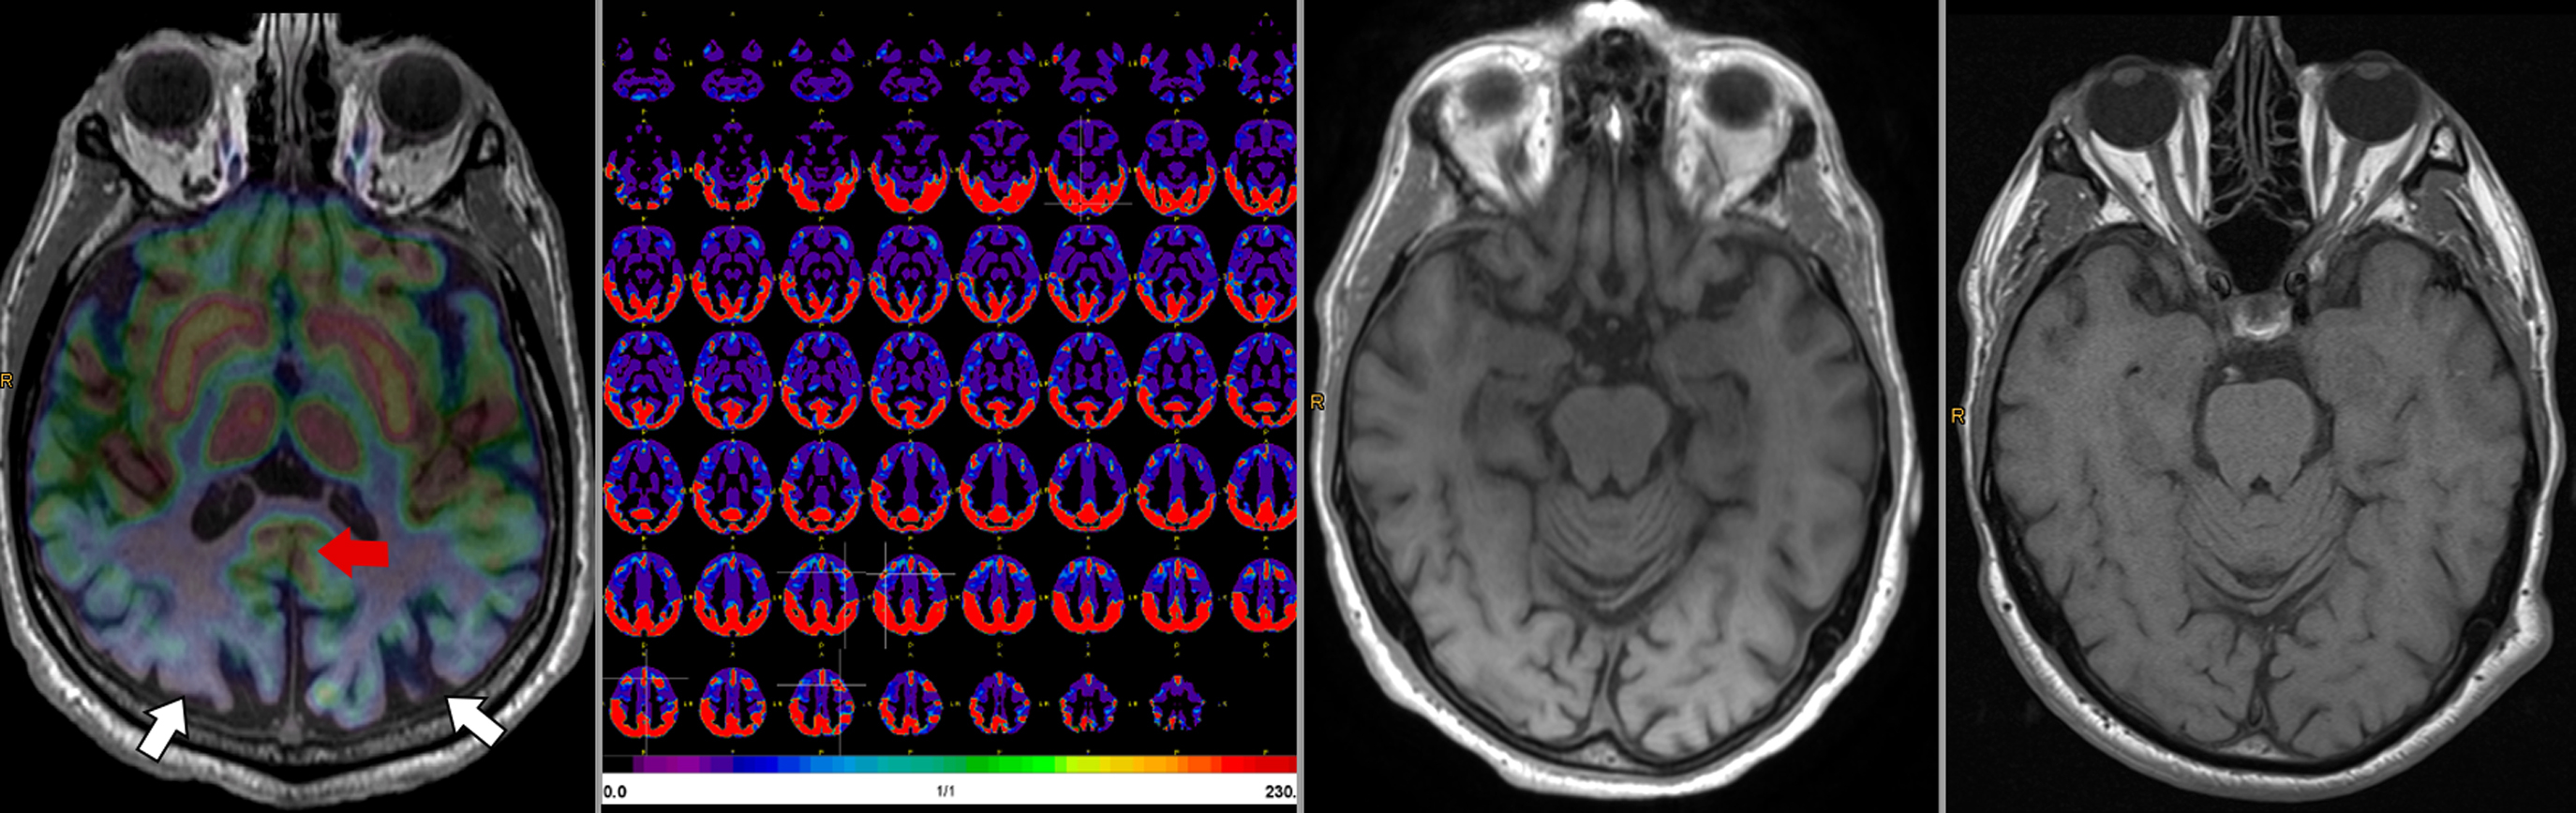
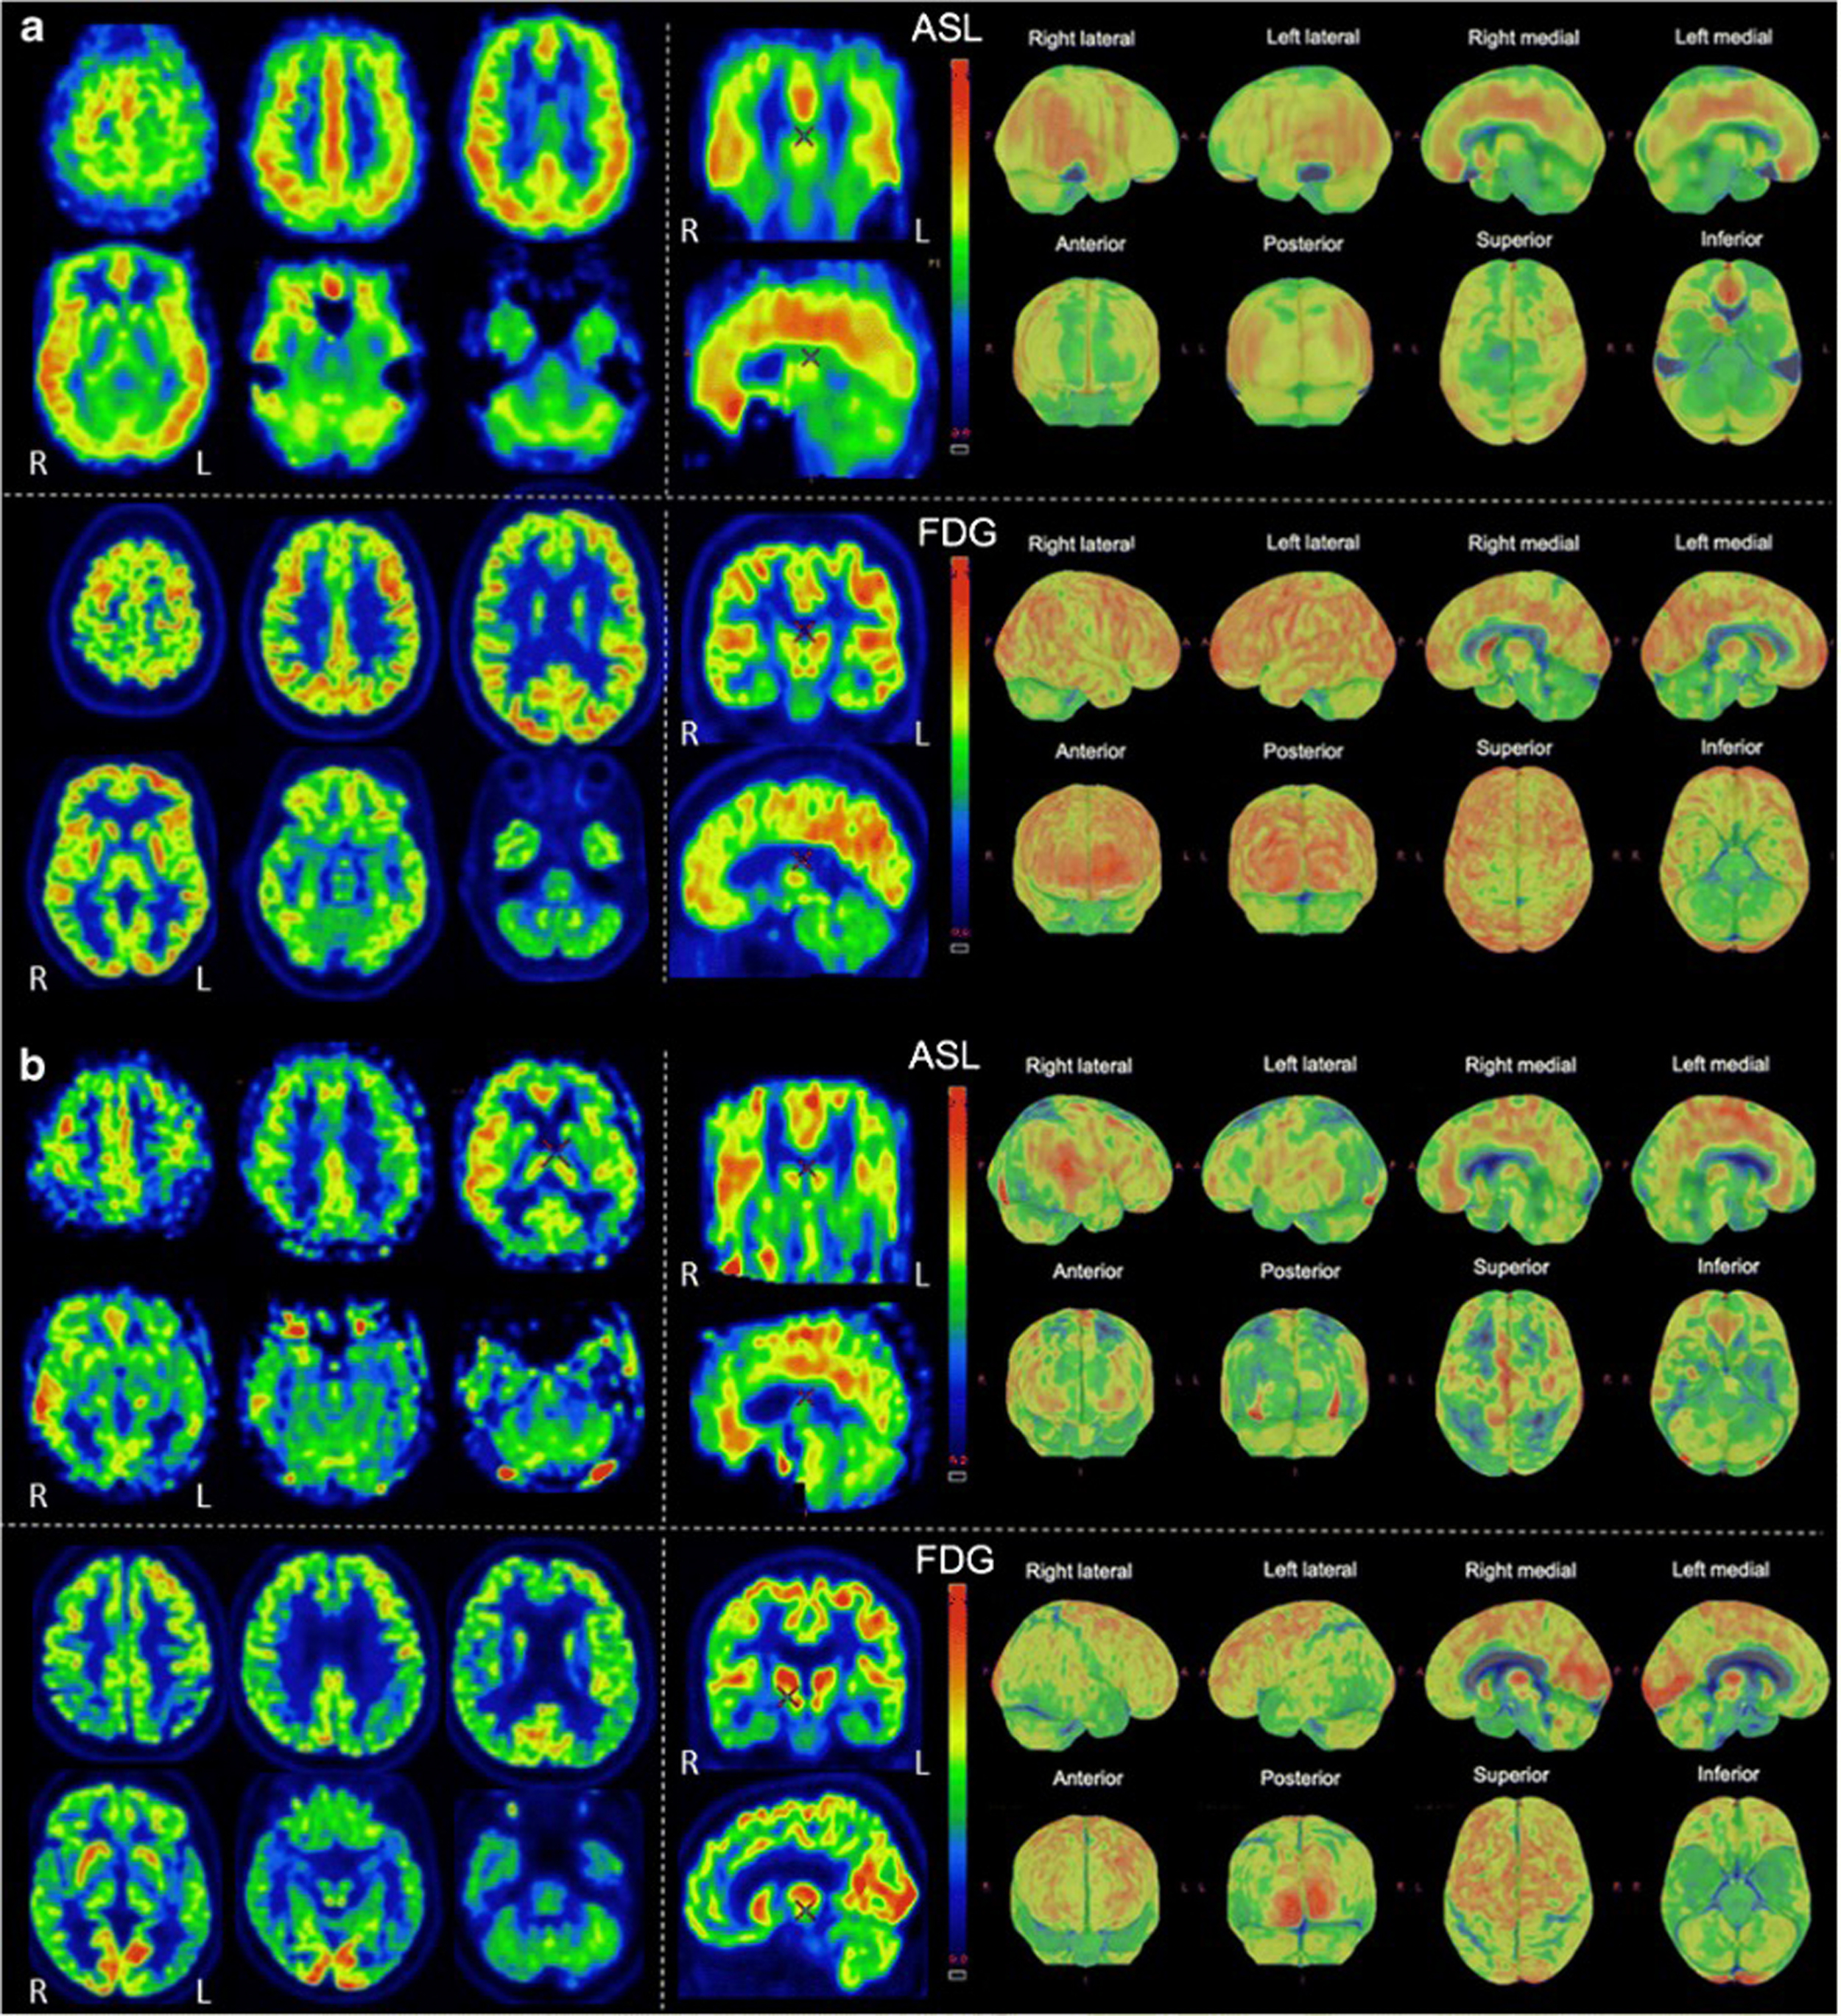
The ability of simultaneous MRI to correct for partial volume effects was also shown to increase diagnostic accuracy, for instance, by preventing underestimation of striatal uptake in Huntington’s disease gene expansion carriers ( ). Additional studies included advanced MRI techniques, such as rs-fMRI, most often focusing on the hippocampus and its connectivity ( ; ; ; ; ; ). These demonstrated expected correlation between areas of hypometabolism and decreased function, even independent of atrophy. Additionally, the added spatial resolution and coregistration provided by simultaneous PET/MRI acquisition allowed for analysis of neuroanatomical substructures, for instance, in the hippocampus and brainstem ( ; ). Studies comparing ASL and FDG deserve specific attention, as ASL can demonstrate areas of hypoperfusion which correspond to the hypometabolism demonstrated on FDG-PET. ASL can also be correlated with the metabolic information gained using other radiopharmaceuticals not targeting metabolism (e.g., with tracers targeting β-Amyloid or neurotransmitter pathways). Of note, direct comparison provided by PET/MRI has consistently shown that, although the two-image series are correlated, sensitivity and specificity at the individual level are higher for FDG compared to ASL, mainly in the early (mild cognitive impairment) disease phase, Fig. 4.5 ( ; ; ).
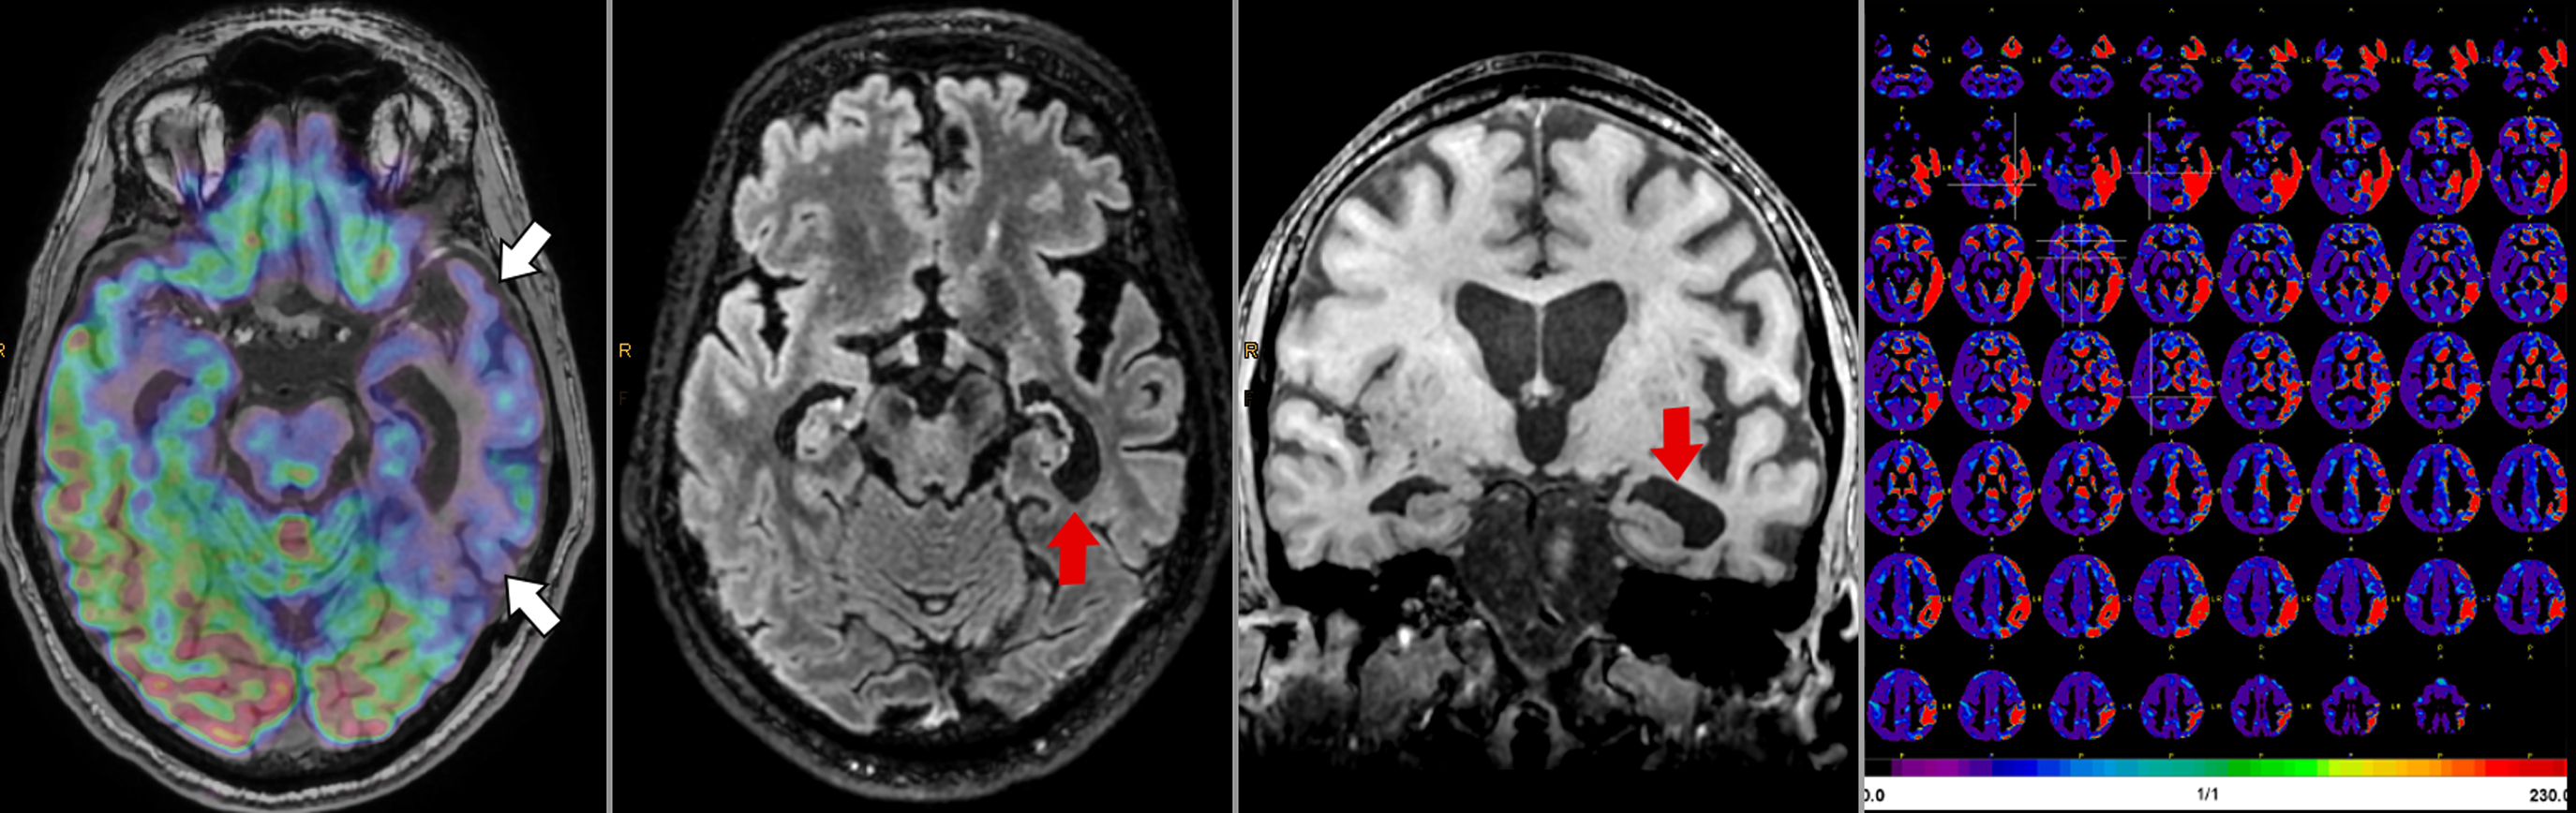
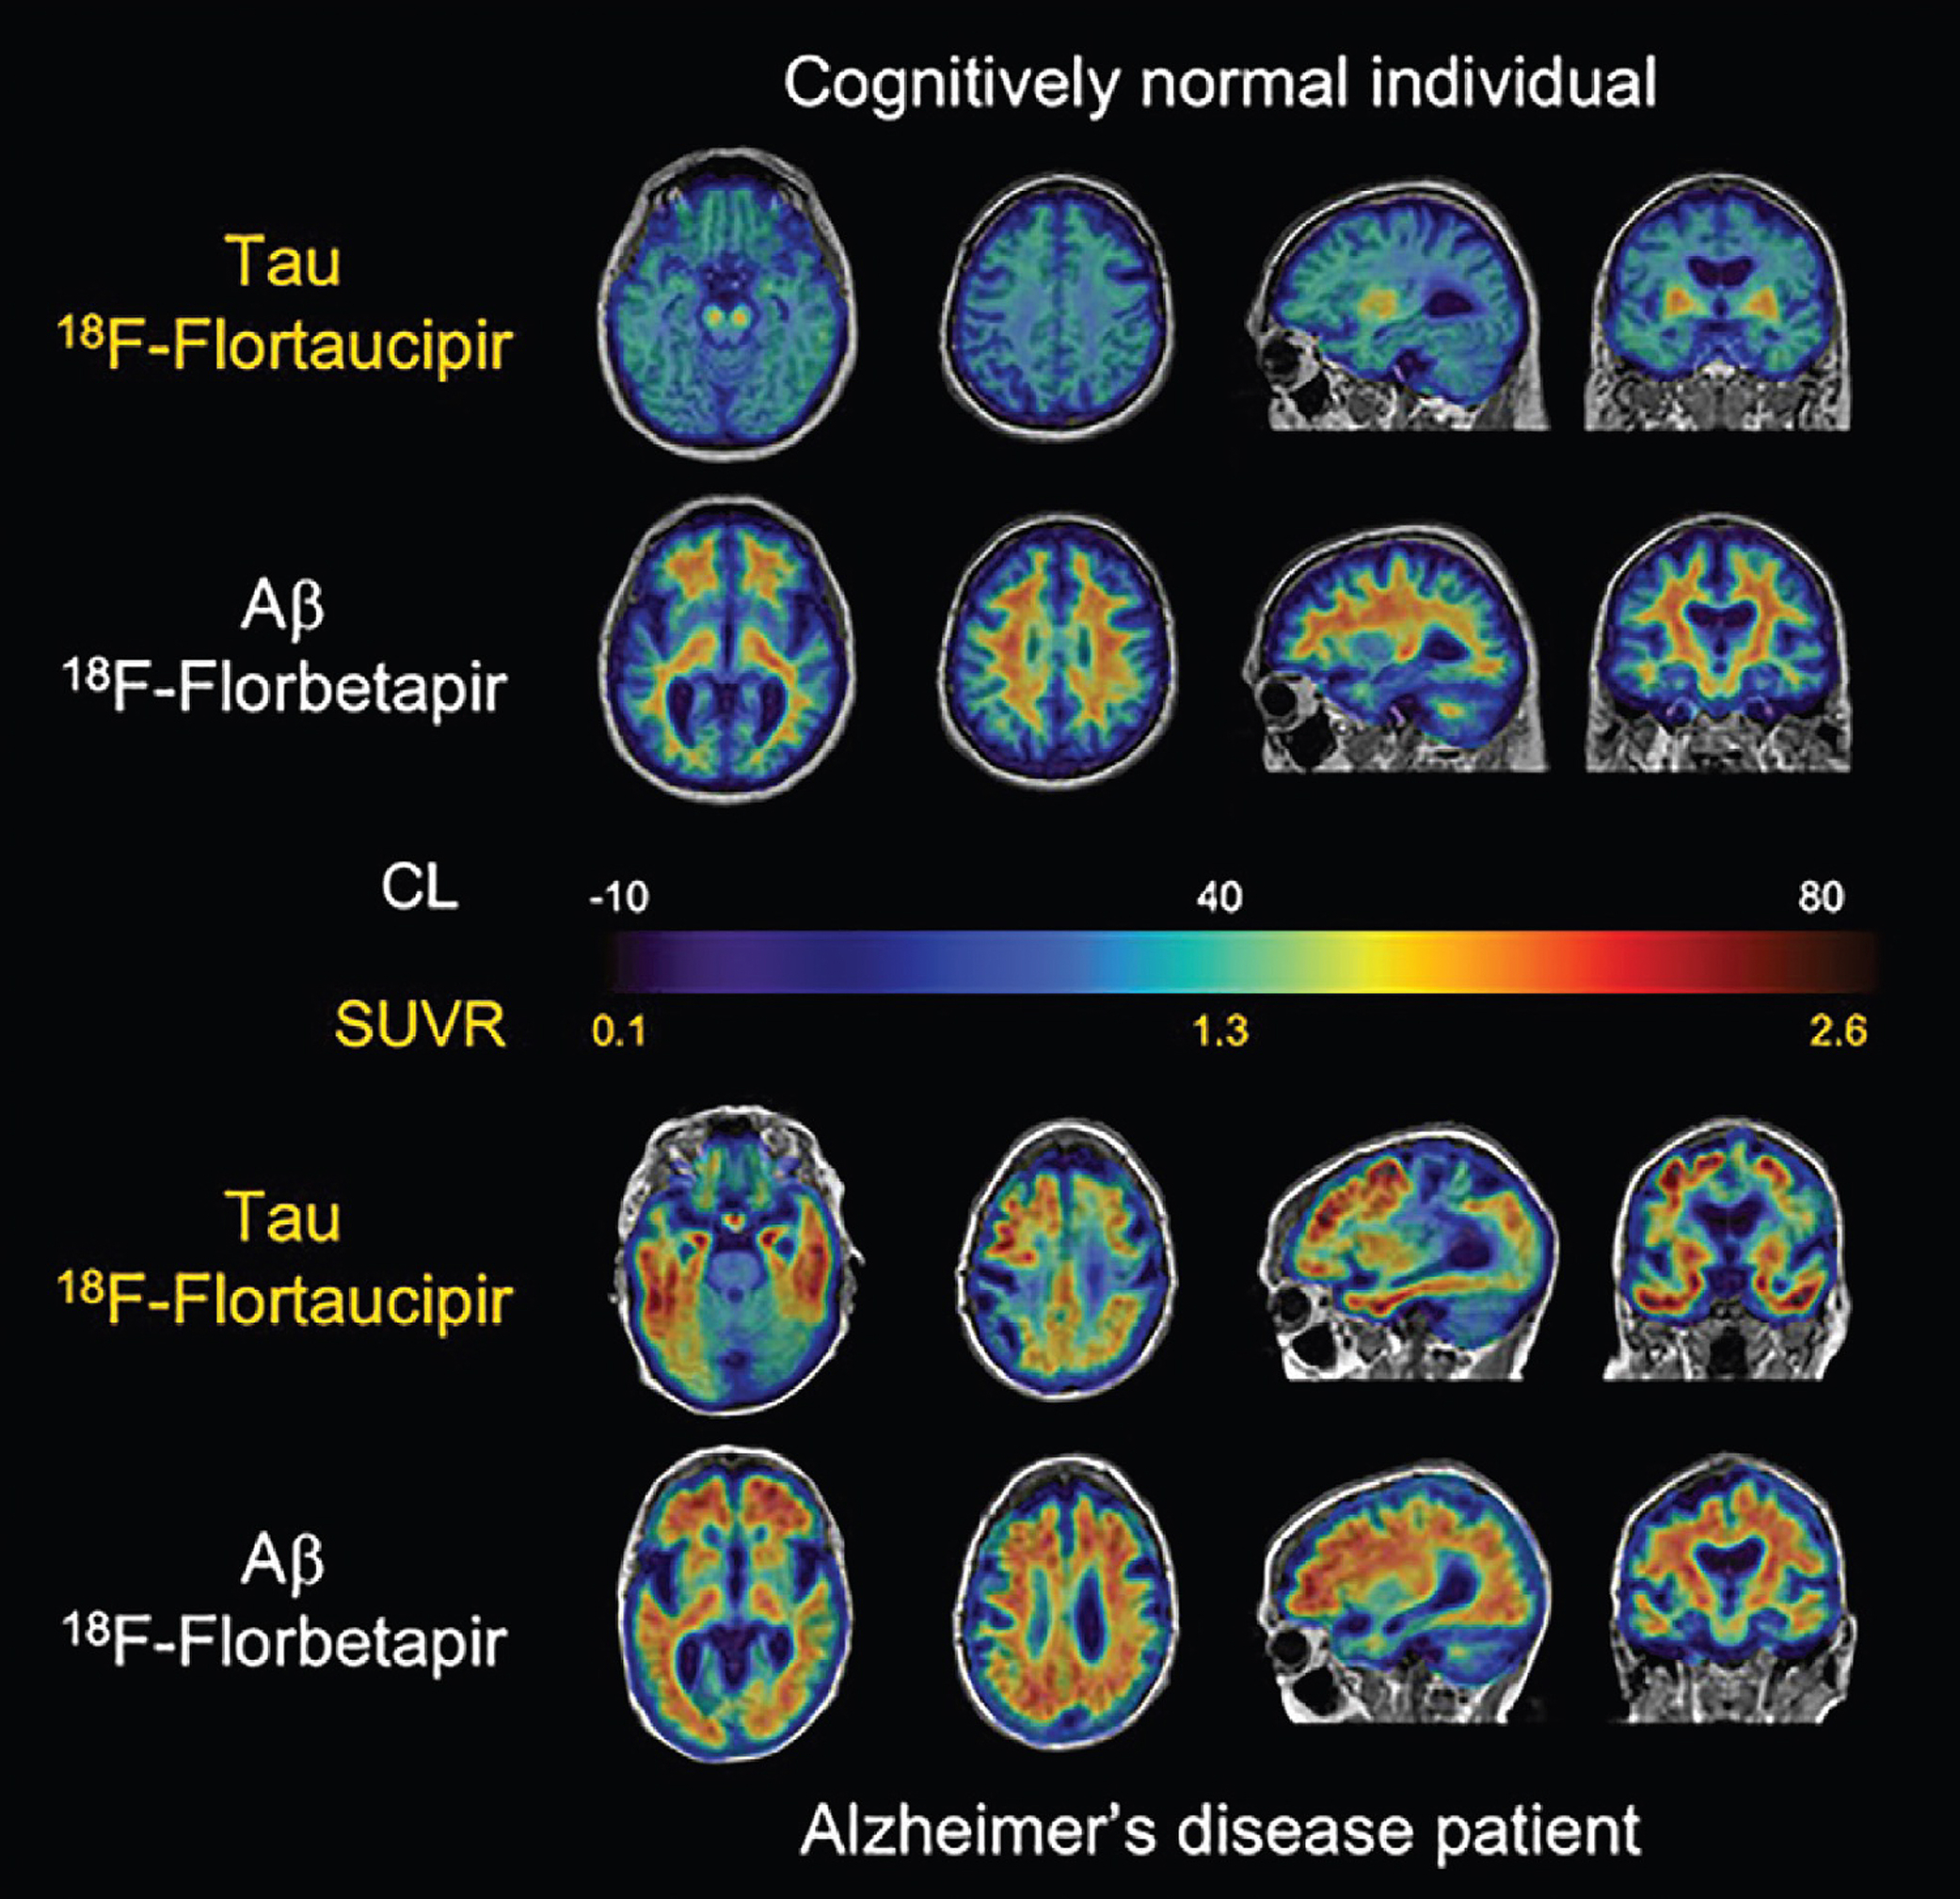
Both β-Amyloid and tau targeting PET tracers have been used in hybrid PET/MRI to investigate the pathophysiology of neurodegeneration and have been shown to be feasible and clinically useful in patients with cognitive disturbances, Fig. 4.6 ( ; ). Specialized β-amyloid or tau hybrid PET/MRI techniques allow multimodal and simultaneous assessment of multiple physiologic parameters (such as blood flow, iron deposition, rsfMRI) in the setting of amyloid pathology. Again, the advantage of simultaneous PET/MRI allows for the spatial resolution to analyze anatomical substructures important in the pathophysiology of tauopathies ( ; ; ; ; ).
Future directions in the PET/MRI applications of neurodegenerative disorders include evaluation of the sustainability of dedicated hybrid PET/MRI for screening preventable causes of dementia ( ). Additionally, among the inherent challenges of hybrid PET/MRI, particularly in patients with significant cognitive impairment, is that of motion artifacts. Correction of these motion-related issues is a field of ongoing work. To date, temporally correlated MRI data for in-plane motion correction and other techniques such as optical tracking have been employed, with improved image quality ( ; ).
Brain tumors
Brain tumors include a diverse set of pathologic processes and encompass both primary central nervous system neoplasms and metastases. Worldwide prevalence is difficult to assess ( ), though the incidence of brain tumors is estimated to be 4.6 per 100,000 person years, accounting for an estimated 7.7 million DALYs ( ). As treatment has evolved, imaging continues to play an important role in lesion localization, characterization, treatment planning, and disease surveillance. In adults, the most common brain tumors are metastases, occurring approximately 10 times more frequently than primary brain tumors, and most commonly arising from melanoma, breast cancer, and lung cancer ( ; ). Meningiomas, arising from the meninges (as the name implies), are the most prevalent primary brain tumor and are usually benign (rarely atypical or malignant). Neoplasms of the brain cells themselves are relatively less common compared to metastases and meningiomas and are classified based on the cell types involved as gliomas, glioneuronal tumors, and neuronal tumors. The subcategorization and grading of brain parenchymal neoplasms is highly nuanced. The most common subtypes include gliomas of the adult-type diffuse category (e.g., astrocytoma, oligodendroglioma, and glioblastoma) and ependymal tumors ( ; ). The prognosis is mainly determined by the histological type of the tumor, the completeness of surgical resection, and the level of differentiation ( ). It should be noted that since 2016, the WHO classification of CNS tumors heavily factors in molecular features for classification of tumors (e.g., the presence/absence of IDH mutation and 1p/19q codeletion) ( ).
Neuroimaging is essential in the pretreatment/presurgical setting to determine the extent of the disease, estimated aggressiveness, and feasibility of surgical resection. Later, neuroimaging is invaluable for response assessment and therapy monitoring. The standard modality to obtain anatomical information (tumor location, size, and structural appearance) is contrast-enhanced MRI, with PET serving as an important adjunct.
Current standard of care imaging
Conventional MRI sequences are the mainstay for pre- and posttreatment assessment of brain tumors. In particular, postcontrast T1-weighted sequences and T2-weighted FLAIR sequences are of the greatest utility. In the case of metastases and meningiomas, the postcontrast T1-weighted sequences demonstrate the margins of abnormal tissue and the T2-weighted FLAIR sequence demonstrates surrounding parenchymal changes (e.g., vasogenic edema). For the glial tumors, areas of enhancement may correlate to foci of higher grade and areas of T2-weighted FLAIR signal abnormality may correlate to areas of infiltrative tumor or edema, thus providing important information for treatment/surgical planning. DWI and apparent diffusion coefficient (ADC) maps can demonstrate areas of decreased diffusivity corresponding to increased tumor cellularity, thus aiding in detection of lesions and/or areas of higher grade within lesions, particularly in the case of glial neoplasms ( ; ).
Advanced MRI techniques are frequently employed in brain tumor imaging. Perfusion imaging (such as ASL, DSC, and DCE) can depict the vascularity of tumors. In the preoperative/pretreatment settings, these yield information regarding potential tumor grade and histology and in the postoperative settings can help determine sites of residual/recurrent tumor versus posttreatment changes. MR spectroscopy enables the creation of metabolic maps of brain tumors, yielding insight into their biology. Almost all brain tumors have an increased choline/N-acetyl aspartate (NAA) ratio due to a decreased NAA signal and increased level of choline. The decreased NAA signal is considered to be due to loss of neuronal viability, whereas the increased choline is indicative of increased membrane turnover. In addition to choline and NAA signal changes, most primary brain tumors also have an increased level of lactate, lipid, and myo-inositol. These are respectively interpreted as an increase in anaerobic glycolysis or ischemia, necrosis, and an increase in glial cells. Lastly, creatinine functions as reference marker for cellular metabolism ( ). Metabolite maps can provide insight into tumor grade, with higher tumor grade usually correlating to higher choline, lipid, and lactate signal ( ). Pitfalls of MR spectroscopy include a degree of operator dependence, standardization issues, and the potential for sampling errors ( ).
The use of 18 F-FDG PET in brain tumors is nowadays limited to the possible distinction of high-grade from low-grade tumor, with increased FDG metabolism in the former and low or absent FDG metabolism in the latter. To assess the extent of pathology or the metabolic changes after therapy, FDG has given way to amino acid based radiopharmaceuticals. In brain tumors, protein synthesis is altered with an increased expression of large amino-acid transporters such as LAT1. The upregulation of LAT1 is proportional to the increase in proliferation activity and it is thus a marker of cell growth ( ). Differently from contrast-enhanced MRI, the uptake of the amino-acid tracers does not depend on blood–brain barrier disruption, thus yielding complementary information. Additionally, these tracers demonstrate a much lower physiological uptake in the cortex, improving contrast. Currently, three amino-acid tracers are clinically utilized: 11 C-methionine ( 11 C-MET), 18 F-fluoroethyltyrosine ( 18 F-FET), and 18 F-fluorodihydroxyphenylalanine ( 18 F-FDOPA). 11 C-MET is the first and longest-established amino-acid PET tracer. However, due to the short half-life of 11 C, tracers labeled with 18 F, whose half-life is about 2 h, have gained increasing use.
Amino-acid PET scans are analyzed by first calculating the tumor-to-brain ratio (TBR) by dividing uptake in the tumor by uptake in normal brain tissue ( ). Preferably, the analysis of tracer dynamics (time-to-peak values and time activity curves) is employed in concert with TBR as this improves diagnostic accuracy in differentiating between high- and low-grade tumors (sensitivity/specificity 71%–85% versus 94%–100%) ( ; ). Increasing or stable time activity curves typically correspond with WHO grade II while WHO grade III and IV typically demonstrate a decreasing time activity curve ( ). Similarly, an earlier time-to-peak is associated with a worse prognosis ( ).
In addition to amino-acid tracers, some other tracers may be helpful to identify specific metabolic conditions such as hypoxia (using 18 F-fluoromisonidazole), proliferation (using 18 F-fluorothymidine), and neuroinflammation (using translocator protein radioligands). Currently the utility of these tracers in a clinical setting remains an area of ongoing research ( ).
In meningioma, specific somatostatin receptor ligands such as 68 Ga-DOTA-D-Phe1-Tyr-3-octreotide ( 68 Ga-DOTATATE) and 68 Ga-DOTA-Tyr3-octreotide ( 68 Ga-DOTATOC) may have an added value especially in patients with ambiguous results on MRI ( ), with a sensitivity of 100% for 68 Ga-DOTATOC versus 90% for contrast-enhanced MRI ( ). By exchanging Gallium with 90 Yttrium, 177 Lutetium, or 111 Indium, the same tracer can also be utilized for peptide receptor radionuclide therapy (PRRT) ( ).
PET/MRI in brain tumors
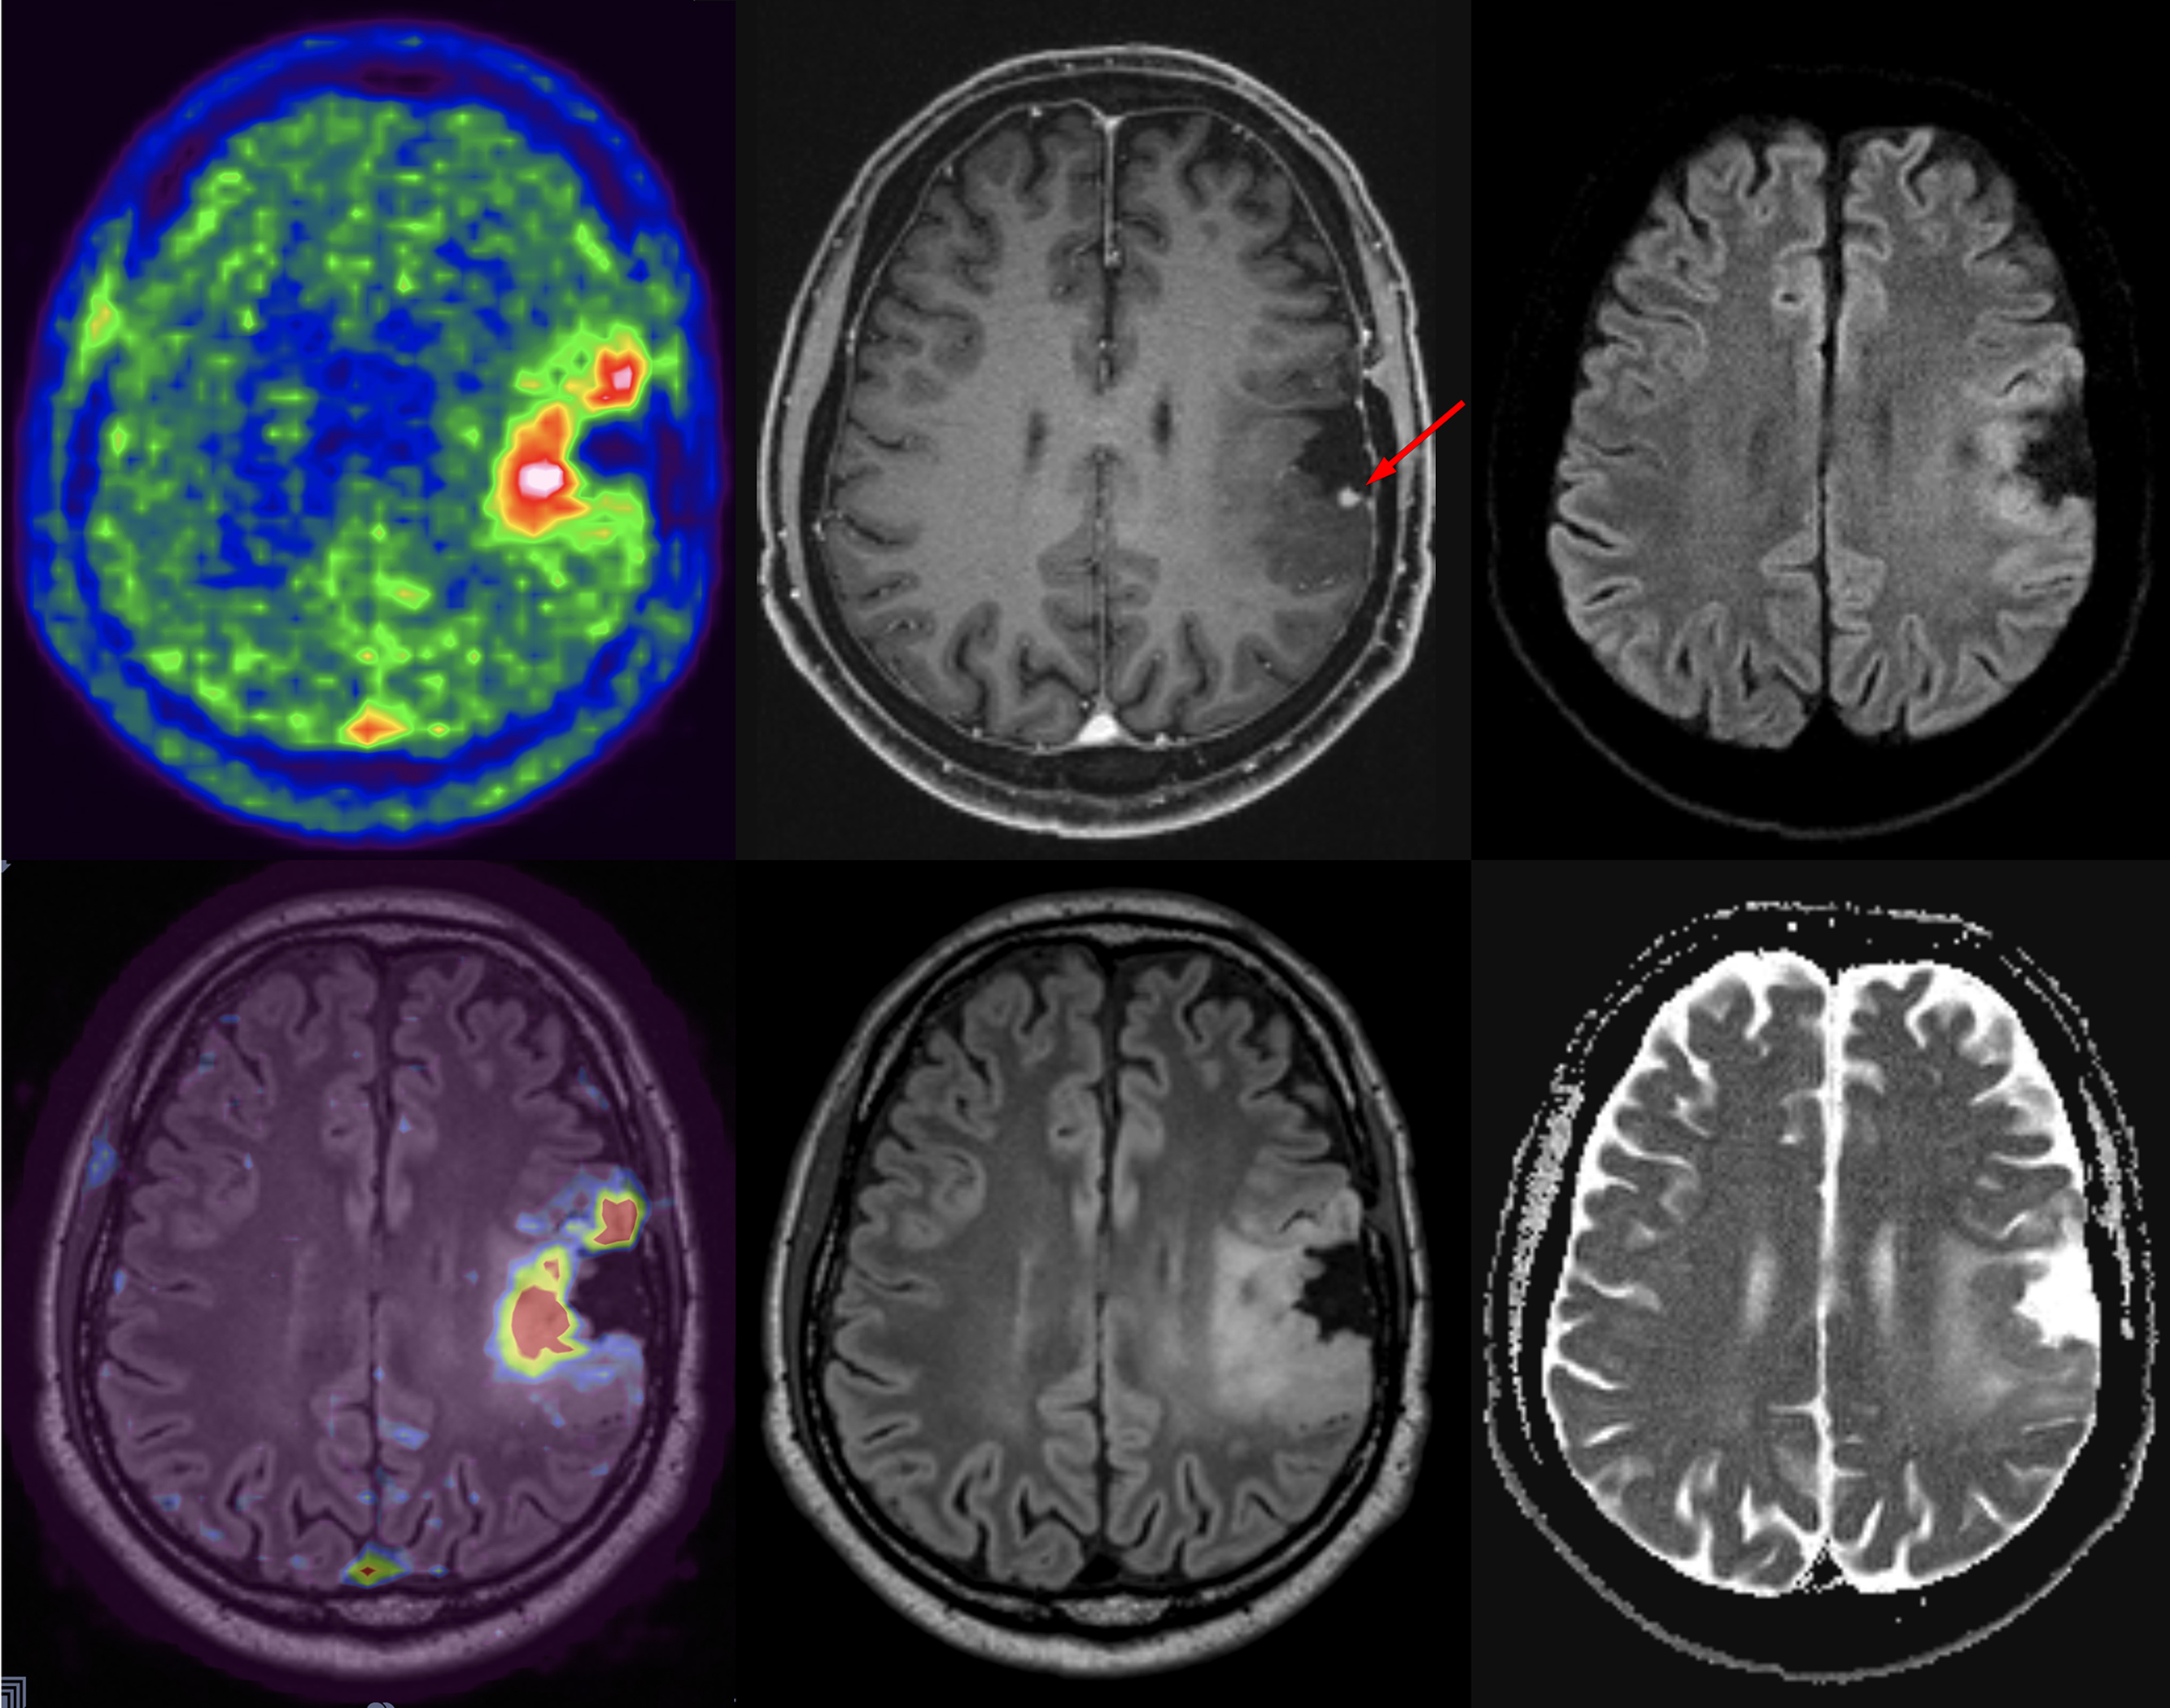
As with imaging of neurodegenerative disorders, PET/MRI enables the combination of the high spatial resolution of MRI with physiologic and metabolic information obtained by advanced MRI sequences and PET. Therefore, the complementary information from this multimodal approach, as illustrated in Fig. 4.7 , aids in diagnosis, tumor margin delineation, and improved treatment planning.