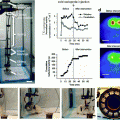
Fig. 9.1
The effect of X-rays 2 weeks after of a wrongly set CT perfusion scan. Photo from al.com
Any program for QA in medical imaging involves measurements of radiation dose and image quality.
9.1.1 The Risk of Radiation Dose
The current international approach to every kind of radiation is based on the ALARA principle (as low as reasonably achievable), which itself is based on the assumption that the risk of a certain amount of radiation is proportional to its magnitude. This assumption (called linear non-threshold model [6, 7]) seems reasonable, but it has been recently challenged by hormesis theories [8], which defend that a slight amount of radiation may be beneficial; that low dose may prepare your body’s mechanisms against larger amounts of radiation (Fig. 9.2), just like a vaccination does against a virus. Other positions (called supralinear models) defend that low doses of radiation have actually a relatively higher risk than large doses.
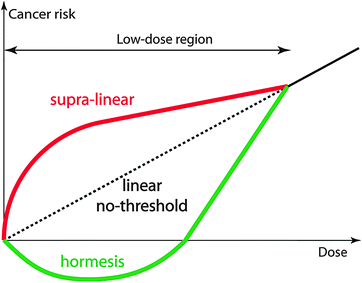

Fig. 9.2
Theories of cancer risk vs. dose
Experiments to check these theories are extremely difficult because the involved doses are in the range of the naturally received radiation. A group of individuals taking part in a control study, for example, would have to be isolated from every kind of radiation, which would isolate them from everything else at the same time, and therefore, it would be difficult to find a control group for them. Apart from that, individuals show different sensitivity to radiation doses depending on their genes. This individual susceptibility makes careful studies even more difficult.
For this reason, the author joins the majority of the scientific community assuming the LNT model and defending the ALARA principle. Accordingly, current trends for radiation dosimetry in QA programs are discussed in Sect. 9.2.
9.1.2 Image Quality
Traditional approaches to determine image quality (IQ) start to be obsolete, either because they rely on subjective tests or because they have been proven to miss features of the images. In particular, new technologies, such as noise reduction algorithms for CT, or mixed devices that combine transmission and emission tomography, such as PET-CT or PET-MR scanners, require new assessment tools and models and new phantoms to appropriately account for those new features. Some of these new tools will be presented in Sect. 9.3.
An alternative current trend for IQ evaluation, although suggested more than 30 years ago, is the use of mathematical or model observers. These tools can be trained to simulate how humans observe images, thus being more efficient and cheaper for the analysis of images. It may seem scary to think of the substitution of humans in the field of medicine, but the truth is that machines are being taught in every technological field. Therefore, Sect. 9.4 of this chapter also includes a basic explanation of how computers can be taught to carry out QA tests using model observers.
This whole chapter focuses on current trends or new approaches to quality assurance. For standard procedures for dosimetry, radiation protection of the staff, and quality control of radiopharmaceuticals, the reader is referred to the previous volumes of the MADEIRA collection [9, 10] and to the very valuable compilation of information by the initiative Image Gently [11].
9.2 Dose-Related QA
Physicists working on any modality of medical imaging have developed different ways to evaluate the exposure of the patients to ionizing radiation, each fitting the corresponding technology. As a result, there is a large variety of such measures (Fig. 9.3). In nuclear medicine, the patient’s dose depends on the activity that is administered as well as on the physical and biokinetic properties of the employed radiopharmaceutical. Consequently, it is the activity of the samples (in Bq) that is generally measured for quality assurance purposes. In radiography, the exposure is usually measured as entrance surface air kerma (ESAK) at the approximate position of the patient’s skin. In the particular case of mammography, it is more common to measure the dose delivered at the breast’s glandular tissue (glandular dose). For devices of fluoroscopy (such as the C-arms for interventional radiology and cardiology), four different measures are used; the maximum dose delivered at the patient’s skin as peak ESAK or peak skin dose (PSD), or the air kerma measured at a particular spot along the central ray of the beam, called reference air kerma, or the product of the kerma at a certain position multiplied by the area irradiated, called kerma-area product (KAP), or the time that the device is recording a series of high-exposure images, called fluoroscopy time. Each of these measures has its advantages and drawbacks. In computed tomography (CT), ESAK and PSD have been used [12, 13], but the standard specific measures are the CT dose index (CTDI) and its product with the length of the scan, called dose-length product (DLP).
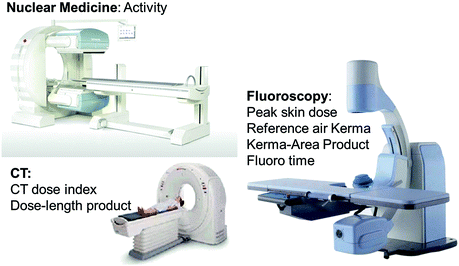

Fig. 9.3
Each imaging modality has currently its own dosimetry measures
The problem with this large variety of different measures is that they are mostly noncomparable. Since they refer to certain definitions, each one must be measured under certain conditions and cannot be added up to other measures. For example, a certain CTDI measured after a CT scan cannot be added to the reference air kerma measured during a subsequent intervention to the same patient, even though they have the same units. Therefore, it is difficult to compare doses and prepare dose reports. The same problem appears during QA of recently marketed mixed modalities, such as PET-CT or SPECT-CT scanners, which combine nuclear medicine and conventional CT technology in a single machine; the radiation dose must be reported as two different measures.
As a solution to this situation, the current approach tends to homogenize dose measures using calculations of equivalent and effective dose. Equivalent and effective doses are defined for a reference individual and are calculated starting from absorbed doses in organs and tissues, taking into account different biological effectiveness of different types of radiation (by means of the radiation weighting factor w R) and different sensitivities of organs and tissues to stochastic effects (by means of the tissue weighting factor w T) [7]. In the context of medical exposures, these quantities are of value for comparing patient exposures from different diagnostic procedures or patient exposures using similar imaging procedures across different hospitals and different nations, and different imaging technologies for the same medical examination [14]. It should, however, be kept in mind that these quantities are reserved for use in risk assessment associated only with radiation-induced stochastic effects since the w R and w T values were calculated only in reference to these effects and not in relation to deterministic effects.
Because of the many calculations that are necessary to obtain equivalent and effective dose, it appears recommendable to additionally use a simpler quantity for QA purposes in cases of external exposures. The peak skin dose (PSD) is a perfect candidate because it is well understood, quite easy to measure, and directly relates to deterministic effects of radiation (such as the hair loss shown in Fig. 9.1). Furthermore, in transmission modalities (such as all X-ray examinations), it is at the patient’s skin where the highest radiation doses are attained.
For this reason, current approaches to QA in terms of dose are focusing on measuring organ doses for the calculation of effective dose and on measuring peak skin dose for quick checks. Both quantities are not defined on the machines, but on the human body, which is the only common element of all modalities using ionizing radiation. Therefore, effective dose and skin dose can be easily compared and added up to account for examinations with different modalities.
9.2.1 Organ and Effective Dose
The measurements and calculations that are necessary to determine organ and effective doses have only recently started to be very accurate and reliable. Powerful computers, better tissue-equivalent phantoms, and smaller, more consistent detectors have made it possible. Computer simulations can be used to estimate how much dose a patient got after a certain exam, avoiding the need to carry out a whole dosimetry protocol for each patient.
Monte Carlo simulations for dosimetry purposes require the computation of many events per second because of the numerous collisions among photons, electrons, and nucleons. The collisions of the photons followed by the simulation determine the energy deposition in the surrounding tissue. Current studies suggest the use of a graphics processing unit (GPU) instead of a central processing unit (CPU). Using a GPU, the simulations can compute more than a million X-rays per second [15].
The simulation codes need to be validated experimentally. New tissue-equivalent phantoms have appeared that simulate the radiation attenuation characteristics of the human body almost perfectly (Fig. 9.4), and at the same time, more reliable detectors are marketed now that make measurements easier and more efficient.
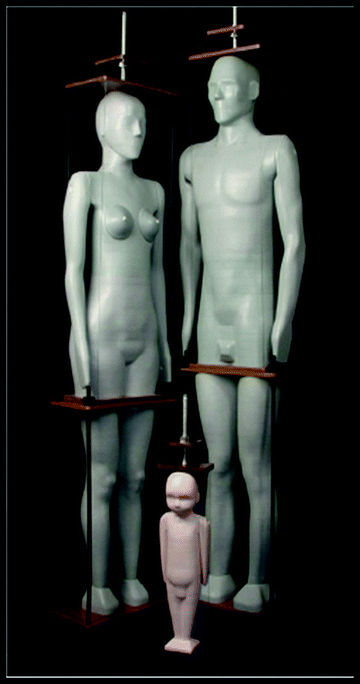

Fig. 9.4
Dosimetry phantoms. Photo from manufacturer’s website
As an example, the author and colleagues are currently using a flexible tissue-equivalent phantom, manufactured by the University of Florida (USA) and optically stimulated luminescence dosimeters (OSLDs). The phantom is made up of slices. Its gummy material allows the user to open inserts in the places where the dose is to be measured. Small detectors, such as OSLDs, can be inserted in those slots (Fig. 9.5).
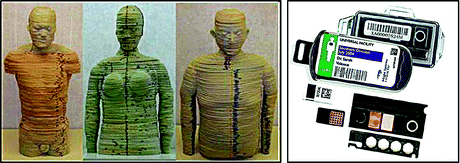

Fig. 9.5
The anthropomorphic phantom from the University of Florida (left), used by the author, and some OSL detectors (right). Photos from manufacturer’s website
The OSL readings obtained after a scan inform of the doses in the organ where they were placed, and those readings can be used to calculate the effective dose related to that particular examination [16] (Fig. 9.6).
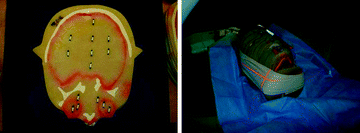

Fig. 9.6
A section of the UF phantom with inserted OSLDs (left) and the whole head inside a CT scanner (right)
Finally, another current development to introduce effective dose in the practice is a handbook of effective doses for all modalities using ionizing radiation. The project has recently started with X-ray computed tomography [17]. The object of this tool is to have the information handy when a patient or a member of the staff needs to know the amount of dose related to a certain examination.
In the future, these tools and methods may make it possible for patients to keep their own radiation record just as they keep their vaccination card.
9.2.2 Skin Dose
The thresholds for deterministic effects in the skin are well understood [18]. For example, erythema and temporary epilation appear after a minimum dose of 2 Gy [18]. Therefore, measurements of the maximum dose attained at the skin (or peak skin dose, PSD) are currently being suggested as a perfect candidate for regular checks of all X-ray devices for medical imaging, in particular CT scanners, which in general deliver the largest doses to the patients.
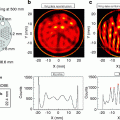
As an example, a group in collaboration with the author is measuring peak skin doses using radiochromic film. This kind of film turns dark when it is exposed to ionizing radiation, thus being appropriate for measurements of the beam width as well. Small pieces of film are enough for accurate, reliable measurements, but a calibration of the film batch is required. The darkening of the film after the irradiation can be measured using flatbed scanners or densitometers (Fig. 9.7, left).
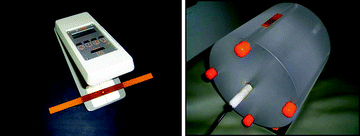

Fig. 9.7
(a) A densitometer for the determination of peak skin dose using film. (b) The conventional CTDI phantom with pieces of radiochromic film (right)
In our experiments, we have measured surface dose and CTDI at the same time to relate both quantities (Fig. 9.7, right). That way, technologists and doctors can instantly assess the PSD by looking at the CTDI displayed at the scanner’s console.
Measurements like ours can serve in the future to develop and validate skin dose maps, which are especially important for high-dose examinations such as CT and interventional radiology. These maps display the received radiation field on the skin in a similar way to the level curves on an earth’s surface map. The implementation of this feature in all devices would be a magnificent help for daily QA/QC purposes, because doctors and patients would have access to the delivered dose and its location just after the procedure.
9.3 Image Quality Assurance
Image quality has been traditionally assessed by subjective methods; a few observers (doctors, other professionals, or volunteers) looked at a series of images and assessed which one looked better for a predefined task. For example, the same set of images containing a certain tumor and obtained with different image processing algorithms would be shown to several medical doctors. The doctors would be asked to rate the images depending on their ability to detect the tumor, and the best rated image would define which one of the algorithms is the best. These methods are still employed today, but they are very time-consuming and expensive, because a large number of observers and images are required to obtain reasonable conclusions. Furthermore, a similar study carried out in a different place may not be comparable just because the observers may be differently trained.
The alternative, standard approach is based on analyzing the resolution (or high contrast resolution) and noise (or low-contrast resolution) of sample images. Traditional methods use visual tests, whereas more recent methods involve measures based on Fourier analysis, such as the modulation transfer function (MTF) and the noise power spectrum (NPS). The drawbacks of these methods and some new alternative methods are the object of this section.
Another usual measure of image quality, the image contrast, is not so interesting from the point of view of QA, since this value can be modified by the user after the image has been taken by setting the center and the width of the window level. However, the contrast-to-noise ratio (CNR) or signal-difference-to-noise ratio (SDNR) is gaining importance in recent years and will be introduced in this section. Image artifacts (i.e., additionally displayed structures that confound the actual image of the object) are very interesting features from the point of view of QA, but there is such a wide variety of them for the different technologies that they had to be left out of the scope of this chapter. The reader is referred to specialized books for discussions on artifact detection and correction [19, 20]. At the end of this section, a brief discussion about the standard measure called signal-to-noise ratio (SNR) is given as a motivation for the last section of this chapter.
9.3.1 Noise
There are three main kinds of noise in medical images.
1.
Electronic noise is the signal captured by a system in the absence of X-ray exposure. As an example, Fig. 9.8a shows the electronic noise pattern of a flat-panel detector. The stripped pattern is called synchronous or row-correlated noise. It may be due to the black currents inside the circuits or to the mechanism of image acquisition, which is made by synchronized readings of entire rows in the detector.
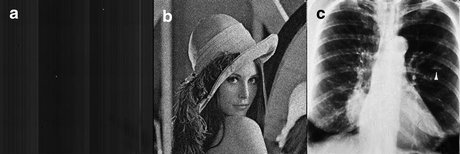

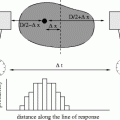
Fig. 9.8
Images showing an example of each kind of noise described in the text
2.


Quantum noise is the most traditional concept for the word “noise,” that is, stochastic variations due to the quantum nature of the image pixels. Figure 9.8b shows an image with a large amount of this kind of noise. Note that any apparently homogeneous region actually contains a spectrum of different grey values within its pixels.
Stay updated, free articles. Join our Telegram channel

Full access? Get Clinical Tree


