14 Nonimaging Physiologic Tests for Assessment of Lower Extremity Arterial Disease
Atherosclerosis of the peripheral arteries is recognized as a major cause of death and disability. It has been estimated that at least 8 million people in the United States alone have stenosis or occlusion of one or more of their lower limb arteries. Of this group, approximately 4 million are symptomatic, while the majority have asymptomatic disease but are at future risk for compromised ambulation, arterial ulceration, and the need for revascularization.1,2 Compounding these facts, recent investigations suggest that 30% of smokers, diabetic patients over age 50, and those over 70 years of age have peripheral arterial disease.3,4 As such, it is important to define test procedures that are capable of detecting and localizing arterial disease, documenting critical ischemia, determining the potential for healing, and defining the therapeutic options.
Historically, digital subtraction arteriography has been the method of choice for confirmation of arterial disease affecting the lower limb and has served as the standard for planning reconstructive surgery or endovascular procedures. This invasive procedure has an associated, albeit low, morbidity and may underestimate or overestimate the functional significance of eccentric lesions.5–7 Digital subtraction arteriography has been supplanted in many facilities by three-dimensional magnetic resonance or computed tomographic angiography. Regardless of the procedure used, it must be recognized that none of these modalities is capable of accurately defining the functional impact of multisegmental occlusive disease on tissue perfusion.
The indirect, noninvasive assessment of extremity arteries was introduced in the 1960s as a valued mechanism for confirmation and localization of arterial disease, determination of disease severity, and definition of response to therapy.8–14 Recognizing that significant blockage in the limb arteries resulted in reduced blood pressure and volume of blood in the tissues distal to the obstruction, investigators used a variety of diagnostic tools to document the physiologic alterations in pressure and flow. Although some of the earlier techniques are no longer used, indirect, physiologic testing remains the primary diagnostic method for assessment of lower limb arterial disorders in the modern vascular laboratory. These nonimaging studies are complemented with duplex sonography, which provides site-specific, quantitative diagnostic information.
Instrumentation
Directional, Continuous-Wave Doppler
Continuous-wave (CW) Doppler flowmeters can be used to detect the presence, quality, and direction of blood flow in the extremity arteries. As noted in Chapter 2, the principle of Doppler ultrasound is based on the difference between the transmitted frequency and the frequency of the returned signal (Doppler effect). When applied to blood flow this is, quite simply, the perceptible change in frequency of the sound beam proportional to the velocity of the reflected signal. This relationship is expressed in the Doppler equation
 (14-1)
where Δ f is the Doppler shift, the number 2 represents the round-trip travel time for the sound wave, V is the velocity of the moving red cells, f0 is the carrier Doppler frequency, cos θ is the angle of insonation, and c is the constant for the speed of sound in soft tissue.
It can be seen from the equation that the Doppler shift is directly proportional to the blood flow velocity, the transmitting Doppler frequency, and the cosine of the angle of insonation. One of the practical disadvantages of CW Doppler is that the angle must be assumed because this is a nonimaging modality. It should also be noted that the frequency shift will increase as the cosine of the angle of insonation approaches 0 (cosine of 0 = 1) and will decrease as the angle of the sound beam to blood flow approaches the perpendicular (cosine of 90 degrees = 0). For an angle of insonation greater than 90 degrees, the Doppler shift will be negative.
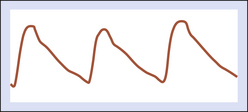
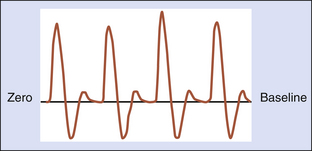
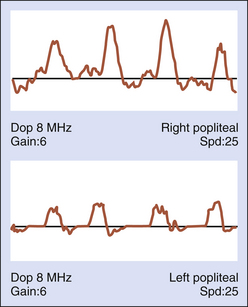
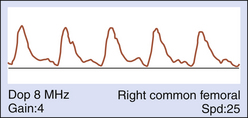
A normal, resting peripheral artery will demonstrate both forward and reverse flow components (Figure 14-1). This multiphasic flow pattern is most often displayed as an analog tracing. The graphic display represents the average of the frequency shifts that occur over time. Using a zero-crossing detector, blood flow direction can be displayed on a strip chart recorder and retained for later qualitative analysis. This device employs a frequency-to-voltage converter. The output of the voltage is proportional to the number of zero crossings. Every time the input signal crosses through zero in a positive direction, a tag is set. The tag is reset every time the signal crosses through zero in a negative direction. The Doppler frequency is estimated based on the number of times the tag is set every second. Several important deficiencies have been associated with zero-crossing detectors. Although the display is generally acceptable, it is very dependent on the signal-to-noise ratio, amplitude of the signal, and transient response.15 The information (mean frequency shifts) is not quantitative because the angle of insonation is not known. Because of this, low frequency shifts (low velocities) may be overestimated and high frequency shifts (high velocities) may be underestimated.
State-of-the-art CW Doppler flowmeters can detect blood flow velocity as low as 6 cm/sec. The blood flow velocity in critically ischemic limbs with multisegmental occlusive disease may be too low to detect using this technology.16 It may be difficult for the examiner to audibly differentiate ischemic low-velocity, minimally pulsatile, arterial flow from the returned venous signal. In such cases, alternative methods, such as those that evaluate tissue perfusion or tissue oxygen levels, may need to be employed to determine potential for healing.
Although CW Doppler is recognized as a valued tool for assessment of blood flow, its technical limitations must be considered. Distorted waveforms may be recorded unless care is taken to optimize the position and angle of the probe (Figure 14-2).
The signal may be attenuated by scar tissues or calcification of the arterial wall. Perhaps the most serious deficiency is the inability to control the sample volume depth (range ambiguity) in order to retrieve velocity information at a precise location within a designated vessel. This problem is overcome when pulsed Doppler is utilized for velocity assessment (see Chapter 17).
Continuous-Wave Doppler Analysis
As noted in Figure 14-1, a normal resting peripheral arterial signal is multiphasic with one or more diastolic components. The initial systolic forward flow is followed by rapid deceleration to a brief period of early diastolic flow reversal, resulting from high peripheral vascular resistance and a negative pressure gradient. A second phase of forward blood flow during diastole is pronounced when peripheral resistance is decreased (such as a warm limb). Diastolic blood flow can be decreased or absent during this phase when there is increased distal resistance and loss of compliance due to age-associated calcification and arterial wall stiffening. This can also be seen when the extremity is cold.
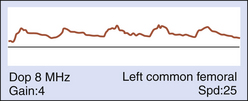
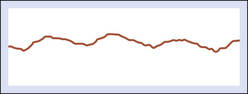
The absence of early diastolic flow reversal suggests a forward flow demand (Figure 14-3). This is most often associated with vasodilatation that occurs with flow-reducing arterial disease (>60% diameter-reducing lesions), but may result from exercise-induced vasodilatation or increased body temperature.
With intrinsic disease, arterial pressure is higher proximal to the site of narrowing and lower distally. The reduction in distal pressure is accompanied by a loss of kinetic energy distal to the stenosis. With disease progression, there is further loss of energy and pressure, which results in increased vasodilatation. When flow-limiting stenosis is proximal to the site of Doppler interrogation, the waveform will be characterized by delayed systolic upstroke as a consequence of the increased time required for blood to bypass the stenosis through collateral channels. As severity of disease increases, vascular resistance decreases and the waveform morphology is characterized by delayed diastolic runoff (bowing to the right) and loss of amplitude (Figure 14-4).
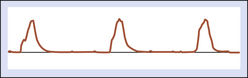
The profile of a stenosis is characterized by the alterations in frequency shift and Doppler waveform morphology. Proximal to a severe stenosis, the waveform may appear normal if the lesion is well collateralized. When there are no collateral pathways, a “thump-like” signal with reduced amplitude, and no runoff, will be recorded (Figure 14-5).
Identification of flow-limiting disease and classification of disease severity may be enhanced by quantitative Doppler waveform analysis. Historically, several methods of waveform analysis have been employed, including calculation of a pulsatility index (PI), inverse damping factor, pulse wave transit time, acceleration time (AT), and the Laplace transform analysis. While each of these has met with varying levels of success and acceptance, only the PI and AT have retained popularity. The peak-to-peak PI (peak 1 frequency shift − peak 2 frequency shift / mean frequency shift) relates the peak-to-peak frequency shift (velocity) to the integrated mean frequency shift (velocity) and is independent of the angle of insonation. The relationship of peak-to-peak frequency shift and the integrated mean frequency shift is illustrated in Figure 14-6.
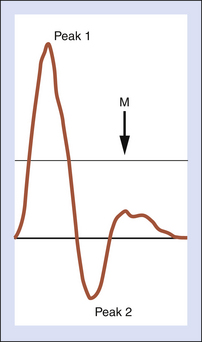
In the normal lower limb, the PI values increase from proximal to distal. The PI of the common femoral artery is normally greater than 5 and most often is between 6 and 7, whereas the popliteal artery has a PI between 7 and 9, and the posterior tibial artery PI range is 12 to 16.17 In the presence of a pressure-flow-reducing lesion, the reverse flow component of the Doppler waveform is absent (peak 2) and the PI decreases. Comparing their results to intra-arterial pressure measurements, Thiele and colleagues18 demonstrated that a common femoral artery PI greater than 4 was predictive of a normal aortoiliac segment. In the absence of superficial femoral artery occlusive disease, a common femoral artery PI less than 4 was highly predictive of flow-limiting aortoiliac disease.
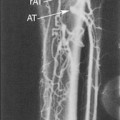
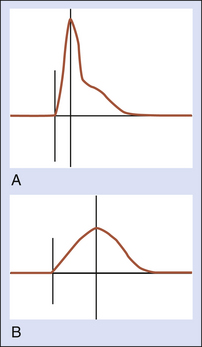
Hemodynamically significant disease proximal to the common femoral artery can be identified by measurement of the systolic AT on the Doppler waveform (Figure 14-7). Normally, common femoral artery systolic rise time is rapid (<122 msec). Flow velocity is slower when blood must move around an area of blockage through high-resistance collateral pathways. In such cases, the systolic rise time is extended to greater than 144 msec. It is important to optimize the Doppler signal and angle of insonation because false-positive results are likely when the Doppler angle is greater than 60 to 70 degrees and the waveform is dampened. The signal will also be attenuated when cardiac output is reduced.
Plethysmography
Air-Calibrated Plethysmography
Changes in limb volume occur with passage of the arterial pulse pressure wave from the aorta into the arterial tree of the lower extremities. In systole, blood moves rapidly from the main arterial branches into the microcirculation, with a resultant increase in tissue perfusion and limb volume. During diastole, the pressure in the main arterial tree diminishes with subsequent reduction in limb volume. The momentary changes in limb volume can be documented with PVR. This testing modality employs pneumatic cuffs that are applied segmentally on the limbs (Figure 14-8).
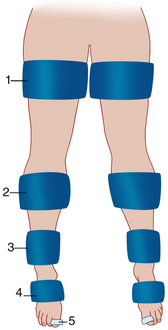
The cuffs serve as sensors for arterial flow and alterations in limb volume. The cuffs are calibrated by injecting air into the cuff bladder to achieve a cuff pressure approximating 65 mm Hg and a volume sufficient to ensure that the cuff bladders are snug against the skin.19
During systole, air in the cuff bladder surrounding the limb segment is displaced as a consequence of limb expansion. In diastole, arterial inflow decreases and the pressure and volume of air in the cuff bladder is stabilized. These changes are sensed by a pressure transducer and translated into an analog recording that displays the amplitude and contour of the pulse wave. Although the frequency response of some devices approximates only 20 Hz, this has been shown to be sufficient for demonstration of the high-frequency components expressed in the arterial pulse pressure wave.20
Pulse Volume Waveform Analysis
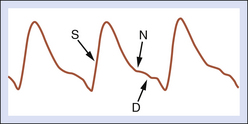
The analog pulse volume wave contour parallels the intra-arterial pressure contour. The normal wave exhibits rapid systolic upstroke (anacrotic limb), a sharp systolic peak, a reflected wave (dicrotic notch) on the deceleration slope, and gradual runoff in diastole (Figure 14-9). The reflected wave signifies elevated peripheral resistance, which is expected in the normal resting muscular bed of the lower limb. Vascular resistance is reduced in response to any situation that elicits an increased flow demand (e.g., significant arterial stenosis or occlusion, exercise, or inflammation). With a pressure-flow-reducing lesion (>50%-60% diameter reduction) proximal to the recording cuff, systolic acceleration is delayed, the systolic peak becomes rounded, the dicrotic notch is absent, and the rate of runoff is reduced (Figure 14-10).
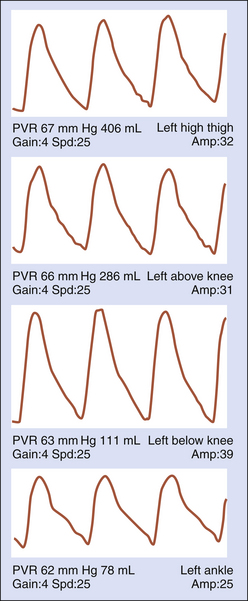
In situations where there is abundant flow in the tissue bed (e.g., well-developed collaterals, arteriovenous fistulas or malformations), the pulse volume waveform will demonstrate higher amplitude compared to the more proximal waveform recordings. For example, in the absence of flow-limiting disease in the superficial femoral artery, the amplitude of the PVR waveform recorded at below-knee level will be higher than the amplitude of the thigh and ankle waveforms (Figure 14-11). This is the result of the additional volume of flow to the thigh and knee region through the profunda femoris branches and the geniculate system. Absence of the amplitude increase suggests superficial femoral artery occlusion. Distal superficial femoral artery obstruction should be suspected if the below-knee waveform demonstrates no increase in amplitude and the waveforms recorded at thigh level are normal. In addition, it should be noted that waveform amplitude can be affected by blood pressure, vasomotor tone, ventricular stroke volume, patient positioning, edema, and/or obesity.
Photoplethysmography
Photoelectric plethysmography is used primarily for assessing the quantity of blood in the cutaneous circulation. This technology employs a light-emitting diode that transmits infrared light into the skin. A phototransistor detects the reflected signal from red blood cells coursing through the microcirculation in the tissues beneath the sensor. The changes in electrical resistance within the phototransistor are expressed as a waveform that displays signals throughout the cardiac cycle that are proportional to the number of red blood cells in the tissues.21 The PPG sensor is attached to the skin by using clear, double-stick tape or a tension-sensitive clip that houses the sensor. It is important to avoid attachment techniques that have potential for increased pressure on the sensor (clips that are applied over the sensor and Velcro straps or tape used to secure the sensor to the skin or digit) as this will force blood away from the tissue beneath the sensor. Although, in the truest sense of the term, PPG does not measure limb or digit volume changes due to alterations in blood flow, the pulse waveform morphology closely resembles the pulse volume waveforms recorded with PVRs (Figure 14-12).