Intracranial Hemorrhage
- Arash Meshksar
- Wayne S. Kubal
Nontraumatic Intracranial Hemorrhage
Initial Diagnosis
Although many cases of intracranial hemorrhage (ICH), including intra-axial and extra-axial hemorrhage, are due to trauma, this discussion will be limited to atraumatic intracranial hemorrhage. Abrupt onset of neurologic symptoms in any patient should be considered to be of vascular origin until proven otherwise. It is not possible to differentiate ischemic from hemorrhagic accidents based on the patient’s symptoms alone. Neuroimaging is thus an essential initial step not only for determining the initial diagnosis, but also for determining the type, location, and underlying mechanism in patients with intracranial hemorrhage. Computed tomography (CT) and magnetic resonance imaging (MRI) are both very sensitive for detection of intracranial hemorrhage; however, due to easier accessibility, lower cost, and shorter imaging time, CT scan is preferred for the initial evaluation of patients with suspected acute hemorrhage. The task of the radiologist is to diagnose the hemorrhage based on initial noncontrast CT (NCCT) or MRI, analyze the pattern of hemorrhage, and make recommendations for further workup. Performing these tasks efficiently and accurately can improve patient outcome and can optimize work flow in a busy emergency radiology section.
The first point of analysis for the radiologist is to determine the location of the intracranial hemorrhage. Specifically, the radiologist needs to determine whether the hemorrhage is primarily a subarachnoid hemorrhage (SAH) or intraparenchymal hemorrhage (IPH). Although there is some overlap in the etiologies and workup of SAH and IPH, we will consider them separately.
Subarachnoid Hemorrhage
Subarachnoid hemorrhage is bleeding into the subarachnoid space. Atraumatic SAH usually occurs because of ruptured aneurysms. Nonaneurysmal perimesencephalic hemorrhage, vascular malformation, or less commonly vasculitis and vessel dissection are additional causes of non-traumatic intracranial hemorrhage one should consider. There is a wide geographic variation in the incidence of atraumatic SAH. China reports an incidence of 2 cases per 100,000 population per year, whereas Finland reports the highest incidence at over 20 cases per 100,000 per year. In the United States the incidence is 9.6 to 14.0 cases per 100,000 according to different reports. That incidence translates to approximately 30,000 new cases annually. Risk factors for SAH include female sex, hypertension, smoking, alcohol use, and the abuse of drugs such as cocaine. It is the responsibility of the radiologist to meticulously search for the signs of SAH in patients investigated for headache and also determine the cause of the hemorrhage as early as possible. Computed tomography remains the cornerstone of diagnosis, having a sensitivity of approximately 98% to 100% in the first 12 hours after hemorrhage. Computed tomography sensitivity declines after this period with a sharp decline after 5 to 7 days. Lumbar puncture is often required in these patients to show xanthochromia and confirm the diagnosis. Negative predictive value of absence of xanthochromia to rule out SAH has been shown to be about 99%.
Magnetic resonance imaging can be an alternative to lumbar puncture in potential SAH cases with negative CT scan results. Bleeding into the subarachnoid space causes a change in relaxation time of the cerebral spinal fluid (CSF), which in turn causes T1 signal change. This change also causes insufficient nulling of the CSF signal by fluid-attenuated inversion recovery (FLAIR) and consequent hyperintensity of subarachnoid space. Even though the sensitivity of FLAIR imaging has been reported to be nearly the same as CT, the specificity remains lower than lumbar puncture for excluding SAH. Other disease entities such as meningitis, leptomeningeal spread of malignant disease, and meningeal enhancement after contrast administration also lead to increased subarachnoid signal on FLAIR sequence.
Aneurysm
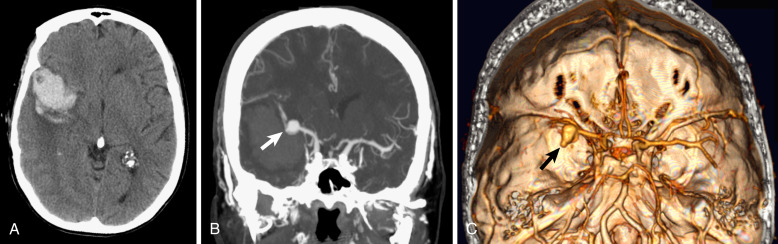
Approximately 80% of patients with atraumatic SAH have aneurysm as the cause of hemorrhage ( Fig. 4-1 ). The most common presenting symptom is headache that is usually described by the patient as the “worst headache of life.” Other symptoms include vomiting, meningismus, and altered level of consciousness or even coma. Some patients experience milder symptoms (usually milder headache and nausea/vomiting) 2 to 8 weeks before the overt SAH. These symptoms can be caused by minor hemorrhages from an aneurysm leak, which is called a sentinel or warning bleed . Review of several large studies showed that about 20% among 1752 patients with SAH in those studies had a history of headache before the SAH event. Only 1% of patients presenting to the emergency department (ED) with headache have SAH. A high degree of suspicion and proper screening in patients with headache can detect those with a sentinel bleed, a potentially lifesaving diagnosis in this group of patients.
An accurate diagnosis of SAH based on initial CT scan requires knowledge of the common locations where the blood may accumulate after the incident. These areas include dependent areas of the CSF space, including the suprasellar cistern (aneurysm of anterior communicating artery), the deep sulci adjacent to the interhemispheric fissure (aneurysms of distal anterior cerebral artery), the interpeduncular cistern (aneurysms of posterior circulation), and the Sylvian fissure (aneurysm of middle cerebral artery [MCA] bifurcation). Sometimes the aneurysms can be visualized as lucent lesions within the hyperdense hemorrhagic material in CSF space or as curvilinear calcifications.
The description of the location of aneurysms mentioned earlier involves saccular aneurysms, which are the most common. It should be noted that infectious aneurysms (mycotic aneurysms) could also be the cause of SAH. These aneurysms can be located anywhere in the cerebral vasculature and can be suspected according to the patient’s clinical setting and imaging findings.
Patients who survive the initial few hours after SAH are threatened by intracranial complications such as brain ischemia secondary to vasospasm, rebleeding, and hydrocephalus. A CT grading system known as the Fisher scale ( Table 4-1 ) has been used for prediction of cerebral vasospasm in patients with SAH.
| Grade | Computed Tomography Appearance of Subarachnoid Hemorrhage |
|---|---|
| 1 | No visualized blood |
| 2 | Visualized layers of blood less than 1 mm thick |
| 3 | Visualized layers or focal clots more than 1 mm thick |
| 4 | Any thickness with intraventricular or intraparenchymal hemorrhage |
The odds ratio of cerebral vasospasm after SAH is estimated to be in orders of 1.2, 2.2, and 1.7 for grades 2, 3, and 4 compared to grade 1, respectively. Thus SAH patients with focal thick clots in the subarachnoid space or concomitant intraventricular hemorrhage (IVH)/IPH are at increased risk for vasospasm. Although the case fatality has decreased in industrialized nations over the past 25 years, SAH still carries a poor prognosis. Mortality rates vary widely across different reports, ranging from 8% to 67%. The median mortality rate from epidemiologic studies in the United States has been 32% versus 43% in Europe and 27% in Japan. Morbidity, including lifestyle restriction, persistent dependence, and cognitive impairment, ranges from 8% to 20% in survivors. The goal is early treatment of the source of hemorrhage.
Nonaneurysmal Perimesencephalic Hemorrhage
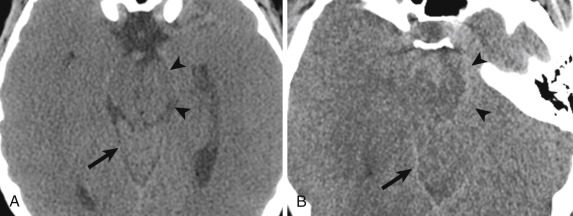
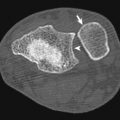
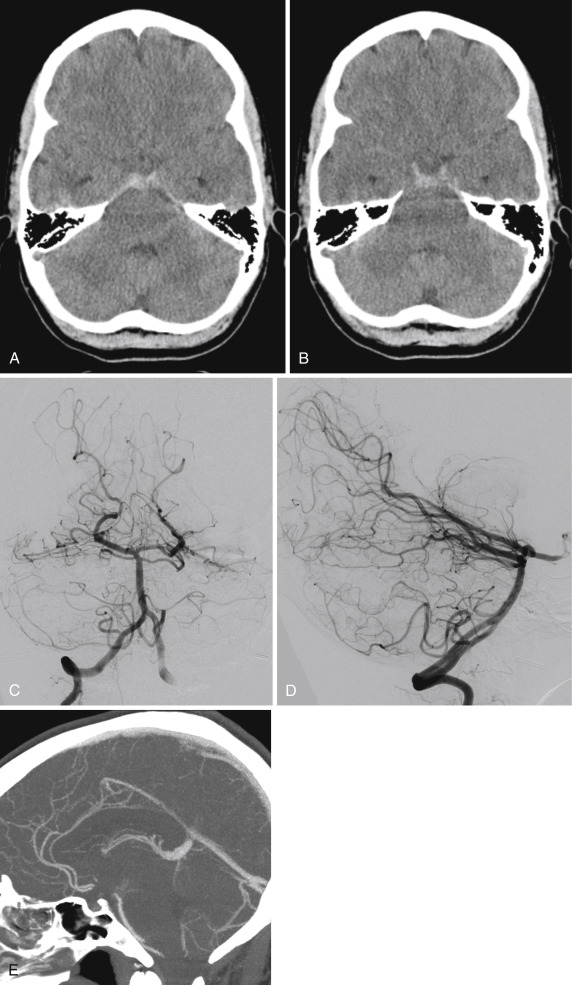
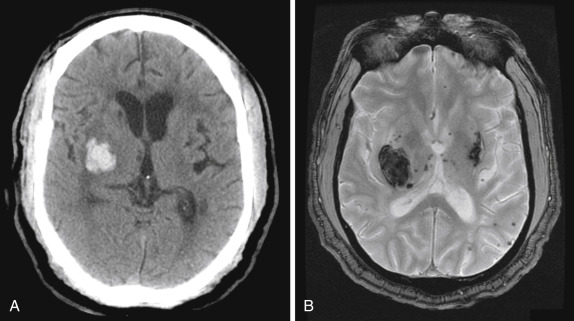
Nonaneurysmal perimesencephalic hemorrhage (NAPH) accounts for about 10% of SAH cases. The hemorrhage is characterized by accumulation of blood predominantly around the brainstem mostly ventral to the midbrain or pons or less commonly in the quadrigeminal plate cistern ( Fig. 4-2 , A and B ). The diagnosis requires the exclusion of aneurysms or any other source of bleeding (see Fig. 4-2 , C and D ). The symptoms and clinical course in these patients are more benign than with aneurysmal rupture. Rebleeding and ischemia do not usually occur. The cause of the NAPH has not been fully determined. Some clues suggest that the origin of bleeding is venous as opposed to arterial in aneurysms. It has been shown that patients with this form of hemorrhage have an aberrant pattern of deep cerebral venous drainage much more frequently than patients with aneurysmal causes. Perimesencephalic hemorrhage often follows physical exertion. Some investigators believe that increased intracranial venous pressures secondary to increased intrathoracic pressure during exercise causes the hemorrhage. There is controversy regarding the best method to exclude an aneurysm as the etiology of perimesencephalic hemorrhage. Many experts advocate use of catheter angiography for this purpose. The remaining 10% of SAH cases are caused by a variety of pathologic conditions such as arteriovenous malformation (AVM), dissection, vasculitis, cavernous hemangioma, and unspecified causes.
Workup of Subarachnoid Hemorrhage After Initial Diagnosis
After the diagnosis of SAH has been made, the imaging workup should be directed toward determining the cause of the hemorrhage and providing information for subsequent treatment. Given the preponderance of aneurysmal ruptures as the cause of SAH (80% of cases), the next step in imaging workup is directed toward vascular imaging with the goal of detecting and defining possible intracranial aneurysm or aneurysms. Aneurysms may be detected with catheter digital subtraction angiography (DSA), computed tomographic angiography (CTA), or magnetic resonance angiography (MRA). Although DSA is still the gold standard, CTA is most commonly used for the initial evaluation. Magnetic resonance angiography has a limited role in the initial vascular evaluation of SAH patients because of longer acquisition time, higher cost, susceptibility to patient movement, and lower sensitivity. The sensitivity of MRA has been reported to be 74% to 98% for aneurysms larger than 3 mm.
The emergence of three-dimensional (3-D) rotational DSA and flat panel detectors as the newer technologies integrated into the DSA technique has made DSA even more sensitive in detecting small aneurysms that otherwise would not be detected because of overlapping vessels. Digital subtraction angiography provides the highest spatial resolution (0.125-mm pixel size) and is still the best modality for studying aneurysm relationship to the parent artery and to the neighboring perforator arteries, as well as measurement of the aneurysm neck and dome.
In many centers CTA has replaced DSA as the initial imaging modality. Computed tomography angiography has the advantage of being quick to obtain while the patient is in the CT scanner for initial screening and allows for interpretation by the emergency radiologist before activating either the endovascular or neurosurgical services. The accuracy of CTA has improved over the last few years with improvements in CT technology. The advent of multirow detector CTA has yielded a very good spatial resolution with a maximum pixel size of 0.35 mm. Administration of an average 50 to 80 mL of contrast medium is usually sufficient to obtain diagnostic-quality images. Computed tomography angiography has also been shown to be very accurate in providing information about the configuration of the aneurysm to allow for planning of endovascular therapy ( Fig. 4-3 ; see Fig. 4-1 ). One important advantage of CTA over DSA is the ability to show the osseous and extraluminal structures, which helps the surgeon with surgery planning. It also configures the shape and size of the aneurysm dome and neck very well, which can help with planning endovascular treatment. Computed tomography angiography has an approximate overall sensitivity of 98% in detecting aneurysms as measured in a meta-analysis of multiple studies conducted in 2011. One important limitation of CTA is detection of aneurysms smaller than 3 mm located near the skull base. For detecting aneurysms smaller than 3 mm the sensitivity is reported to be between 77% and 86% in different studies.
To reduce the risk of missing aneurysms near the skull base, bone subtraction algorithms have been implemented that include simple subtraction of unenhanced from enhanced data and also selective bone removal or “matched masked bone elimination.” These algorithms enhance visualization of aneurysms near the skull base and bony structures. A preliminary image called bone mask is acquired before contrast administration. After the contrast administration and acquisition of all images, the bone mask is spatially coregistered with the contrast-enhanced image and then subtracted from it. The final result is contrast-enhanced image with unenhanced structures, including bone, removed from it. The penalty is increased radiation dose to the patient because of the need to acquire precontrast and postcontrast images.
Recently the advent of dual-energy multirow CT scanners has enabled direct bone removal, hence obviating the need for additional radiation for acquiring bone mask and also obviating the problems with misregistration of precontrast and postcontrast images caused by patient movement. Dual-energy CT uses two orthogonally mounted tube arrays and detectors that operate simultaneously and can be set to different tube potentials (i.e., 80 and 140 kilovolts peak [kVp]), allowing CT acquisition with two different energy levels at the same time. The resultant data sets can be reformatted with the scanner software to extract maps of contrast-enhanced material without complex image registration. Some recent small studies have shown that dual-energy CTA is more sensitive than the previous generation of CT scans in detecting small skull base aneurysms, but the sensitivity is still lower than DSA.
Reformatted CTA images in coronal and sagittal projections should be routinely obtained from the axial data set (see Figs. 4-1 and 4-3 ). In addition, 3-D reconstructed images targeted to areas of clinical concern can be very useful in clearing equivocal findings or providing spatial information about the aneurysms detected (see Fig. 4-3 , C ). Aneurysms usually arise at arterial branch points near the circle of Willis. Common supratentorial sites for aneurysms include the anterior communicating artery, the bifurcation of the MCA, and the posterior communicating artery. In the posterior fossa the most common site is the tip of the basilar artery. Each of these sites should be thoroughly interrogated by the interpreting radiologist. It is also important to carefully scrutinize the entire study even after finding a single aneurysm. Multiple aneurysms have been detected in up to 20% of patients presenting with nontraumatic SAH. When multiple aneurysms are detected, careful examination of the contour of each aneurysm may show a focal irregularity or “Murphy’s tit” indicating the likelihood of recent aneurysmal rupture.
When evaluating the cerebral vessels it is also important to evaluate for a possible AVM. Arteriovenous malformations more commonly present with IPH or a mixed pattern of SAH and IPH/IVH rather than pure SAH ( Fig. 4-4 ). After completing examination of the intracranial arteries, the radiologist should also evaluate the venous sinuses for patency. Venous sinus thrombosis is a potential, albeit unusual, cause of SAH ( Fig. 4-5 ).
If careful analysis of the CTA shows no evidence for a vascular abnormality, the possibility of NAPH should be considered. If the SAH is limited to the basilar cisterns, the initial CTA shows no vascular abnormality, and the patient has a benign clinical course without rebleeding or vasospasm, some authors believe that the patient probably does not need further angiographic workup. Many centers are more conservative, nearly always performing a second vascular imaging study. In patients with widespread SAH or a more complicated clinical course, repeat vascular imaging with either CTA or catheter angiography has been shown to be of value. Combining eight angiographic series between 1985 and 1996 demonstrated a 17% yield of previously undiagnosed aneurysm on the second angiogram. Even a third examination may show aneurysms undetected on the prior studies.
Intraparenchymal Hemorrhage
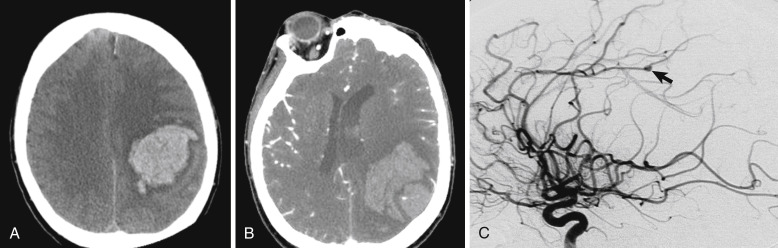
Intraparenchymal hemorrhage is bleeding into the parenchyma of the brain. Intraparenchymal hemorrhage may extend into the ventricles. It is not possible to differentiate ischemic from hemorrhagic accidents based on the patient’s symptoms alone. Symptoms such as systolic blood pressure above 220 mm Hg, vomiting, sudden progression of symptoms, severe headache, decreased level of consciousness, and coma favor intracranial hemorrhage rather than ischemia; however, they are not specific. Intraparenchymal hemorrhage is the second most common cause of stroke after ischemic stroke and more than twice as common as SAH. According to a recent meta-analysis, the incidence of IPH is 24.6 per 100,000 persons, which has not decreased in the last 3 decades. Asian populations have a two times higher rate of IPH compared to other ethnic groups. Each year 40,000 to 50,000 people in the United States present with IPH. The rate is expected to double during the next 50 years in part as a result of the increasing age of the population. Intraparenchymal hemorrhage is more likely to result in death or major disability than cerebral infarction or SAH. The case fatality rate of patients with IPH in 1 month after the accident approaches 40%.
Intraparenchymal hemorrhage may result from a large and heterogeneous group of causes, including primary causes such as hypertension and amyloid angiopathy or secondary causes such as AVM, intracranial aneurysms, cavernous angiomas, dural venous sinus thrombosis, intracranial neoplasms, coagulopathy, vasculitis, drug use, and hemorrhagic ischemic stroke. Hypertensive and amyloid angiopathy causes account for 78% to 88 % of IPH cases; however, underlying vascular abnormalities must always be considered in the appropriate clinical circumstances because of the high risk for recurrent hemorrhage and the availability of treatment options.
Computed tomography scan is very sensitive for detecting acute IPH and is considered the procedure of choice for initial imaging because of easy availability, fast imaging, and low cost compared to MRI. In the hyperacute and acute phases of IPH, CT shows a well-defined hyperdense lesion compared with the adjacent brain parenchyma ( Fig. 4-6 , A ). The hematocrit, hemoglobin content, and degree of blood clot retraction determine the density of the lesion. In patients with severe anemia, reduced concentrations of hemoglobin causes the acute hematoma to appear less hyperdense than expected. In late subacute phase, progressive lysis of the red blood cells and proteolysis of the hemoglobin result in decreasing density of the lesion. The hematoma may appear isodense to the adjacent brain parenchyma. The hematoma is then progressively resorbed, and in the chronic phase it is typically seen as a smaller hypodense defect.
Magnetic Resonance Imaging Appearance of Hemorrhage
The appearance of hematoma on MRI depends on the state of hemoglobin, the magnetic field strength, and the pulse sequence used. The breakdown products of hemoglobin have different oxidation states of iron and, as such, have different magnetic properties. In the hyperacute stage the hemoglobin is still oxygenated and has no unpaired electrons. It is diamagnetic in this stage. The hematoma is isointense or mildly hyperintense on T1-weighted MRI and hyperintense on T2-weighted MRI, owing to the hemoglobin content. In the acute stage the hemoglobin is deoxygenated. Deoxyhemoglobin has few unpaired electrons and is paramagnetic. Consequently, the hemorrhage is isointense or hypointense on T1-weighted and hypointense on T2-weighted sequences ( Fig. 4-7 ). In the early subacute phase, methemoglobin is paramagnetic and confined to the intracellular compartment, with a magnetic gradient between the intracellular and the extracellular compartments; the hemorrhage is hyperintense on T1-weighted and hypointense on T2-weighted MRI. In the late subacute stage, methemoglobin is released by lysis of the red blood cells. This cancels the magnetic gradient between the intracellular and extracellular compartments and causes the hemorrhage to appear hyperintense on both T1- and T2-weighted MRI. Finally, in the chronic phase, because hemosiderin has many unpaired electrons and is superparamagnetic, the hemorrhage is isointense or hypointense on T1- and T2-weighted MRI. FLAIR sequence also shows the same characteristics of T2-weighted sequences. Gradient-recalled echo (GRE) sequence is a T2∗-weighted sequence that is sensitive to static magnetic field inhomogeneity or to the T2∗ characteristics of the tissue. Gradient-recalled echo detects the paramagnetic effects of deoxyhemoglobin and methemoglobin. Gradient-recalled echo shows a core of heterogeneous signal intensity in hyperacute hematoma, reflecting the most recently extravasated blood that may still contain significant amounts of diamagnetic oxyhemoglobin. A hypointense rim surrounds the core that represents part of the hemorrhage that has had time to become more fully deoxygenated and paramagnetic. Table 4-2 summarizes the appearance of hematoma in CT and MRI according to the stage of the lesion in chronologic sequence.
| Age/Stage | CT Scan | T1-Weighted MRI | T2-Weighted and FLAIR MRI | GRE MRI |
|---|---|---|---|---|
| Hyperacute (<12 hr) | Hyperdense | Isointense or mildly hyperintense | Hyperintense | Hypointense rim |
| Acute (12 hr to 2 days) | Hyperdense | Isointense or hypointense | Hypointense | Hypointense rim growing toward center |
| Early subacute (2-7 days) | Hyperdense | Hyperintense | Hypointense | Hypointense |
| Late subacute (8 days to 1 mo) | Isodense | Hyperintense | Hyperintense | Hypointense |
| Chronic (>1 mo) | Hypodense | Isointense or hypointense | Hypointense | Hyperintense core surrounded by hypointense rim |
The GRE sequence can also detect microbleeds that may not be visible on CT scan. Microbleeds are generally defined as round, punctate, hypointense foci less than 5 to 10 mm in size in brain parenchyma. They can be seen in 80% of patients with primary ICH (hypertension and amyloid angiopathy), 25% of patients with ischemic stroke, and 8% of elderly people. They correspond to hemosiderin-laden macrophages lying adjacent to the vessels and indicate prior extravasation of blood. Microbleeds have been suggested to be predictors of bleeding-prone angiopathy (see Fig. 4-6 , B ). Some studies have shown that patients with microbleeds may be at increased risk for ICH after anticoagulation or thrombolytic treatment; however, this is controversial and not confirmed in all studies.
Hematoma expansion occurs in approximately one third of acute primary IPH cases and is associated with high mortality, disability, and functional deterioration. An accurate and reliable method for predicting hematoma expansion is thus needed to determine the prognosis and further clinical management. Contrast material extravasation within the hematoma visualized in CTA, called the spot sign , is one of the most promising predictors of hematoma expansion. A recent multicenter prospective study, Predicting Hematoma Growth and Outcome in Intracerebral Hemorrhage Using Contrast Bolus CT (PREDICT), showed that the spot sign is an independent predictor of hematoma expansion in patients with IPH. Some investigators devised a spot sign scoring system that includes measurement of the number, size, and attenuation of the visualized spots. Table 4-3 shows the suggested scoring system. Spot sign scores of 0, 1, 2, and 3 independently predict a 2%, 33%, 50%, and 94% risk for hematoma expansion, defined as more than a 30% or 6-mL increase in hematoma volume. Radiologists should be careful not to include preexisting calcified areas as a spot sign. They are also advised to evaluate the source axial images carefully to avoid overcounting the spots because of contiguous vessel or enhancing parts falsely projecting as separate spots in different slices.
| Spot Sign Characteristics | Points |
|---|---|
| Number of Spot Signs | |
| 1-2 | 1 |
| ≥3 | 2 |
| Maximum Axial Dimension | |
| 1-4 mm | 0 |
| ≥5 mm | 1 |
| Maximum Attenuation | |
| 120-179 | 0 |
| ≥180 | 1 |
In all cases of ICH, clinical and imaging investigation should be made to rule out secondary causes such as AVMs, tumors, moyamoya disease, and cerebral vein thrombosis. Clinical symptoms suggesting a secondary cause include prodrome of headache or neurologic deficits before the onset of the accident or other clinical findings that suggest an underlying disease. Imaging findings suggestive of secondary causes include the presence of SAH and ICH at the same time, unusual shape of the hematoma, increased edema compared to the size of the hematoma, and visualization of a masslike lesion or abnormal vessels.
Magnetic resonance imaging including MR angiogram and venogram or CT with CT angiogram and venogram is reasonably sensitive at identifying secondary causes of hemorrhage. A catheter angiogram may be considered if clinical suspicion is high or noninvasive studies are suggestive of an underlying vascular cause. We will discuss each of the causes of ICH, including their pathophysiology and imaging appearance. We will then offer an imaging algorithm based on initial CT findings and clinical data.
Hypertension
Hypertensive ICH accounts for over 50% of cases. Hemorrhage occurs most commonly in the basal ganglia (55% to 62% within the lentiform nucleus and 10% to 26% within the thalamus) (see Fig. 4-6 ). Less common locations include the pons (5% to 10%) and the cerebellar hemispheres (6% to 10%). Over 90% of the patients are older than 45 years of age. Recently there has been a decrease in the incidence of hypertensive hemorrhage, likely secondary to more effective and more widespread control of systemic hypertension. The bleeding results from the rupture of small penetrating arteries. In 1868 Charcot and Bouchard described the cause of the bleeding as rupture of small points of dilatation in the walls of small arterioles (microaneurysms). Modern electron microscopic studies suggest that most of the bleeding occurs at or near the bifurcations of the affected arteries where degeneration of the media and smooth muscle causes these microaneurysms. Chronic hypertension also causes lipohyalinotic changes (or fibrinoid necrosis) in penetrating arteries that reduce the arterial wall compliance and increase the likelihood of rupture.
The imaging appearance on CT scan is a typical round dense mass in the basal ganglia and/or thalamus (see Fig. 4-6 ). Intraventricular hemorrhage can occur and is most commonly associated with thalamic hemorrhage. Intraventricular hemorrhage can lead to hydrocephalus because of impairment of the CSF circulation. Angiography studies, including CTA, MRA, and DSA, usually do not show any lesion in this type of hemorrhage, and thus performance of any of them is not recommended in typical hypertensive ICH patients.
Cerebral Amyloid Angiopathy
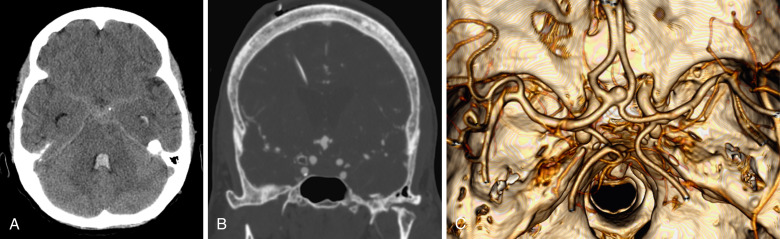
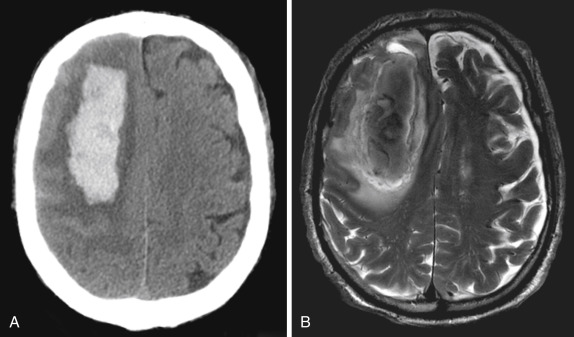
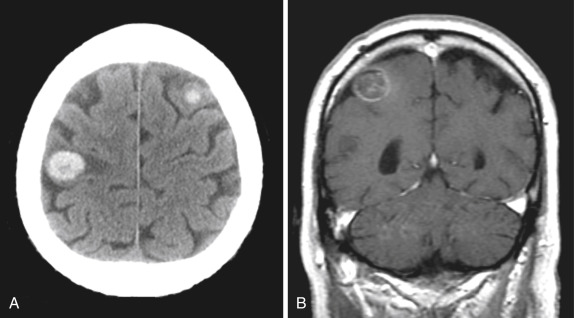
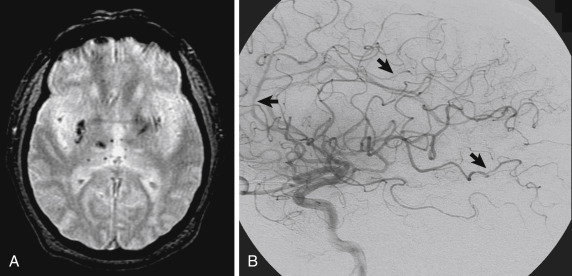
Although hypertension is the most common cause for IPH in elderly patients, cerebral amyloid angiopathy (CAA) has been implicated in as many as 15% of patients older than 60 years of age and almost 20% of patients 70 years of age and older ( Fig. 4-8 ). The hemorrhage results from the rupture of small- and medium-sized arteries. Deposition of β-amyloid protein in the vessel walls has been identified as a causative agent. This protein is essentially identical to the protein present within the senile plaques of Alzheimer disease. Possibly the deposition of these proteins within the aging brain predisposes to both ICH and dementia. Indeed, Alzheimer disease or senile dementia of the Alzheimer type is commonly observed in these patients. The locations of the bleeds are lobar, cortical, or subcortical as opposed to the basal ganglia location in hypertensive IPH. Most commonly, bleeds are seen in the frontal lobe, followed by the parietal, occipital, and temporal lobes. Hemorrhage into the deep gray matter or cerebellum is uncommon. Cerebral amyloid angiopathy should be considered as the cause of IPH in patients older than 55 years of age with hemorrhage in the lobar or cortical-subcortical location and evidence of prior macrohemorrhages or microhemorrhages. Patients with CAA are at substantial increased risk for recurrent hemorrhage, estimated at approximately 10% annually. On CT it is common to see multiple microhemorrhages and hematomas of varying ages. Magnetic resonance imaging including GRE and/or susceptibility-weighted imaging (SWI) is recommended as a further step in evaluation of patients suspected of CAA. Magnetic resonance imaging shows both acute and old hemorrhagic lesions that may include macrohemorrhages, microhemorrhages, and superficial siderosis in patients with CAA (see Fig. 4-8 ).
Susceptibility-weighted imaging is a 3-D, velocity-compensated, GRE sequence that combines magnitude (used in conventional GRE) with phase information to increase the visibility of microhemorrhages or small pathologic vessels. Microhemorrhages contain paramagnetic hemosiderin that causes large variations in local magnetic field and a local reduction in T2∗. Susceptibility-weighted imaging, with its unique sensitivity to blood products and hemorrhage, is well suited to detect imaging changes consistent with CAA. It should be noted that sensitivity of T2∗-weighted MRI to paramagnetic substances other than hemosiderin, including calcifications and iron deposits, gives rise to findings that resemble microhemorrhages. These artifacts are likely to be more of a problem when using more sensitive sequences such as SWI. Angiographic studies typically have normal results in patients with CAA. Once a diagnosis of CAA is made based on MRI findings, there is no need for further imaging workup in the initial phase of screening.
Arteriovenous Malformations
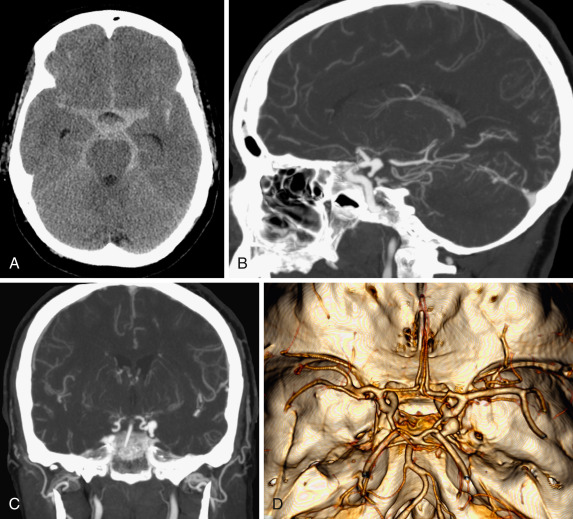
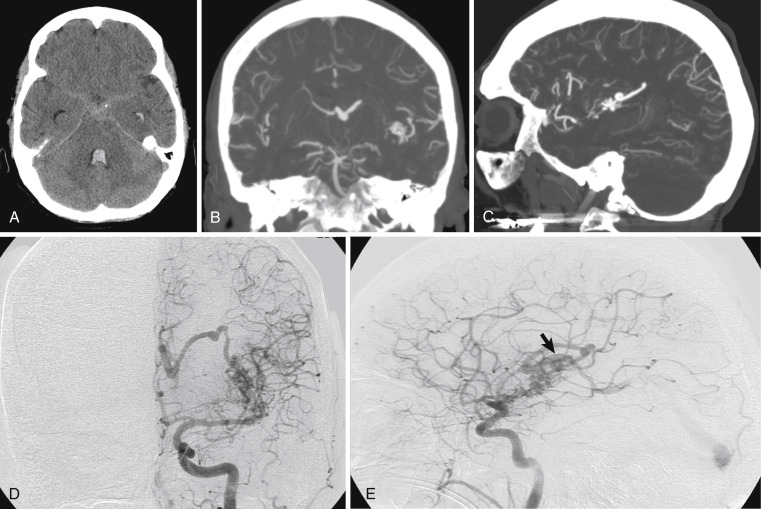
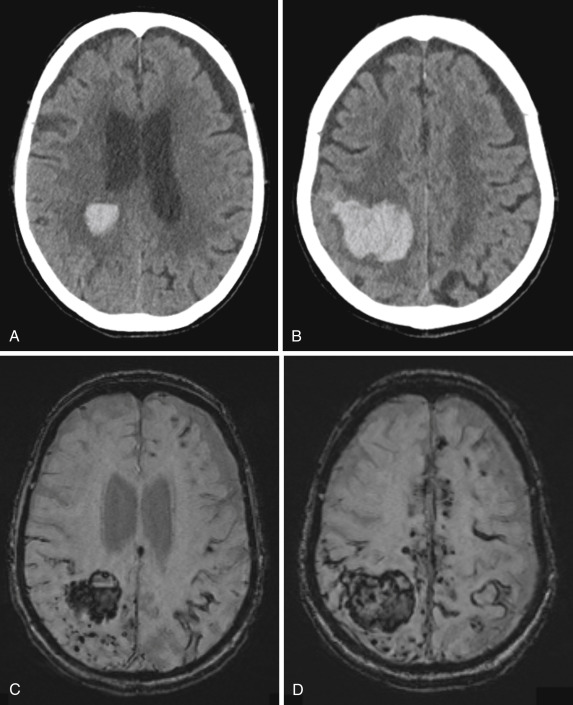
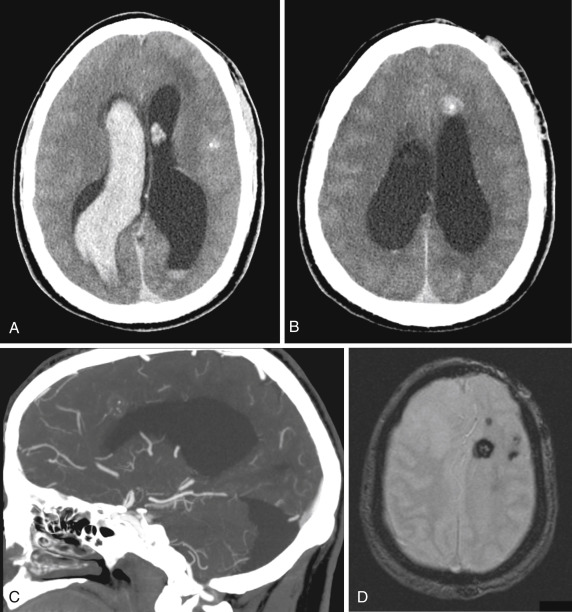
Brain AVMs are vascular malformations with arteriovenous shunting with no intervening capillary bed. Arteriovenous malformations consist of feeding arteries, a nidus, and draining veins. The feeding arteries and draining veins are microscopically enlarged and may show associated varices, areas of stenosis, or aneurysms. The nidus is a conglomeration of numerous small arteriovenous shunts with thin dysplastic walls. Most commonly AVMs bleed either from the nidus or from the most proximal portions of the draining veins. Arteriovenous malformations may be found anywhere between the subarachnoid space and the ventricles. The majority of the hemorrhages are intraparenchymal in location; however, deep-seated AVMs may bleed directly into the ventricles ( Fig. 4-9 ). Noncontrast CT is usually unable to show an underlying AVM, especially in cases of large IPH. In some cases CT may detect calcific densities and serpentine vessels in the AVM. Computed tomography angiography usually shows the large vessels of AVM, especially the draining veins (see Fig. 4-9 , C and D ); however, small AVMs may be missed even with CTA.
Magnetic resonance imaging represents a significant improvement in noninvasive imaging of AVMs. This is partly because of high sensitivity of MRI to flow in vascular structures. The feeding arteries and draining vessels are well shown in T2-weighted images as large signal-void structures described as “bags of black worms.” In cases in which suspicion exists as to the cause of the signal voids, GRE sequences with very short time to echo (TE) show high signal in flow-bearing structures and can be confirmatory for the presence of vascular malformation. FLAIR may show increased signal intensity in adjacent brain parenchyma because of gliotic reaction. Recent studies have shown that time-of-flight and contrast-enhanced MRA can depict AVMs and their architectural characteristics, including configuration of feeder and draining vessels and nidus size with a very good intermodality agreement when compared to DSA.
Diagnosis in the acute phase is made more difficult by vascular spasm and compression by the hematoma. In one series 6 of 29 patients with angiographically negative ICHs were shown to have AVMs at pathologic examination. In angiographically negative cases that do not go to surgery, follow-up evaluation with CTA, MRA, or DSA is recommended after the clot has resorbed. Diagnosis of the underlying AVM and potential associated aneurysm is extremely important because of the high rate of recurrent hemorrhage.
Aneurysms
Intracranial aneurysm rupture usually results in SAH. However, a significant number of IPHs result from aneurysm rupture ( Figs. 4-10 and 4-11 ). In one series of 460 patients with dense SAH, 25% had an associated IPH. Specific aneurysm sites predispose to IPH. These sites should be carefully scrutinized during angiographic evaluation. The most common site is the MCA, where an upwardly pointing aneurysm may hemorrhage into the deep frontal lobe. Nearly as common are anterior communicating artery aneurysms, which may bleed into the gyrus rectus. Distal anterior cerebral artery aneurysms, usually arising at the origin of the pericallosal artery, are associated with hematomas of the corpus callosum or medial frontal lobe. Noncontrast CT may detect curvilinear calcification in the aneurysm wall, but diagnosis is usually made by CTA or DSA. As in the case of AVMs, identification of the aneurysm is made more difficult in the acute period by the mass effect of the hematoma, as well as potential vasospasm.
Cavernous Angiomas
Cavernous angiomas are defined as benign vascular hamartomas containing a mass of adjacent immature blood vessels constituting well-circumscribed sinusoidal vascular channels with a single layer of endothelium. On gross examination they look like “mulberry-like” nodules. Because of their thin vascular walls and low intravascular pressures, cavernous angiomas are prone to recurrent microscopic hemorrhages, accounting for the blood seen in various stages of oxidation. Typically these lesions enlarge slowly and may present with seizures or progressive neurologic deficit. Less typically, overt hemorrhage may occur with a more sudden and dramatic neurologic presentation. In 25% of patients, cavernous angiomas are multiple. These lesions are often angiographically occult because the feeding arteries and draining veins are normal. Computed tomography scan may be normal in up to 50% of cases of uncomplicated cavernous angiomas, or it may show high-attenuation lesions with little or no surrounding edema. Magnetic resonance imaging, given its greater sensitivity to blood products in various stages, is a more sensitive modality and almost always diagnostic ( Fig. 4-12 ). Use of SWI is even more sensitive than the conventional GRE sequence for detection of these lesions. Once MRI confirms the diagnosis of cavernous angioma, no further diagnostic imaging workup for the patient is required. ICHs due to cavernous angiomas are usually smaller and occur at younger ages when compared with ICH due to AVM. Cavernous angiomas may be associated with developmental venous anomalies. Developmental venous anomalies are caused by early arrest of medullary veins during development in the embryo, resulting in persistence of large embryonic deep white matter veins. They are described as a collection of small stellate veins converging into large collector veins draining into a dural sinus or an ependymal vein. Developmental venous anomalies are usually asymptomatic unless associated with other anomalies such as cavernous angiomas or cortical dysplasias.
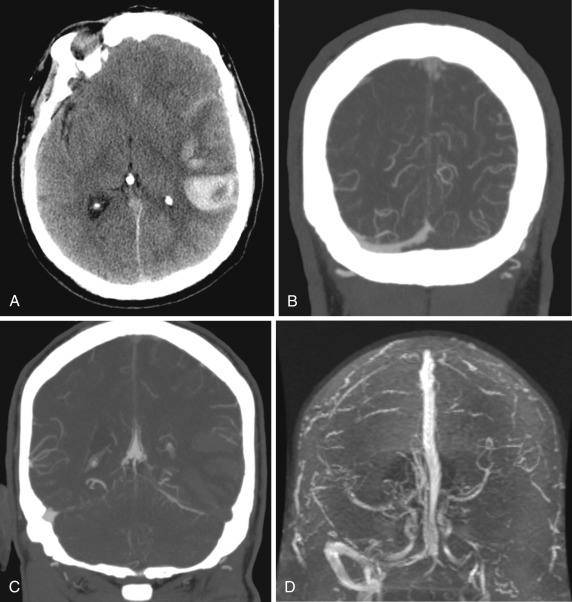
Cerebral Venous Sinus Thrombosis
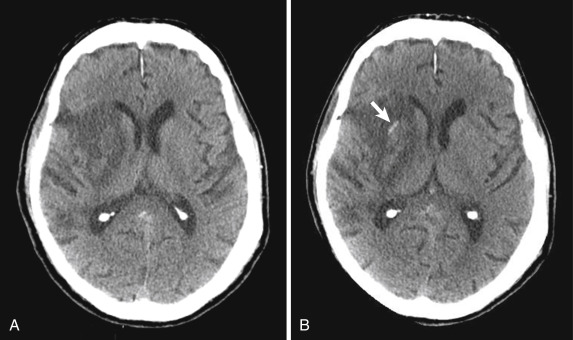
Cerebral venous sinus thrombosis (CVST) is an uncommon disorder affecting the venous side of the neurovasculature. It accounts for 1% to 2% of stroke cases in adults. The estimated incidence of CVST is 3 to 4 cases per million in adults. CVST can result in venous hypertension and parenchymal edema or infarction. Early ICH is seen in 40% of patients with CVST and is associated with poor outcome ( Fig. 4-13 ). Clinical symptoms depend on the patient’s age, presence of parenchymal involvement, and extent of thrombosis and include headache, seizures, focal neurologic deficit, and impaired level of consciousness. Clinical factors that may predispose to cerebral venous thrombosis include dehydration, stasis due to localized neoplasm, infection, or coagulopathy as may be seen with oral contraceptive use. On NCCT the clot within the dural sinus or cortical vein may be seen as a high-attenuation lesion (cord sign). Contrast-enhanced CT or CTA will demonstrate nonfilling of the affected structure with enhancement of the surrounding dura (empty delta sign). Venous obstruction results in increased pressure, decreased local cerebral blood flow, and eventually venous infarction. Venous infarcts are more commonly hemorrhagic than arterial infarcts. Similar to arterial infarcts, venous infarcts show mass effect and involve the cortex in the pattern of cytotoxic edema. However, they do not conform to an arterial distribution. It is important to differentiate venous from arterial infarcts, because despite the hemorrhage, current management for cerebral venous thrombosis is anticoagulation in selected patients. Several reports have shown a favorable outcome to endovascular management, including direct thrombolysis and/or thrombus extraction.
Neoplasm
Bleeding can occur into either a metastatic or primary neoplasm. The most common lesion is a small bleed into a pituitary neoplasm. Of the remaining neoplasms, metastases are more likely to show hemorrhage than primary neoplasms. As reported in the literature, the incidence of intratumoral hemorrhage is 1% to 15%. Of the hemorrhages within metastases, approximately one third are macroscopic and two thirds are microscopic. Common intracranial metastases to hemorrhage include melanoma, choriocarcinoma, bronchogenic carcinoma, thyroid cancer, and renal cell carcinoma. The most common primary neoplasm to contain hemorrhage is glioblastoma. In the majority of patients, tumoral hemorrhage occupies only a portion of the neoplasm. Underlying mechanisms for tumoral hemorrhage include tumor necrosis, invasion of blood vessels by the tumor, and rupture of newly formed vessels. Unenhanced CT or MRI typically shows the hemorrhage within the tumor. Because most metastases and many primary neoplasms demonstrate considerable vasogenic edema, the presence of substantial vasogenic edema should suggest an underlying neoplasm. Significant enhancement of the lesion on contrast-enhanced CT or MRI early after the clinical symptoms is also highly suggestive of a neoplasm as the underlying cause ( Fig. 4-14 ). The hemorrhage caused by tumor may also extend to other locations such as the subarachnoid or subdural space. In cases of large hemorrhage, identifying the tumor as the underlying cause may be very challenging acutely. In these cases, performing follow-up imaging after resorption of the hematoma is recommended.
For additional discussion, see the subchapter Acute Presentation of Neoplasm.
Bleeding Disorders
Bleeding disorders account for a small, but significant, risk factor associated with intracranial hemorrhage. Aspirin therapy may slightly increase the baseline risk. Patients who are anticoagulated to a therapeutic range have a 7 to 10 times increased risk for ICH. Approximately two thirds of the hemorrhages in anticoagulated patients are intraparenchymal, with the remaining mostly subdural in location. Patients receiving urokinase or streptokinase for the treatment of acute myocardial infarction have a rate of intracranial hemorrhage of 1% to 2%. Patients receiving tissue plasminogen activator (t-PA) have a hemorrhage risk of less than 1%.
Other examples of bleeding disorders leading to ICH include thrombocytopenia due to congenital causes, use of certain drugs, or bone marrow diseases. Liver disease, congenital bleeding disorders such as hemophilia, and other factor deficiencies can also cause ICH. Neoplastic diseases such as leukemia are the other group of diseases causing coagulopathy. Because the pattern of hemorrhage in patients with coagulation disorders overlaps many of the other patterns, history and laboratory tests are essential to making an accurate diagnosis.
Intracranial Vasculitis
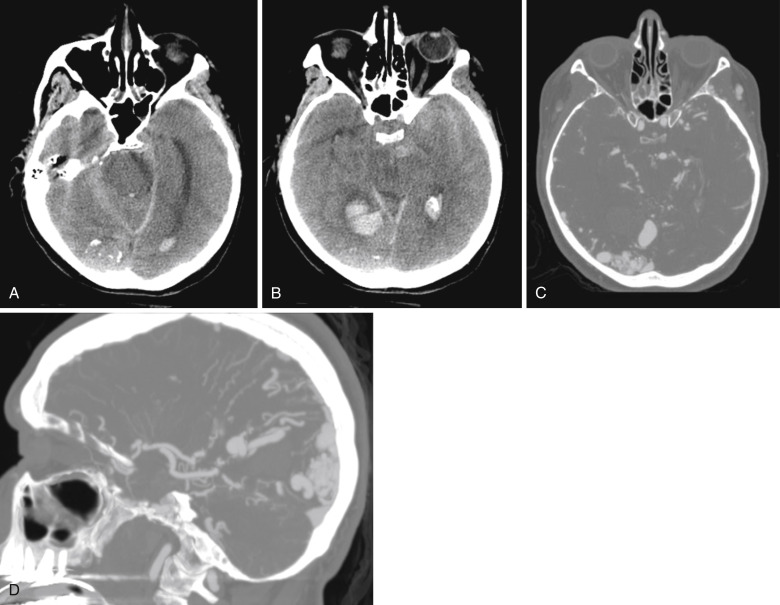
Vasculitis includes a heterogeneous group of disorders characterized by nonatheromatous inflammation and necrosis of blood vessel walls. The abnormal vessels predispose to ICH. Computed tomography may show hemorrhage or infarction secondary to the vasculitis. To make the diagnosis an angiographic study is required. The spatial resolution of CTA and MRA may be insufficient to detect subtle disease; DSA remains the gold standard. The classic appearance of the vessels is caliber change; specifically, there are multifocal areas of smooth or irregularly shaped stenoses alternating with dilated segments ( Fig. 4-15 ).
Drug Abuse
Drug abuse has become an important diagnostic consideration in young adults with intracranial hemorrhage. Both SAH and IPH have been related to cocaine abuse. The locations of the IPH associated with cocaine abuse are similar to the locations seen in hypertensive hematomas in older patients. Underlying lesions, such as congenital or mycotic aneurysm or AVM may bleed secondary to the acute transient surge in systemic blood pressure caused by the drug abuse. Vasculitis with narrowed and even occluded vessels is often present. Other drugs associated with ICH include amphetamines and phencyclidine.
Hemorrhagic Ischemic Stroke
Hemorrhagic ischemic stroke is defined as secondary hemorrhage within the area of ischemic infarction ( Fig. 4-16 ). The hemorrhage can range from small petechial type to large hematomas. Hemorrhagic stroke accounts for approximately 15% of all strokes. Of these, two thirds show IPH and one third show SAH. The hemorrhagic components of infarcts are thought to be secondary and may not be present during the very early stages. Typically, bland infarcts transform into hemorrhagic infarcts within hours to weeks of clinical ictus. An embolus initially obstructs a proximal vessel, producing ischemic insult to the brain and vascular endothelium. As the embolus is later lysed by endogenous factors, circulation is restored to the ischemic area. Autoregulation has maximally dilated the arterial tree, and the endothelium is chemically damaged, leading to leakage or gross extravasation of blood into the infarcted tissue. Most hemorrhagic infarcts resulting from thromboembolic disease primarily affect the gray matter, whereas hemorrhage in venous infarcts primarily affects the white matter.
Imaging Algorithm
According to the described causes and imaging findings, we suggest the following guidelines for imaging patients with atraumatic intracranial hemorrhage:
- 1.
Noncontrast CT is the imaging procedure of choice for initial evaluation in patients with suspected ICH.
- 2.
Computed tomography angiography is generally performed in all patients without a clear cause of hemorrhage who are surgical candidates.
- 3.
Computed tomography angiography is not required for older, hypertensive patients who have hemorrhage in the basal ganglia, thalamus, cerebellum, or brainstem.
- 4.
Magnetic resonance imaging is strongly considered in those patients with a suspected neoplasm, AVM, amyloid angiopathy, or cavernous angioma.
- 5.
Digital subtraction angiography is considered in those patients who require angiographic evaluation and are potential vascular interventional candidates.
- 6.
Digital subtraction angiography or MRA is recommended for patients who are not suitable candidates for CTA.
These guidelines correspond closely to those put forth by the American Heart Association. It is the responsibility of the radiologist to recognize the imaging and clinical findings that may suggest the underlying causes of ICH. Based on a provisional differential diagnosis, the radiologist can guide the imaging workup of these patients. Here are some common scenarios:
- 1.
If the patient is elderly with a basal ganglia hemorrhage and hypertension, the IPH is likely hypertensive in cause, and no further imaging workup is required.
- 2.
If the patient is elderly and normotensive with a lobar hemorrhage, the most likely cause is amyloid angiopathy. Computed tomography angiography should be performed if the patient is a candidate for emergent clot removal. Otherwise, we often perform MRI to evaluate for microhemorrhages, underlying neoplasm, or cavernous hemangioma.
- 3.
If the patient is younger, or if the patient has a combination of IPH and either IVH or SAH, CTA assessment is useful to evaluate for intracranial aneurysm, vascular malformation, vasculitis, or dural venous sinus thrombosis. Repeat CTA or DSA should be considered if no cause is found.
- 4.
If cytotoxic edema is present, infarct should be suspected. Arterial infarcts occupy an arterial distribution, whereas venous infarcts assume a nonarterial distribution. Also, recall that hemorrhagic arterial infarcts primarily affect the gray matter, whereas the hemorrhage in venous infarcts primarily affects the white matter.
Intracranial Infections
- Carrie P. Marder
- Kathleen R. Fink
Intracranial infections often present acutely, and the diagnostic evaluation begins in the ED. Correct diagnosis depends on a combination of clinical, laboratory, and radiologic investigations, with CSF analysis playing a central role. Imaging provides or narrows the differential diagnosis and occasionally identifies a particular entity or organism. Imaging is also crucial for identifying complications of infection.
This section emphasizes the overall strategy for emergent imaging of suspected intracranial infections, highlighting specific entities in which imaging aids diagnosis. Emergency imaging in immunocompromised patients and major complications of intracranial infections that might present in the ED are also considered.
Imaging Strategy
Patients with suspected intracranial infection presenting with altered mental status, seizures, or focal neurologic deficits require emergent NCCT to exclude hydrocephalus, cerebral edema, mass lesions, hemorrhage, or impending brain herniation. Noncontrast CT is widely available, rapidly acquired, and well tolerated by critically ill patients. Once immediately life-threatening conditions have been excluded, contrast-enhanced MRI may be needed to detect subtle signs of infection or complications such as infarcts.
The American College of Radiology (ACR) Appropriateness Criteria contains many guidelines for appropriate imaging that are applicable to patients in the ED. Both NCCT and contrast-enhanced MRI of the head are usually appropriate for patients presenting with new headache and suspected meningitis or encephalitis, with the choice of test depending on local preference and availability. Contrast-enhanced CT may be a suitable alternative when MRI is unavailable or contraindicated, such as in patients with metal implants, severe claustrophobia, or severe renal dysfunction. Cerebrovascular complications of infection are frequent and may require evaluation with MRA or CTA and MR venography (MRV) or CT venography (CTV). Advanced techniques and nuclear medicine studies are reserved for problem solving and are not usually performed from the ED.
Uncomplicated rhinosinusitis generally does not require imaging. If there is suspicion for intracranial or orbital complications of rhinosinusitis, both NCCT and contrast-enhanced MRI of the head, orbits, and paranasal sinuses are usually appropriate (ACR Appropriateness Criteria, “Sinonasal Disease”). Evaluation for intracranial extension is best accomplished with contrast-enhanced MRI. If gadolinium is contraindicated, noncontrast MRI augmented with contrast-enhanced CT of the head and sinuses is recommended.
In immunocompromised individuals with new headache, MRI with or without contrast is usually appropriate as the initial imaging test (ACR Appropriateness Criteria, “Headache”). Immunocompromised patients with rhinosinusitis are at high risk for intracranial or orbital complications, and imaging may be performed earlier than in immunocompetent patients.
Meningitis
Meningitis refers to inflammation of the pia and arachnoid membranes and may be classified based on cause and CSF profile. Pyogenic bacterial meningitis is characterized by CSF findings of neutrophilic pleocytosis, elevated protein level, low glucose level, and elevated opening pressure. Viral meningitis is characterized by CSF findings of lymphocytic pleocytosis with near normal protein and glucose levels, normal opening pressure, and absence of bacterial growth on cultures (“aseptic” meningitis). Granulomatous or chronic meningitis usually refers to chronic inflammation of the basal surfaces of the brain (“basilar” meningitis) and may be due to infectious causes, including tuberculosis or fungal infections, as well as noninfectious causes such as sarcoidosis. Cerebral spinal fluid findings include mild lymphocytosis, elevated protein level, and low glucose level.
The goals of imaging in suspected meningitis are primarily to exclude contraindications to lumbar puncture and to evaluate for complications such as hydrocephalus. Noncontrast CT is usually the first test, but not all patients with suspected meningitis require CT. Patients with impaired consciousness, seizure, focal neurologic signs, immunocompromised state, and age older than 60 years are more likely to have positive imaging findings and benefit from NCCT.
Brain herniation is a dreaded complication of acute bacterial meningitis that occurs in up to 5% of patients and is associated with significant mortality. Because of the theoretical potential for lumbar puncture to cause brain herniation in a patient with cerebral edema, lumbar puncture should be avoided in patients with midline shift, effacement of the basilar cisterns, posterior fossa mass effect, or clinical signs of increased intracranial pressure, even if NCCT results are normal ( Fig. 4-17 ).