This article presents an overview of published studies using conventional and quantitative MR imaging to describe normal development of the cerebellum prenatally and postnatally through 18 years of age. Normal cerebellar development and maturational processes are described here within the context of MR imaging morphology, microstructure, metabolism, and functional connectivity. In addition, strengths and weaknesses of these reviewed studies are critically appraised and new directions for future cerebellar MR imaging investigation are made.
Key points
- •
This article summarizes normal cerebellar development as described by conventional and advanced MR imaging techniques.
- •
Advanced MR imaging techniques are providing critical insights into important developmental and maturational processes that occur in the normal cerebellum throughout the pediatric lifespan.
- •
Ongoing prospective studies using multimodal MR imaging are needed to better evaluate/explore emerging functional and microstructural development of the cerebellum.
Introduction
The cerebellum is increasingly recognized for its critical role not only in motor coordination and balance but in cognition, language, and social-emotional functioning as well. This expanding repertoire of cerebellar functions has captured the attention of the scientific community and the number of published reports on the cerebellum continues to grow rapidly. Although numerous studies have used MR imaging to characterize developmental cerebellar abnormalities in clinical populations (see Poretti A, Boltshauser E, Huisman TAGM: Prenatal cerebellar disruptions: Neuroimaging spectrum of findings in correlation with likely mechanisms and etiologies of injury , in this issue), available literature on normal cerebellar development across the pediatric lifespan is limited. An understanding of typical cerebellar developmental processes and maturational trajectories is essential in order to identify aberrant cerebellar development that is often associated with wide-ranging, long-term neurodevelopmental impairments.
This article first provides a detailed summary of published MR imaging studies describing typical cerebellum development in healthy, typically developing fetuses, children, and adolescents as currently described by different MR imaging modalities (eg, three-dimensional [3D] volumetric analyses, diffusion tensor imaging [DTI]). For each of the MR imaging modalities, we then appraised the available literature, highlighting areas where knowledge is currently lacking, emphasizing both opportunities and limitations of currently used MR imaging methods to study cerebellar development. In addition, potential targets for future research are reviewed.
Embryologic development of the cerebellum
Delineating the histogenesis of the developing cerebellum is beyond the current resolution of conventional MR imaging. The timing of the first appearance of many developmental features of the cerebellum as detected by MR imaging is often delayed with respect to the true timing in the embryologic developmental time course. Although a comprehensive discussion of the complex cellular processes of the developing cerebellum is beyond the scope of this article, an abbreviated overview of normal cerebellar morphogenesis is warranted.
During the fourth week of development, the cerebellum initially emerges from the bilateral thickening of the lateral portions of the alar plates that are facing the fourth ventricle. About 2 weeks later, this increasing thickening forms the limbs of the cerebellar tubercle, and as it continues to grow rapidly it protrudes into the fourth ventricle. During the 12th week of development, growth of the midline area of the alar plates accelerates such that it eventually fills the gap between the limbs and forms the precursor of the vermis. Around the 12th week of development, multidirectional growth is occurring laterally, rostrally, and outwardly, reshaping the cerebellum so that it achieves its specific lateral orientation. Around the 20th week of gestation, the cerebellar cortex begins its rapid and exponential growth foliation, which corresponds with the timing of its increased visibility on fetal MR imaging.
In vivo structural development of the cerebellum by conventional MR imaging
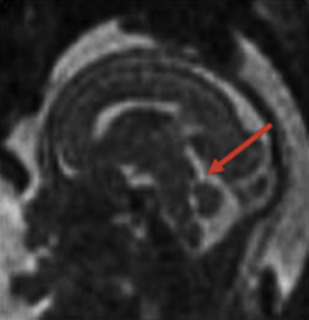
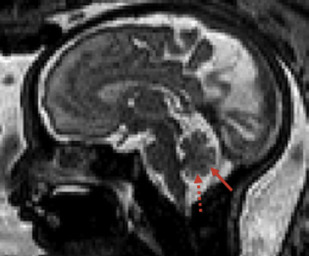
The detailed anatomic delineation of the brain, and particularly of the developing cerebellum, is extremely difficult to characterize by MR imaging in the fetus younger than 20 weeks of gestation because of the small size of the structures. However, starting at around 20 weeks gestational age (GA), using T2-weighted (T2w) imaging during fetal MR imaging (1.5-T MR imaging), it is possible to visualize the perpendicular orientation of the tentorium, the equilateral triangular shape of the fourth ventricle, and the smooth and regular cerebellar hemispheres ( Fig. 1 ). After 21 weeks, the homogeneity of the hemispheres is interrupted by the progressive appearance of early folia and tissue differentiation that becomes increasingly visible. By about 27 weeks, the thin layer of hypointense signal on T2w images of the cerebellar cortical gray matter, and the adjacent thicker white matter layer seen as high signal intensity, can consistently be observed. Bounded by the white matter and the fourth ventricle, it is also possible to clearly delineate the hypointense T2w signal of the dentate nuclei ( Fig. 2 ). The signal changes specific to the dentate nuclei are thought to reflect the high cellularity in these areas of deep gray matter. At approximately 25 to 26 weeks, the separation between the anterior and posterior lobes of the vermis occurs; at the same time, the primary fissure of the vermis becomes more apparent on a sagittal plane and is typically consistently seen by 28 weeks ( Fig. 3 ). Although the cerebellar tonsils are observed by 27 weeks, it is only after 32 weeks that the prepyramidal and the secondary fissures of the vermis become distinguishable ( Fig. 4 ).
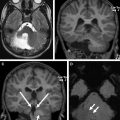
On in vivo fetal MR imaging, the middle cerebellum peduncles can be first seen in 24-week fetuses and the superior cerebellar peduncles at 28 weeks. On postnatal MR imaging, within the first few weeks of life, the superior and inferior peduncles are apparent. As the cerebellum enlarges during childhood, the fissures and folia increase in depth, and they become increasingly distinguishable ( Fig. 5 ). The available evidence from quantitative MR imaging studies that capture and characterize unique features of normal cerebellar development are summarized below.
In vivo cerebellar volumetric and shape development observed by quantitative MR imaging
From 20 to 31 weeks, in parallel with an important volumetric expansion of the cerebellum, the surface of the cerebellum undergoes a dramatic change in structure. Scott and colleagues performed shape analyses on manual cerebellar fetal segmentations and described important regional differences in surface curvature. Specifically, the inferior portion of the vermis and the anterior lobe of the hemispheres increased in concavity, whereas the apex of the vermis and the adjacent inferior-posterior lobe of the hemispheres increased in convexity. Notably, we and others have described an exponential increase in cerebellar volumetric growth in utero. Specifically, total cerebellar volume increases by 600% from 20 to 31 weeks, whereas a 4-fold increase (384%) is observed between 25 and 37 weeks. Between birth (term equivalent age) and the end of the first year of life, total cerebellum volume further increases by 240%, with 108% of this volume gain occurring during the first 3 months of life. By the end of the first year, the most active and impressive volumetric expansion is completed and only a 15% volume increase is reported to occur between the ages of 1 and 2 years.
The total volume of the cerebellum and its cortex continue to change through childhood and adolescence and follows a similarly inverted U-shaped (ie, quadratic) trajectory. This global cerebellar volume increase seems to be driven by the gain in cerebellar white matter compared with the cerebellar cortical gray matter, which tends to decrease with age through adolescence. Sex differences are also observed with boys, consistently showing larger total and regional cortical cerebellar volumes than girls, with a gap that increases with age. For both the cerebellar cortex and total cerebellar volume, growth peaks appear significantly earlier in girls than in boys. In boys, the cerebellar cortex and total volumes peak around 15.5 years of age. In contrast, in girls, the total cerebellar volume is at its highest point at 11.8 years and seems to peak even earlier with respect to cerebellar cortical volume. Sex differences in cerebellar volumetric growth have not been reported in fetuses or children younger than 3 years of age.
Regional cerebellar growth trajectories have also been described. The cerebellar hemispheres of fetuses from 20 to 31 weeks mimic a quadratic growth trajectory. This trajectory is maintained in the anterior and the superior lobes of the hemispheres during childhood and adolescence but not in the inferior-posterior lobe, which instead follows a cubic trajectory. In contrast, vermian growth maintains a linear trajectory during antenatal and postnatal development. Note that the volume gain of the vermis is more pronounced during the late second to early third trimester of pregnancy, during which it increases 3.5-fold. Volumetric gain of the vermis and of its subregions during childhood and adolescence is minimal when compared to the volumetric expansion.
Overall, the quadratic volumetric expansion of the cerebellum is well documented by converging evidence from the 3D quantitative MR imaging analyses performed by different groups. The seminal study of cerebellar surface analyses from Scott and colleagues quantified for the first time changes in cerebellar curvature during the second trimester of pregnancy. Notably, shape analyses of the cerebellum have not been performed beyond 31 weeks of gestation and would be worth exploring during the third trimester as well as during postnatal development to better delineate potential critical periods of regional cerebellar maturation during this exuberant developmental stage.
Cerebellar microstructure organization observed by diffusion tensor imaging
Using DTI, it is now possible to quantify both the diffusion rate and the directionality (ie, anisotropy) of the water molecules within the brain tissue, which in turn allows clinicians to make inferences about the degree and extent of microstructural organization. An increase in fractional anisotropy (FA) and a decrease in overall diffusion in bidirectional white matter fiber bundles is thought to be reflective of normal maturation processes (ie, increase of cell packing and reduction of water content as well as ongoing myelin formation).
In vivo diffusion-weighted MR imaging studies of fetuses between 17 and 37 weeks have collectively reported a strong negative linear relationship between increasing GA and average diffusion coefficient (ADC) values in the cerebellar hemispheres. Compared with the cerebral white and deep gray matter, the cerebellar hemispheres show the fastest and most pronounced decrease in ADC. However, cerebellar ADC decline is less dramatic when evaluated during the early third trimester (26–33 weeks). The overall decreasing diffusion in the cerebellum during pregnancy is thought to reflect the water content reduction that accompanies normal advancing gestation.
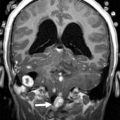
Because of poor contrast and maternal and fetal motion, the very small regions of interest are particularly challenging to characterize with DTI in utero. To date, only 2 studies have described the microstructure of the cerebellar cortex in postmortem fetuses without central nervous system anomalies. The first, by Saksena and colleagues, used a region-of-interest approach to study FA in the cerebellar cortex and in the middle cerebellar peduncle of 24 newly aborted fetuses between 20 and 37 weeks GA. In the second, Takahashi and colleagues collected high-angular-resolution diffusion imaging on a 4.7-T scanner in 6 fetuses between 17 and 38 weeks GA to visualize the organization of the fiber pathways in the cerebellar white and gray matter. Saksena and colleagues described an FA increase in the cerebellar cortex from 20 to 28 weeks and then a gradual decrease until 37 weeks. Takahashi and colleagues reported that, at 17 weeks, the cerebellar cortex is predominantly composed of radially orientated pathways that gradually disappeared with age and cortical thickening ( Fig. 6 ). In contrast to the study by Saksesa and colleagues, the cortical FA measured by Takahashi and colleagues was stable across specimens. However, this discrepancy between studies could also stem from the small study sample as well as differences in image acquisition and processing. Nevertheless, both studies report low FA values in the cerebellar cortex closer to term, which is in line with the increasing number of crossing pathways found in the cerebellum between 31 and 38 weeks. Both studies documented maturation of the white matter in the middle cerebellar peduncles. Saksena and colleagues reported a steady increase between 20 and 37 weeks GA with probable early signs of hemispheric lateralization as shown by greater FA in the right peduncle compared with the left. Takahashi and colleagues similarly showed a thickening of the middle cerebellar pathways with increasing age and branching to the cerebellar cortex after 31 weeks.
Related posts:
 The Role of the Pediatric Cerebellum in Motor Functions, Cognition, and Behavior
Cerebellar and Brainstem Malformations
The Pediatric Cerebellum in Inherited Neurodegenerative Disorders
The Role of the Pediatric Cerebellum in Motor Functions, Cognition, and Behavior
Cerebellar and Brainstem Malformations
The Pediatric Cerebellum in Inherited Neurodegenerative Disorders
 Prenatal Cerebellar Disruptions
 Pediatric Neurocutaneous Syndromes with Cerebellar Involvement
 Vascular Disorders of the Cerebellum in Children
Stay updated, free articles. Join our Telegram channel

Full access? Get Clinical Tree


