7 Normal Findings and Technical Aspects of Carotid Sonography
Ultrasound Appearance of the Normal Carotid Artery Walls
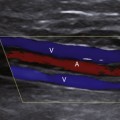
All three layers can be visualized on ultrasound images (Figure 7-1). The two transition zones between the lumen and the intima and between the media and adventitia produce two parallel echogenic lines, with an intervening zone of low echoes that corresponds to the media. The transition between media and adventitia also corresponds to the external elastic lamina as seen on pathologic studies. The thickness of the intima cannot be directly imaged from the ultrasound image since it typically measures 0.2 mm or less and is below the resolution of transcutaneous ultrasound.1 What is seen is due to the reflection of the ultrasound beam at the lumen-intima interface. This is better appreciated on the far wall than for the near wall of the CCA.2 There is a close correlation between histology and ultrasound-based measurements of the intima-media thickness.1,3
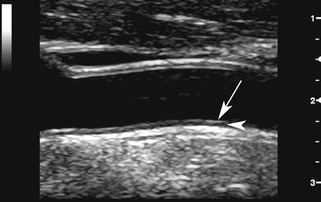
The intimal reflection should be straight, thin, and parallel to the adventitial layer. Significant undulation and thickening of the intima indicate more advanced changes due to atherosclerosis (see Chapter 8) or, rarely, fibromuscular hyperplasia. After endarterectomy, the lumen-intima interface is less prominent at the surgical site because the intima has been removed.
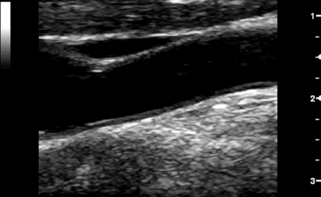
On transverse sections, clear visualization of the lumen-intima interface indicates that the image plane is perpendicular to the vessel axis. The lumen-intima interface is best seen on longitudinal images when the image plane passes through the center of the artery and the ultrasound beam forms a 90-degree incident angle with the wall interfaces (Figure 7-2; see Video 7-1).
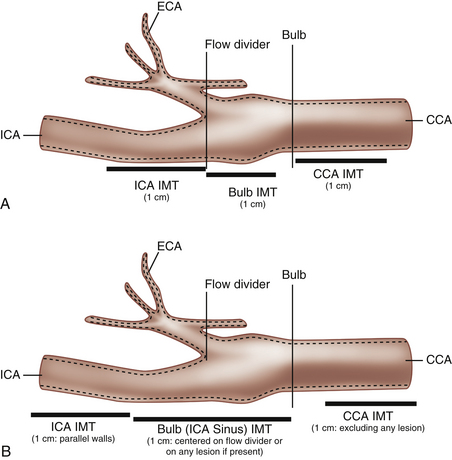
The carotid bulb is a functional definition describing the widened portion of the distal CCA extending to the junction of the external and internal carotid arteries (the flow divider; Figure 7-3). The carotid sinus originates along the medial wall of the proximal ICA where it is adjacent to the external carotid artery (ECA). The carotid bulb spans the junction of the internal and external carotid arteries and blends into the dilatation of the sinus along the lateral aspect (opposite the flow divider) of the proximal ICA. The true ICA has parallel walls above (distal to) the sinus. The degree to which the carotid arteries widen at the carotid bulb varies from one individual to another. Usually the widening is slight, but some normal individuals have capacious carotid bulbs that may harbor large plaques in the absence of significant carotid stenosis. The CCA is an elastic artery, whereas the ICA is a muscular artery.4 The region of the ICA sinus is of mixed characteristics between a muscular and an elastic artery.5
Normal Blood Flow Characteristics
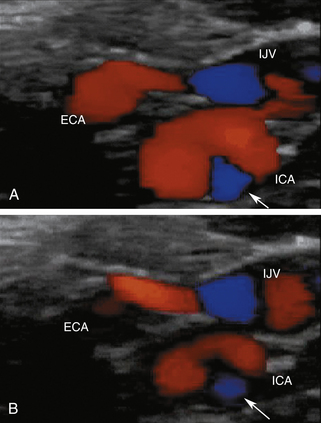
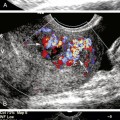
In normal common carotid arteries that are relatively straight, blood flow is laminar, meaning that blood cells move in parallel lines with the central blood cells moving faster than the more peripheral blood cells. The distribution of blood flow velocity across the diameter of the artery follows a parabolic pattern (see Chapter 1) with slower velocities near the vessel wall and faster velocities near the center. Blood flow is not always laminar in nondiseased vessels since the artery segment has to be straight in order for the conditions of laminar flow to apply. Tortuous segments, kinks, or areas of branching disrupt the normal laminar flow pattern. The most noteworthy normal flow disturbance occurs at the carotid bifurcation (Figures 7-4 and 7-5; see Video 7-2), where a zone of blood flow reversal is established in the CCA bulb and proximal ICA.6–8 The size of the zone of flow separation appears to be related to anatomic factors, including the diameter of the artery lumen and the angle between the ICA and the ECA.
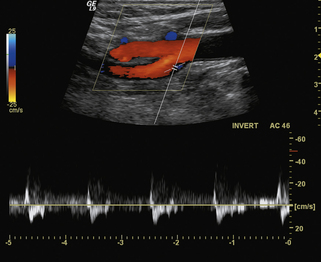
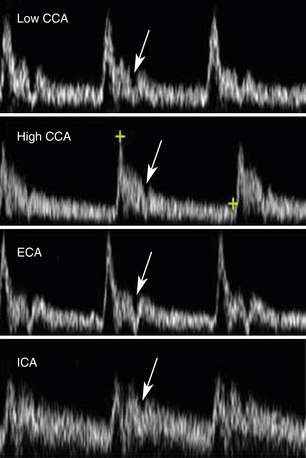
The features of the common, external, and internal carotid spectral Doppler waveforms are distinct from each other, and changes in the Doppler tracings can offer clues as to the presence of occlusive disease. The pulsatile contour of Doppler waveforms can be used to distinguish the ICA and ECA. The ECA has a very pulsatile appearance during systole and early diastole that is due to reflected arterial waves from its branches. The ICA demonstrates less pulsatility. The CCA shares the appearance of both waveforms. The diastolic component of the waveform also shows typical differences with the ICA having the highest diastolic component, the external the lowest, and the CCA an appearance somewhere in the middle. These features are illustrated in Figure 7-6.
The normal range of velocities in the carotid branches varies as a function of age. The younger patient has higher blood flow velocities 100 cm/sec? no, leaving open to variability; the 150 cm/sec addressed later”–>, likely a reflection of a higher cardiac output. ICA velocities decrease with age, reaching typical values between 60 and 90 cm/sec for ages 60 years and above.9,10 Blood flow velocities vary with physiologic state of the individual, being higher with exercise than at rest. For this reason, the carotid examination should be conducted after the patient has been at rest for 5 to 10 minutes. Peak systolic velocities in the CCA tend to parallel the values in the ICAs. In addition, on average, the common carotid blood flow velocity in the low neck is 10 to 20 cm/sec higher than near the bifurcation.11 This observation is of considerable importance, as the measured peak systolic velocity ratio (ICA peak systolic velocity/CCA peak systolic velocity; see Chapter 9) will depend on the location where velocities are sampled in the CCA. The CCA peak systolic velocity should therefore be obtained before the beginning of the bulb, ideally 2 to 4 cm below. Since the ultrasound transducer typically measures 4 cm, it can be used to help locate this point by placing one end at the level of the bulb and sampling at the mid transducer, or approximately 2 cm below the beginning of the bulb. The mean peak systolic velocity in the ECA is reported as being 77 cm/sec in normal individuals, and the maximum velocity does not normally exceed 115 cm/sec. Considerable patient-to-patient variability occurs in ECA flow velocity in normal individuals because pulsatility varies considerably from one person to another since some individuals have a sharply spiked systolic peak, while others have a more blunted peak. As discussed in Chapter 3, the Doppler spectral waveforms are almost always altered in the region of the bulb (see Figure 7-4), a reflection of the complex flow dynamics that occur at this location.6
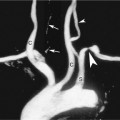
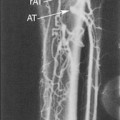
Peak systolic ICA velocities as high as 120 cm/sec have been reported in some normal adults, but these values are exceptional, and an ICA velocity exceeding 100 cm/sec should be viewed as potentially abnormal in older individuals. Elevated velocities can be seen in normal carotid arteries that diverge from a straight line and become curved. These elevated velocities are also associated with different degrees of coiling of the artery ultimately leading to kinking. Examples of a classification of carotid kinks12 is shown in Figure 7-7. The sharp kinks (30 degrees or less) are likely to cause marked, and therefore pathologic, pressure drops (see Video 7-3). Blood flow velocities can therefore be artificially elevated as the blood flows into and out of the curved segment. Values up to 150 cm/sec can be seen without a significant lesion being present (Figure 7-8). Carotid coils are likely due to genetic factors.13
Related posts:
Stay updated, free articles. Join our Telegram channel

Full access? Get Clinical Tree


