3
Normal Liver Anatomy
How to Perform a Liver Ultrasound Scan
Adrian K.P. Lim1,2, Ivica Grgurevic3, and Matteo Rosselli4,5
1 Department of Imaging, Imperial College Healthcare NHS Trust, London, UK
2 Department of Metabolism, Digestion and Reproduction, Imperial College London, UK
3 Department of Gastroenterology, Hepatology and Clinical Nutrition, University Hospital Dubrava, University of Zagreb School of Medicine and Faculty of Pharmacy and Biochemistry, Zagreb, Croatia
4 Department of Internal Medicine, San Giuseppe Hospital, USL Toscana Centro, Empoli, Italy
5 Division of Medicine, Institute for Liver and Digestive Health, University College London, Royal Free Hospital, London, UK
Anatomy of the Liver and Ultrasound Appearance
Location, Shape, and Borders
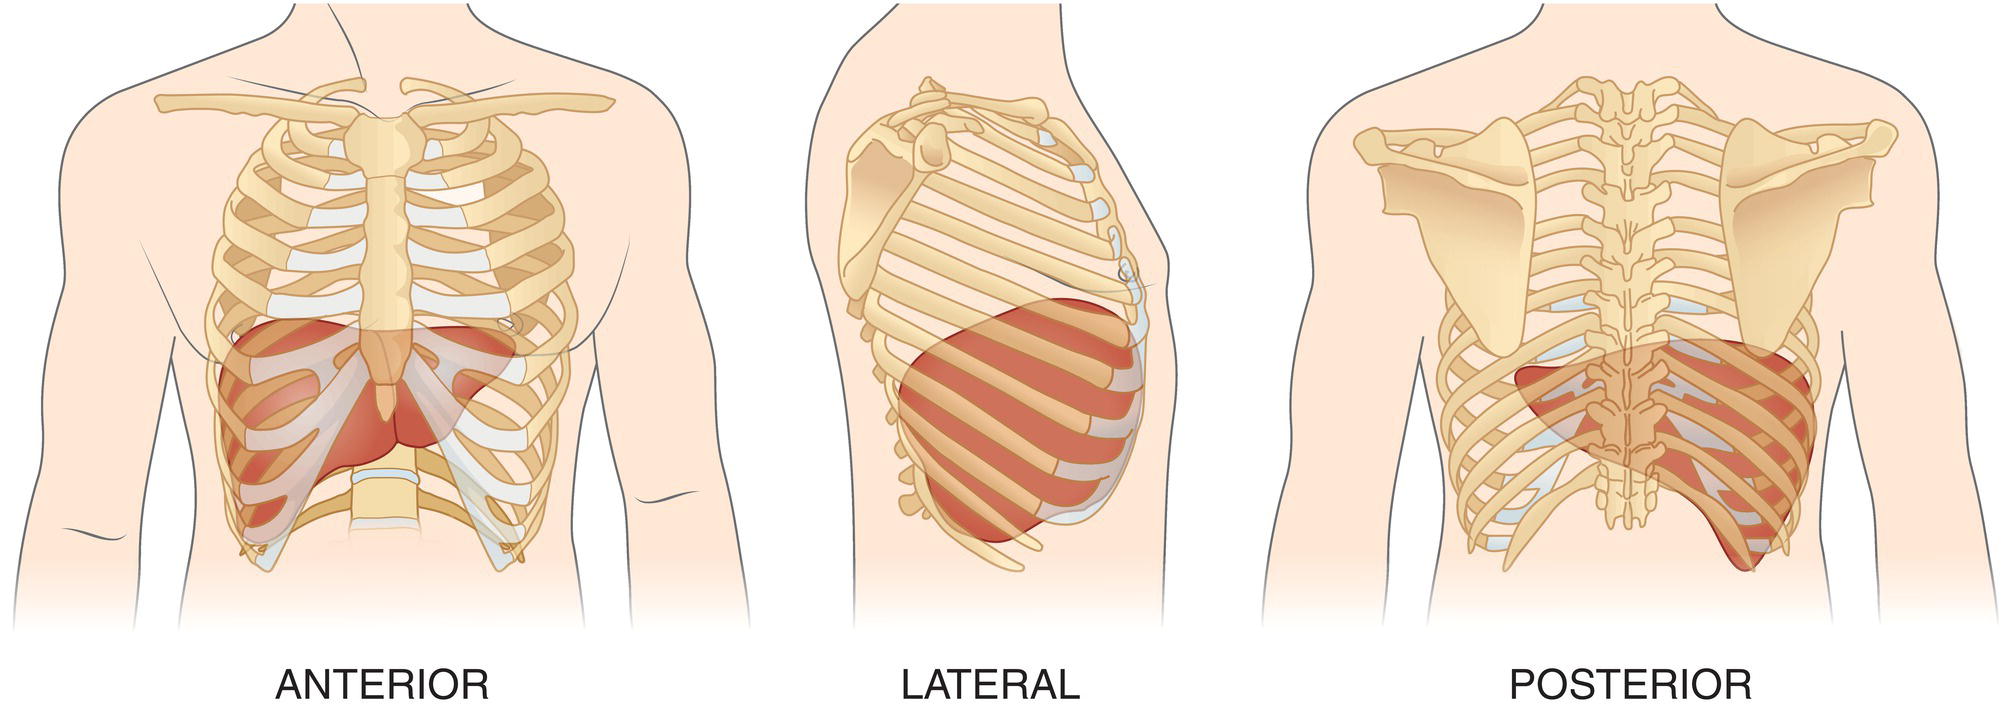
The liver is the largest parenchymal organ in the abdominal cavity. It is located below the diaphragm, extending from the right hypochondrium to the epigastrium, usually reaching the left subcostal edge (Figure 3.1). It has a smooth, dome‐shaped diaphragmatic surface and a visceral, more irregular one, moulded by the adjacent organs and indented by the left, right, and interlobar fissures (Figure 3.2). Normally during respiration, the liver moves following the diaphragm. This movement is important and can be increased with deep inspiration to optimise liver visualisation during ultrasound imaging in a subcostal view. The magnitude of these excursions depends on the individual’s lung capacity as well as body habitus and the mechanical properties of the thoracic wall (obesity and some structural diseases of the musculature or bone of the thoracic wall reduce this oscillation). Owing to the liver’s high anatomical variability, it is generally accepted to compare its size to the right kidney to gauge whether it is enlarged, normal, or atrophic, rather than taking an exact measurement of its diameter [1]. A subcostal maximal length of 16 cm taken in the mid‐clavicular is considered the upper limit of normal.
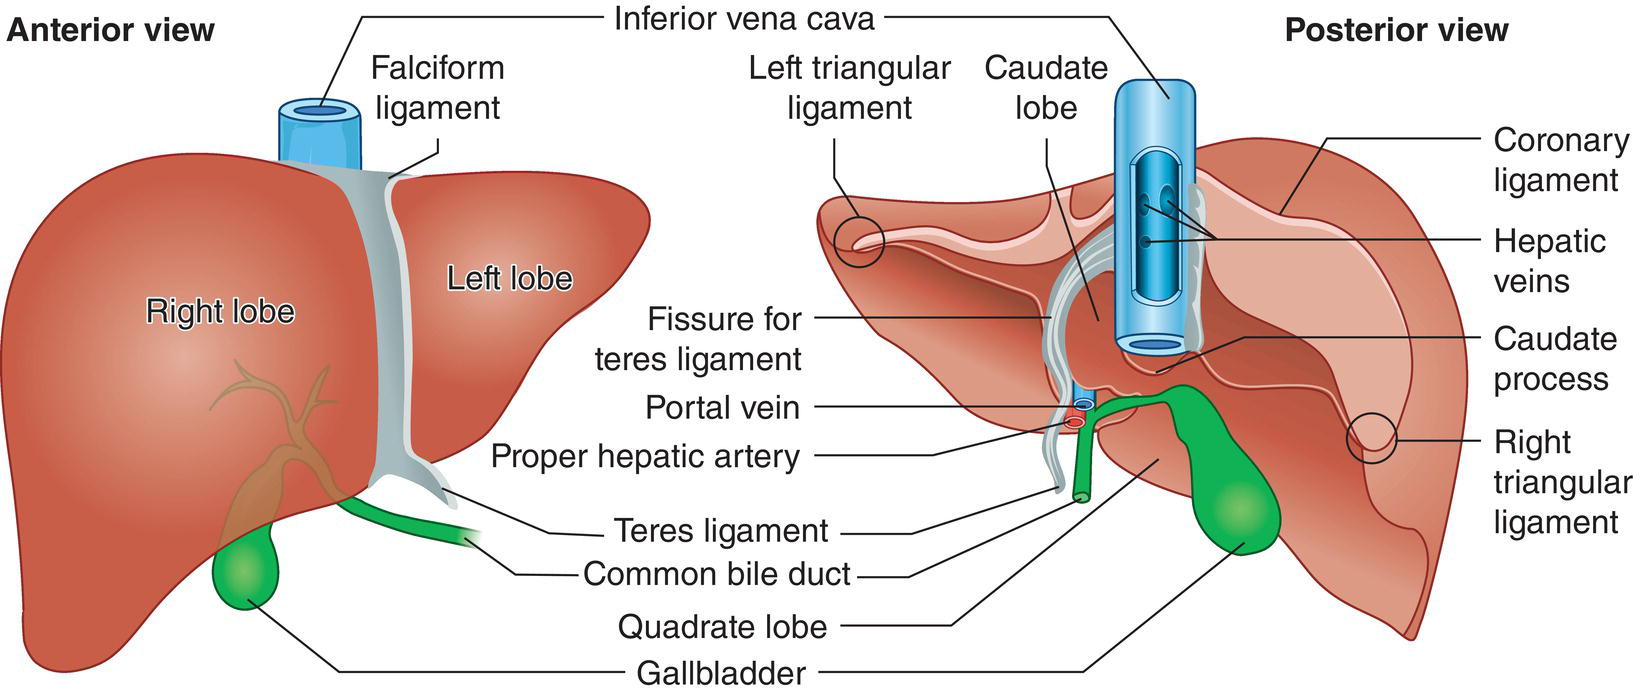
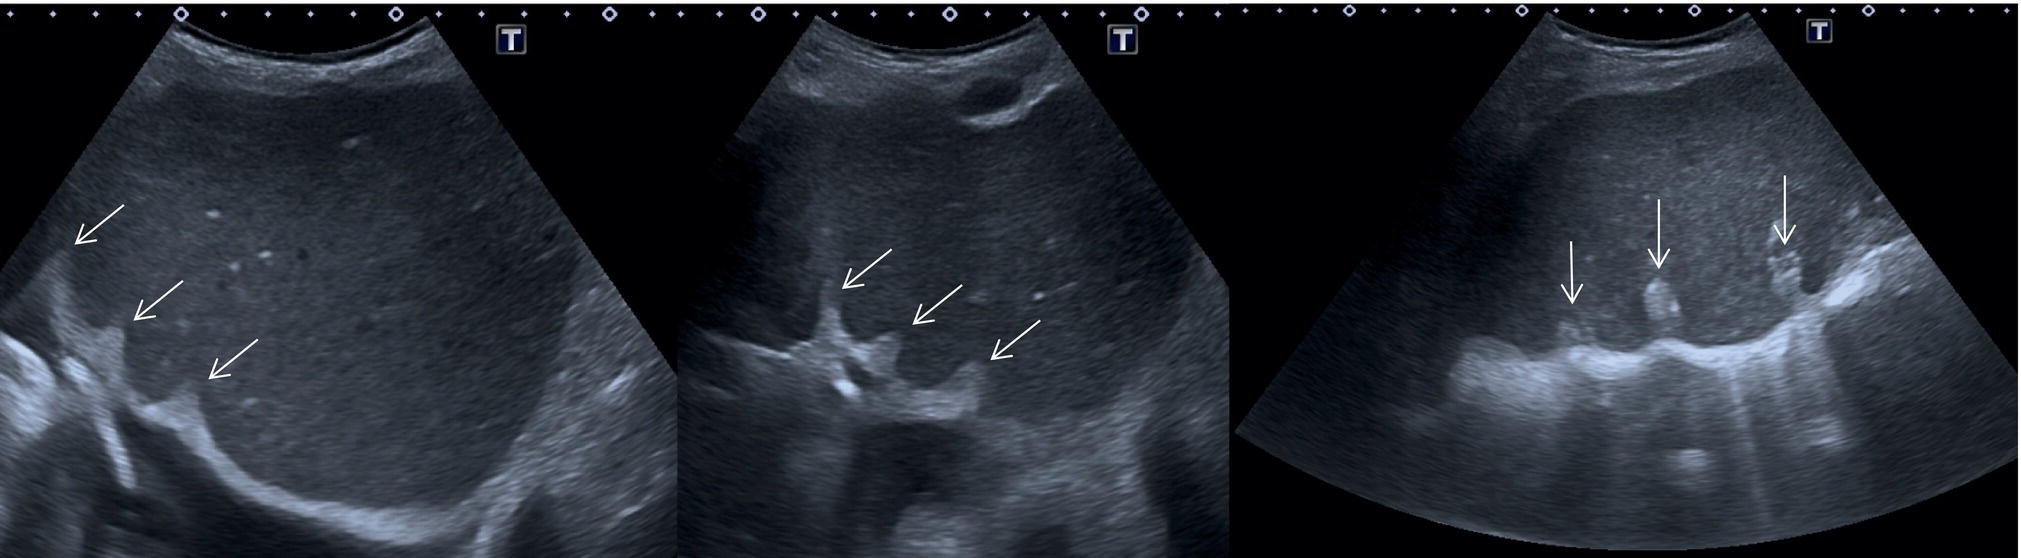
The suspensory system of the liver is constituted by ligaments that are seen on ultrasound as hyperechoic linear structures of different widths that fix the liver to the diaphragm, abdominal wall, and adjacent organs. Other ligaments envelope vascular and biliary structures and provide useful landmarks for the description of the complex liver structure. More specifically, the falciform ligament connects the dorsal surface of the liver to the diaphragm and to the anterior abdominal wall dividing the liver into the anatomic right and left lobes. Its free margin continues with the remnant of the obliterated umbilical vein, which is known as the ligamentum teres (or round ligament) and runs along the ventral surface of the liver, coming into direct contact with the left branch of the portal vein (PV) (Figure 3.5). The obliterated remnants of the ductus venosus constitute the venous ligament, which is seen on ultrasound as a thin hyperechoic line that surrounds the parenchyma adjacent to the retrohepatic inferior vena cava (IVC) defining the borders of the caudate lobe (Figure 3.6). The lesser omentum attaches the liver to the lesser curvature of the stomach through the hepatogastric ligament and to the duodenum through the hepatoduodenal ligament. The latter envelopes the portal triad running from the porta hepatis to the very first portion of the duodenum. It contains the liver lymphatics and is often the site of lymphadenopathies that can be seen in infective, inflammatory, or neoplastic liver diseases.
In normal conditions, the liver has smooth margins and regular contour, the echotexture is homogeneous, and the echogenicity is almost equal to or slightly brighter than the cortex of the right kidney (Figure 3.3). The liver is enveloped within the fibrous Glisson’s capsule, which contains sensitive nerve endings supplied by the phrenic nerve. The capsule can be barely seen on ultrasound as a hyperechoic line that permeates the liver in direct contact with the peritoneum and is therefore more easily distinguished when there is ascites (Figure 3.4).
Gallbladder and Biliary Tree
The gallbladder (GB) is a pear‐shaped structure located in the GB fossa along the inferior surface of the right liver lobe, lateral to the second portion of the duodenum and anterior to the right kidney (Figure 3.7). Its position is variable according to the patient’s body habitus [2]. Four anatomical variants are described and should be borne in mind, since anatomical landmarks and GB positioning might vary considerably:
- Hypersthenic body habitus: the diaphragm, liver, GB, and stomach tend to lie high in the abdomen and the ultrasound examination is often limited due to the presence of overlying bowel gas and food residue.
- Sthenic: the liver and GB lie as expected in the right upper quadrant and the GB has an oblique position.
- Hyposthenic: the liver and GB lie lower, often in the lumbar region, and the GB is more vertically oriented.
- Asthenic (extremely hyposthenic): the liver and GB might lie as low as in the right iliac fossa and the GB is vertically oriented [2].
The biliary tree can be divided into intrahepatic and extrahepatic segments. The intrahepatic ducts run across the liver from the periphery to the liver hilum, converging in larger ducts, and are in tight anatomical connection with the hepatic arterial supply and the portal venous system. In proximity to the liver hilum, the cystic duct that drains bile from the GB joins the main hepatic duct to form the common bile duct (CBD). The CBD terminates with the pancreatic duct at the ampulla of Vater within the second portion of the duodenum.
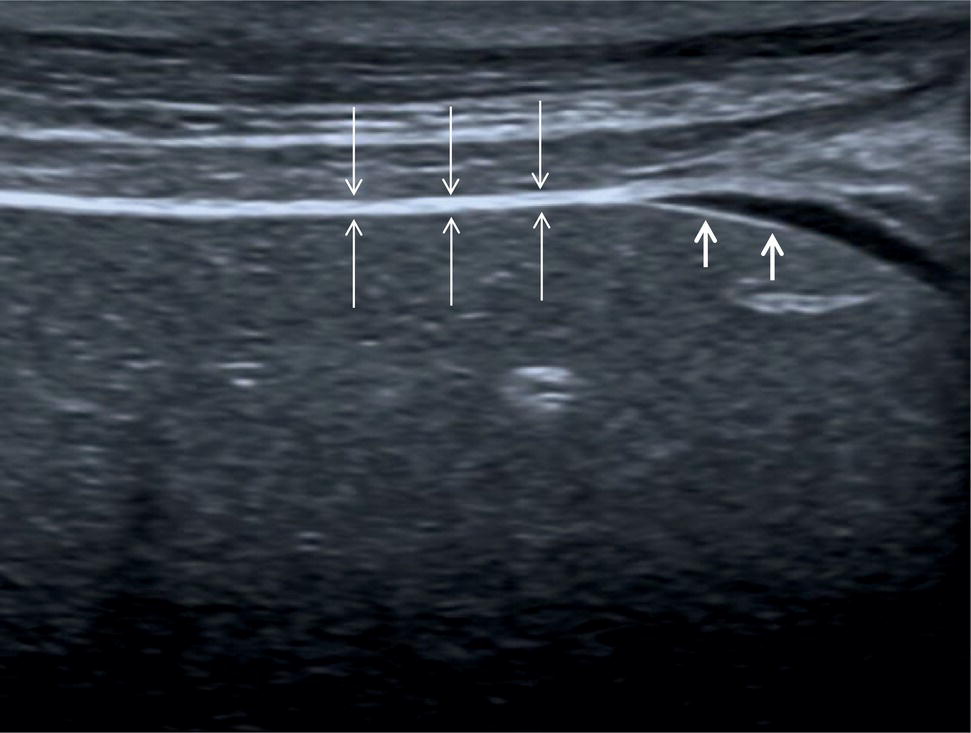
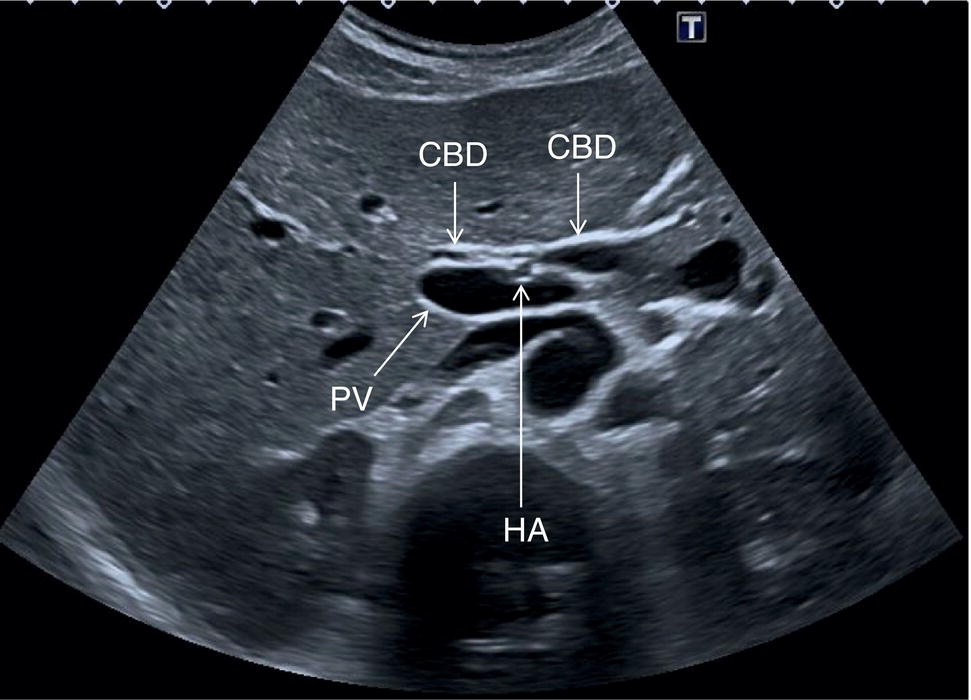
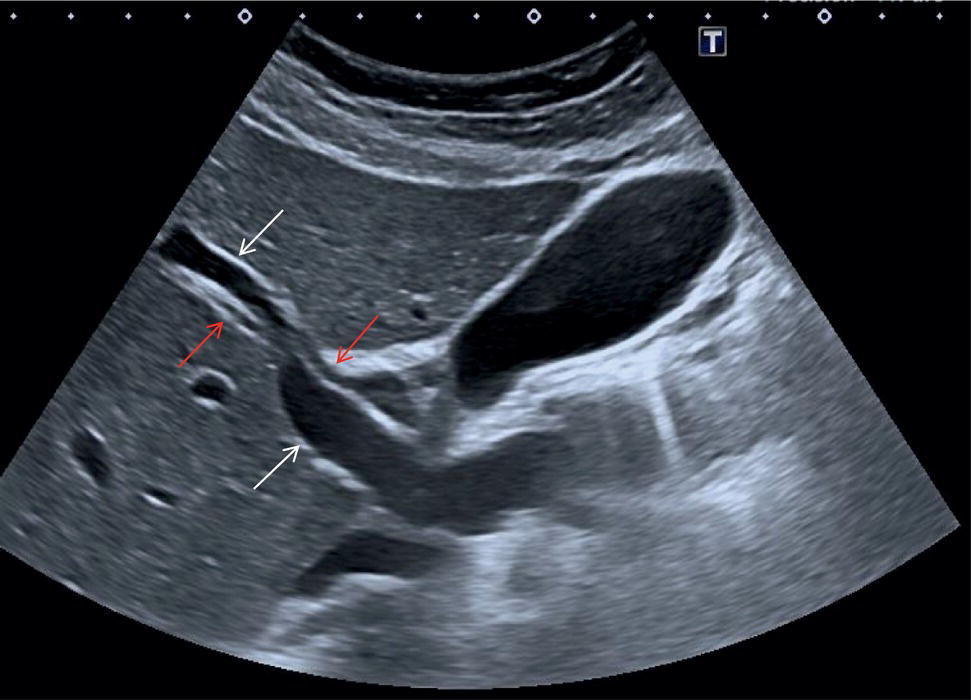
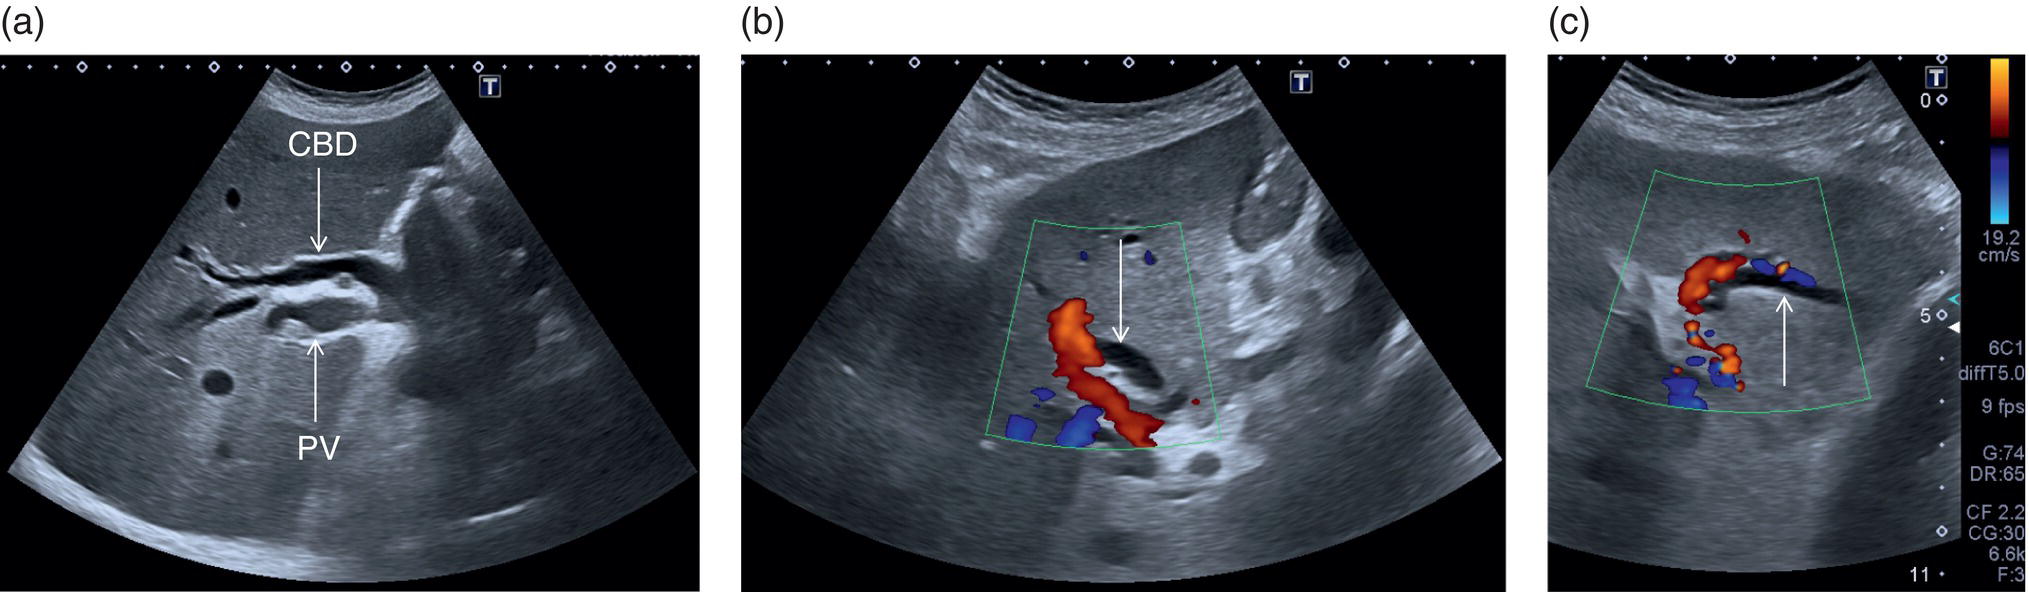
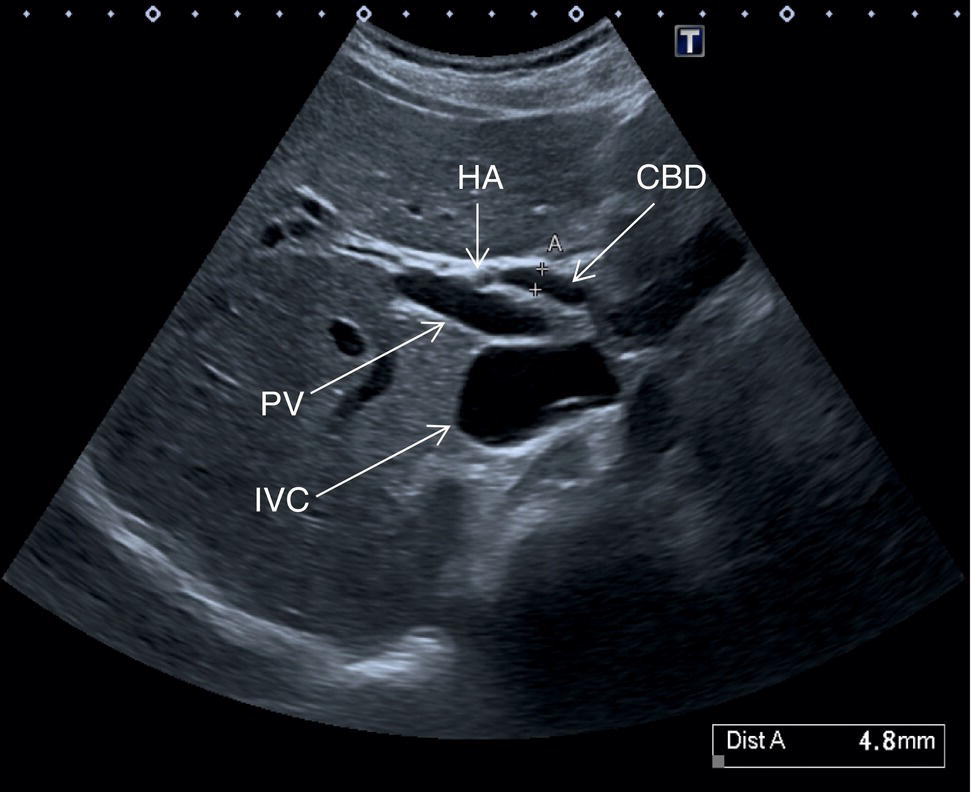
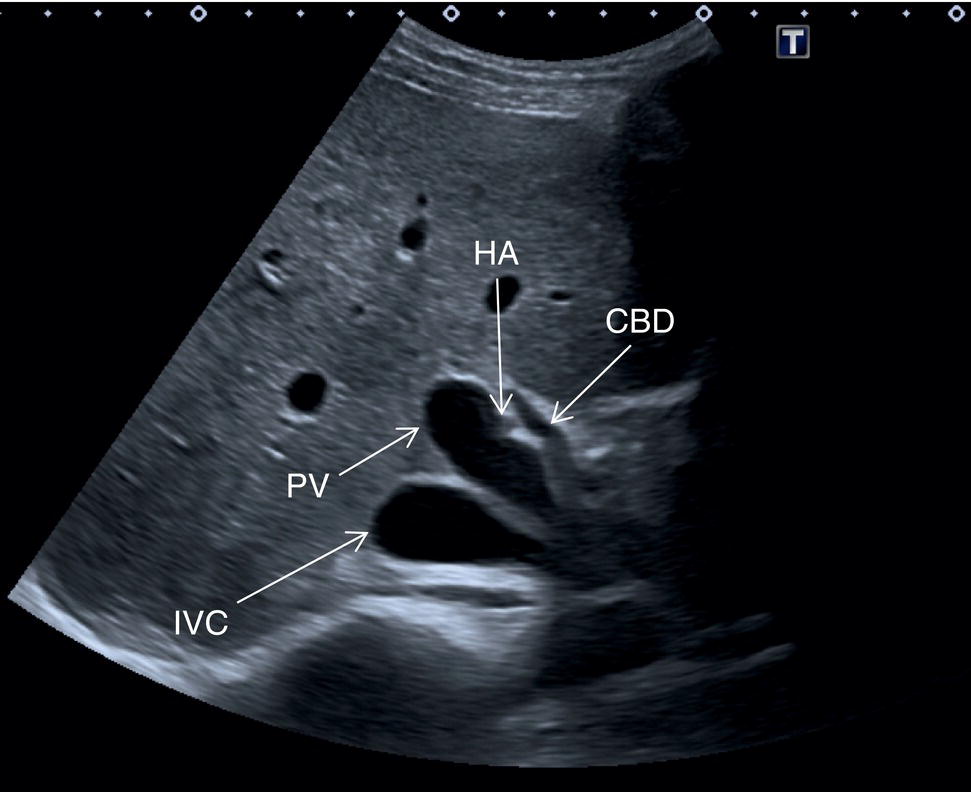
In normal physiological conditions, the CBD is the only biliary duct that can be clearly seen as a thin tubular structure with echogenic walls that in the majority of cases runs anteriorly and parallel to the PV at the level of the hepatic hilum (Figure 3.8). However, the anatomical relationship of the biliary ducts and the portal vessels may vary along their course, and usually the peripheral biliary ducts (which are only clearly visible when dilated or significantly thickened) run posteriorly to the PV (Figures 3.9 and 3.10).
The CBD measures between a minimum of 2–3 mm and an upper limit of 6–7 mm. Larger calibres are observed, especially post cholecystectomy and with age, where it is generally accepted that the calibre may increase by 1 mm each decade after 70 years [3].
Liver Vascular Anatomy
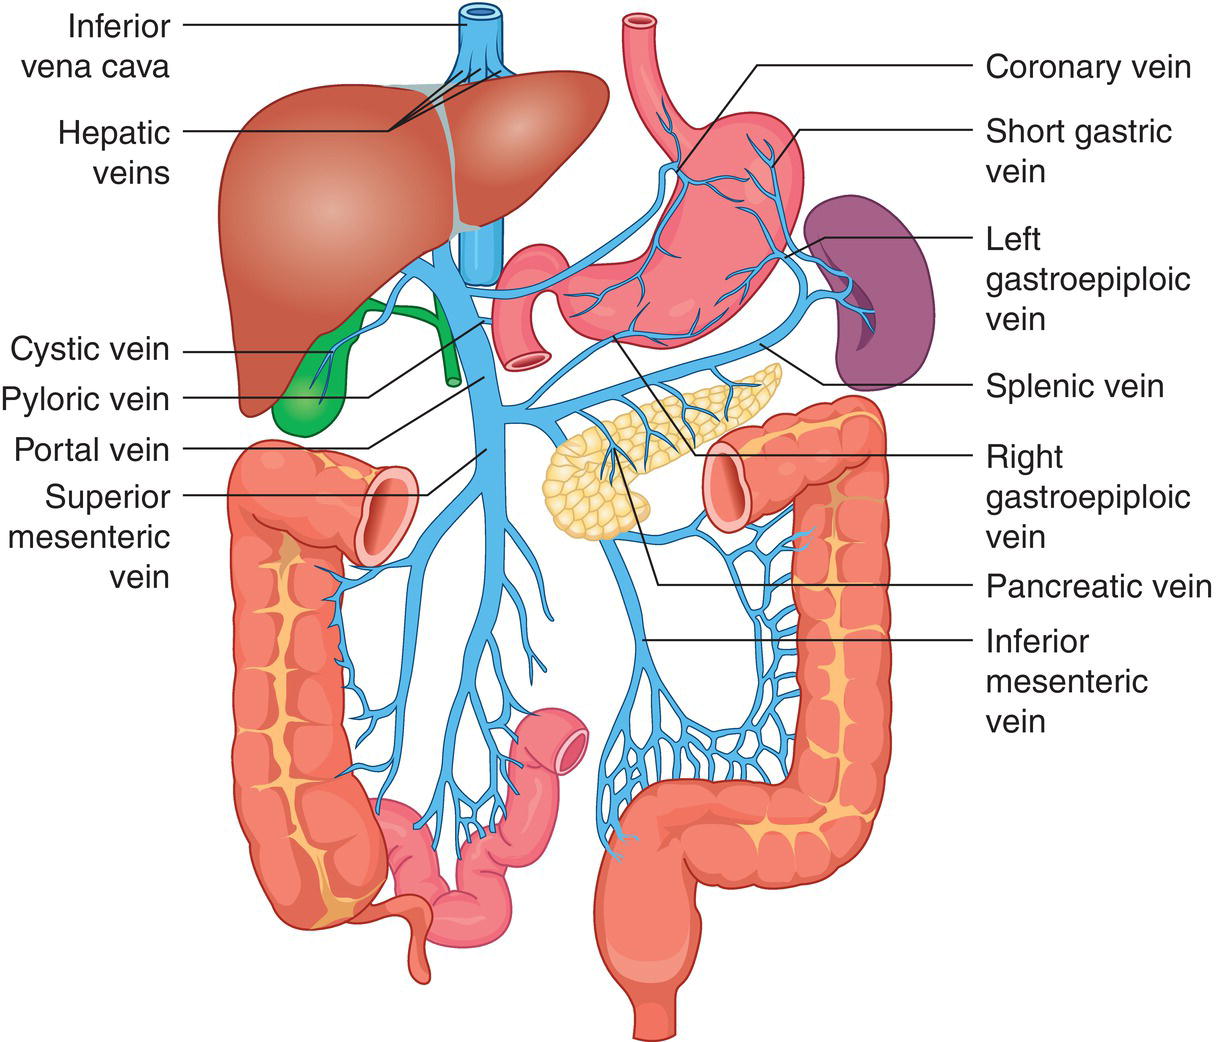
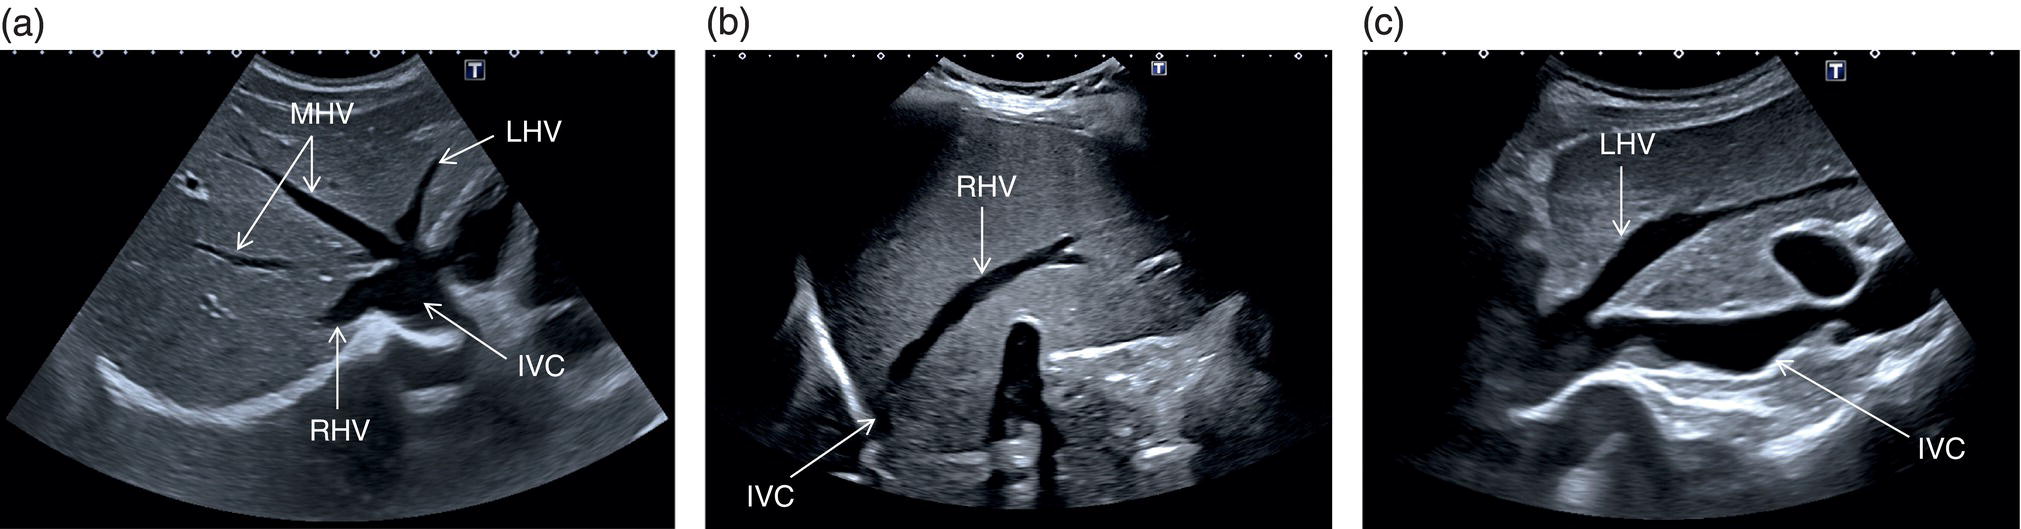
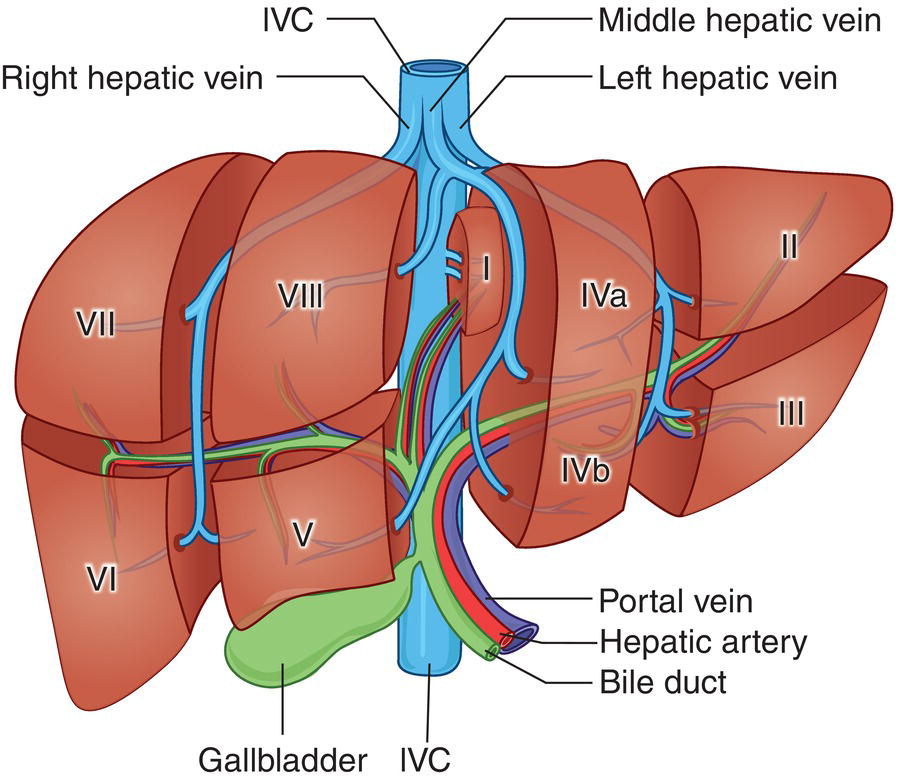
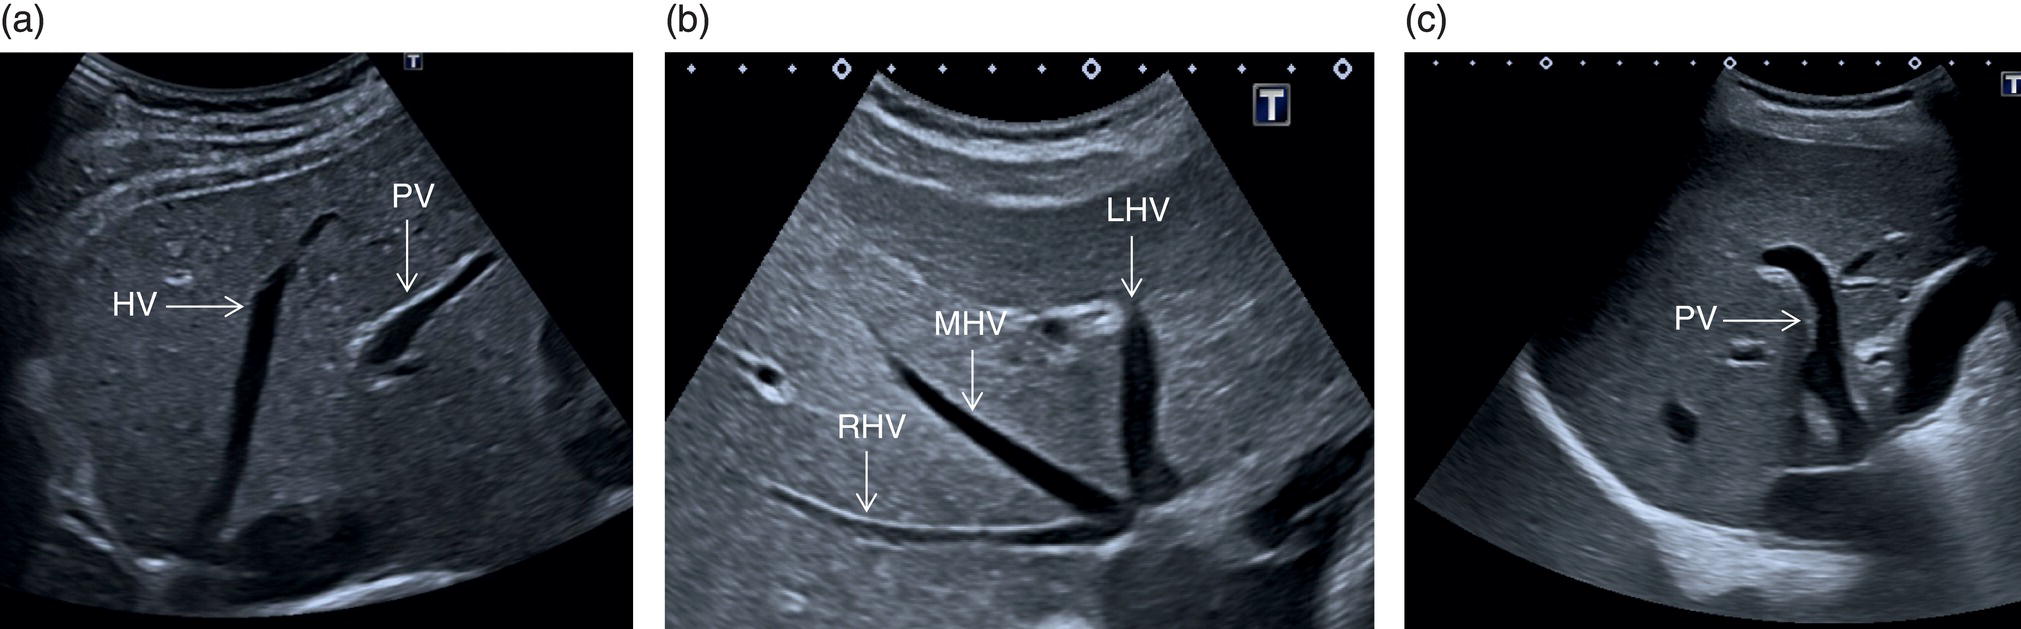
The PV is formed by the confluence of the superior mesenteric vein and the splenic vein, draining the blood of the whole digestive system and spleen (Figure 3.11). Under physiological conditions the portal venous system delivers 75% of the total hepatic inflow, whereas the hepatic artery (HA) is responsible for the remaining 25%. It is important to keep in mind the physiology and pathophysiology of the hepatic blood inflow, since during the progression of liver disease, especially when cirrhosis and portal hypertension develop, the portal venous inflow is reduced while the arterial hepatic inflow is increased (See Chapter 8). The PV can be recognised on ultrasound as a tubular structure with a variable normal calibre of approximately 8–12.5 mm, with thick echogenic walls that enters the liver together with the HA at the level of the hepatic hilum. It is followed by the HA and the biliary system in its whole intrahepatic course and for a short portion in its extrahepatic tract at the level of the porta hepatis, where it is contained within the hepatoduodenal ligament. Upon entering the liver, the PV and HA divide into the left and right branches, with further divisions providing the blood supply to each of the eight main liver segments (Figure 3.12). At the periphery of the liver lobules the arterial and venous blood mix and enter the sinusoids, terminating finally in the central veins that converge to form the right (RHV), middle (MHV), and left hepatic veins (LHV) that finally drain into the IVC (Figure 3.13). It is of note that the caudate lobe is drained independently by a main or multiple small pericaval veins. Its independent venous drainage system is the reason why the caudate lobe typically hypertrophies in advanced chronic liver disease. In Budd–Chiari syndrome, this compensatory mechanism is even more pronounced, since while the main three hepatic veins are obstructed, the pericaval ones often remain patent, leading to an abnormally hypertrophied caudate lobe (See Chapter 11).
Vascular Segments of the Liver
Based on the divisions of the portal and hepatic veins, the liver may be divided into eight segments, as first suggested by the French surgeon Claude Couinaud in 1957 (Figure 3.14) [4]. This classification relies on the fact that each of these segments has its own individual blood supply and might be resected without jeopardising the viability of other segments. In this classification, the liver segments II and III are situated to the left of the LHV and falciform ligament, and the left branch of the PV (LPV) divides them into segment II (above the PV) and segment III (below the LPV). Segment IV is situated between the LHV and the MHV and the LPV divides them into segment IVA (above the LPV) and segment IVB (below the LPV). Segments V and VIII are located between the MHV and RHV, whereas segments VI and VII represent most lateral segments situated to the right of the RHV. The right branch of the RPV divides segment V (caudal) from VIII (cranial) and segment VI (caudal) from VII (cranial) (Figure 3.15). On the dorsal, central part of the liver, between the IVC and the venous ligament, lies the caudate lobe that corresponds to segment I (Figures 3.6 and 3.12c).
Normal Variants of Liver Anatomy
Liver anatomical variants might be related to the shape, size, and vasculature, as well as the GB and biliary tree. Parenchymal variants include diaphragmatic slips, sliver of liver, Riedel’s lobe, and papillary process of the caudate lobe [5]. Diaphragmatic slips represent incomplete accessory fissures at the site of the diaphragmatic liver surface due to invagination of the diaphragm (Figure 3.16). A sliver of the liver refers to an anatomical variant where the left liver lobe extends to the left hypochondrium, wrapping around part of the spleen (Figure 3.17). Another common variant is a Riedel’s lobe, represented by a downward tongue‐like projection of the lower anterior edge of the right liver lobe (segment VI), sometimes so pronounced as to extend along the right paracolic space up to the iliac fossa (Figure 3.18) [6]. The papillary process is an anterior and medial extension of the caudate lobe, which might resemble a lymph node or mass next to the pancreatic head or IVC (Figure 3.19).
Other anatomical variants include the position of the PV, HA, and CBD at the level of the hepatic hilum. In the majority of cases the PV lies posteriorly, and the HA lies between the PV and the above CBD, while less frequently the HA will run above the CBD (Figure 3.20) or below the PV. The main trunk of the PV usually bifurcates at the porta hepatis into a main left and right branch and a further anterior and posterior branch of the right trunk. Alternatively the PV might have a trifurcation that might be extrahepatic or intrahepatic. The hepatic veins can also show some anatomical variants. With regard to the RHV, this is usually single and dominant, while in a minority of cases there might be an early bifurcation or trifurcation or multiple small RHVs entering the IVC. The most common variant is an accessory right inferior hepatic vein. Both the MHV and LHV can be double and sometimes form a common trunk that drains independently into the IVC. When the hepatic veins are duplicated, typically the larger is used for segment classification. The caudate lobe might have a single vein or several small hepatic veins that drain independently and directly into the IVC. The HA can have several anatomical variants, especially with regard to its origin. The most common is directly from the aorta or the superior mesenteric artery. All these vascular variants do not have pathological implications, but should be kept in mind since they have important technical implications in a case of liver transplant, resection, or embolic treatment of liver tumours [7]. Rare vascular anatomical variants include congenital portal venous shunting (see Chapter 11).
Practical Approach for How to Scan the Liver
In Chapter 2, the optimisation of the scanner to achieve the best image quality was outlined. However, this not only relies on the scanner capabilities, but also on the operator‐ and patient‐related factors. It is very important that the operator has anatomical, physiological, and good clinical knowledge, as well as the ability to interpret the sonographic images. They should also be aware of potential artefacts and pitfalls in order to corroborate their findings. One of the cornerstones of ultrasound scanning technique compared to other modalities is its dynamic nature.
In order to ensure that an organ has been fully assessed, the operator must continuously adapt the angle/plane of insonation. Every organ should be assessed in at least two planes, since some of the findings that are present on one plane can sometimes disappear on another, highlighting their artefactual nature. Alternatively, the presence on multiple planes may confirm a specific finding. Artefacts can also mask an underlying pathology and thus it is important to change the angle of insonation or the patient’s position. In general, moving the patient can significantly improve ultrasound imaging. For example, rotating the patient to the left decubitus will move the liver and GB anteriorly, while overlying bowel loops flop downwards, optimising liver visualisation. Deep inspiration extends the liver beyond the costal margin, allowing further assessment of the deep segments, a manoeuvre that can be very helpful, especially in patients with hypersthenic body habitus.
It is very important to highlight that despite the availability of excellent equipment and a highly skilled operator, the diagnostic confidence in excluding pathological findings can be severely limited by patient‐related factors. It is crucial to acknowledge these limitations and highlight them in the ultrasound report, since a suboptimal image may lead to an inconclusive scan and thus the need for further investigations to aid patient management.
Patient‐related factors include constitutional limitations such as obesity, narrow intercostal spaces, and severe kyphosis. Obese patients might be challenging because of thick subcutaneous tissue with reverberation artefacts limiting the visualisation of parenchymal organs. Severe steatosis leads to significant attenuation of the ultrasound image, thus making it difficult to visualise the most posterior and deep liver segments. Within limits, adjusting the gain, harmonics, increasing penetration, and the availability of new software and probes may enable some improvement in image resolution. However, not all ultrasound machines are equipped with new‐generation software or dedicated ultrasound transducers specifically designed for the larger patient.
Very narrow intercostal spaces and severe kyphosis found in some physical conditions, and particularly in elderly patients, limit the intercostal acoustic window for assessing the right and left lobes.
Poor patient compliance can also often be encountered, leading to difficult scanning and suboptimal imaging. The reasons for this include patients’ mental status, abdominal pain, or respiratory distress. All these conditions are challenging. For example, a patient might need an ultrasound scan for abdominal pain, which may be exacerbated by increased pressure exerted by the ultrasound transducer during the examination. A dyspnoeic patient is always challenging, since the optimal scanning position would be in a supine or lateral decubitus position. These patients will have difficulty in maintaining these positions and a degree of innovation is needed sometimes, for instance by scanning posteriorly. For some patients it may be difficult to hold a deep breath, even for a few seconds, thus excluding this useful manoeuvre in optimising liver parenchymal visualisation. Patient compliance secondary to psychological issues may also be encountered and the operator may find a non‐cooperative patient refusing to undergo the required examination. Specifically, patients with advanced cirrhosis are sometimes encephalopathic, which could lead to a very challenging interaction during the exam. Finally, gas in the gastrointestinal tract is one of the most common and difficult limitations to abdominal ultrasound imaging. The recommendation is that patients undergo a period of at least six hours of fasting to maximise GB distension and also reduce food residue and gas in the upper gastrointestinal tract to optimise scanning conditions [2].
Liver Parenchyma Assessment
Liver ultrasound assessment requires careful scanning of all segments while evaluating the echotexture, echogenicity, margins, and contour. There are no strict rules on how to scan the liver, but rather a suggestion of a systematic approach in order to provide a concise description of liver anatomy and ensure that the whole liver and associated vascular and biliary structures are assessed completely.
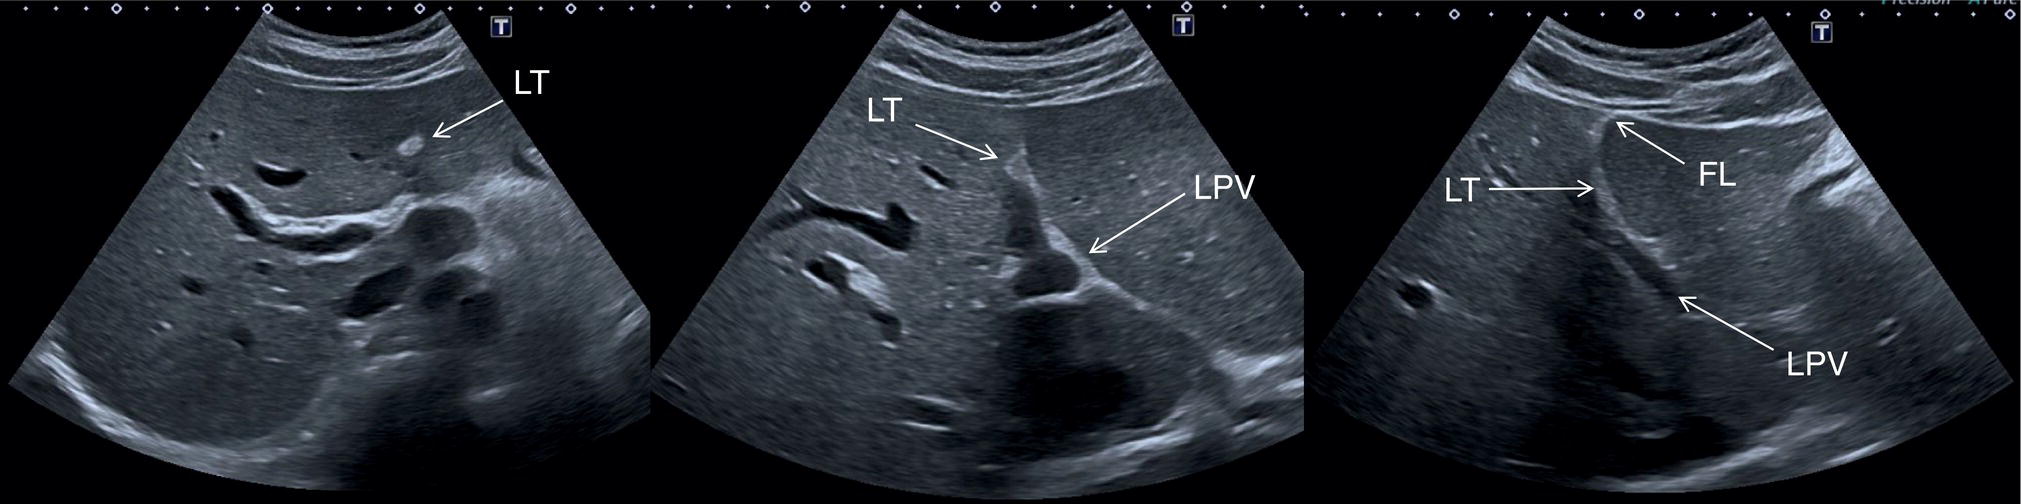
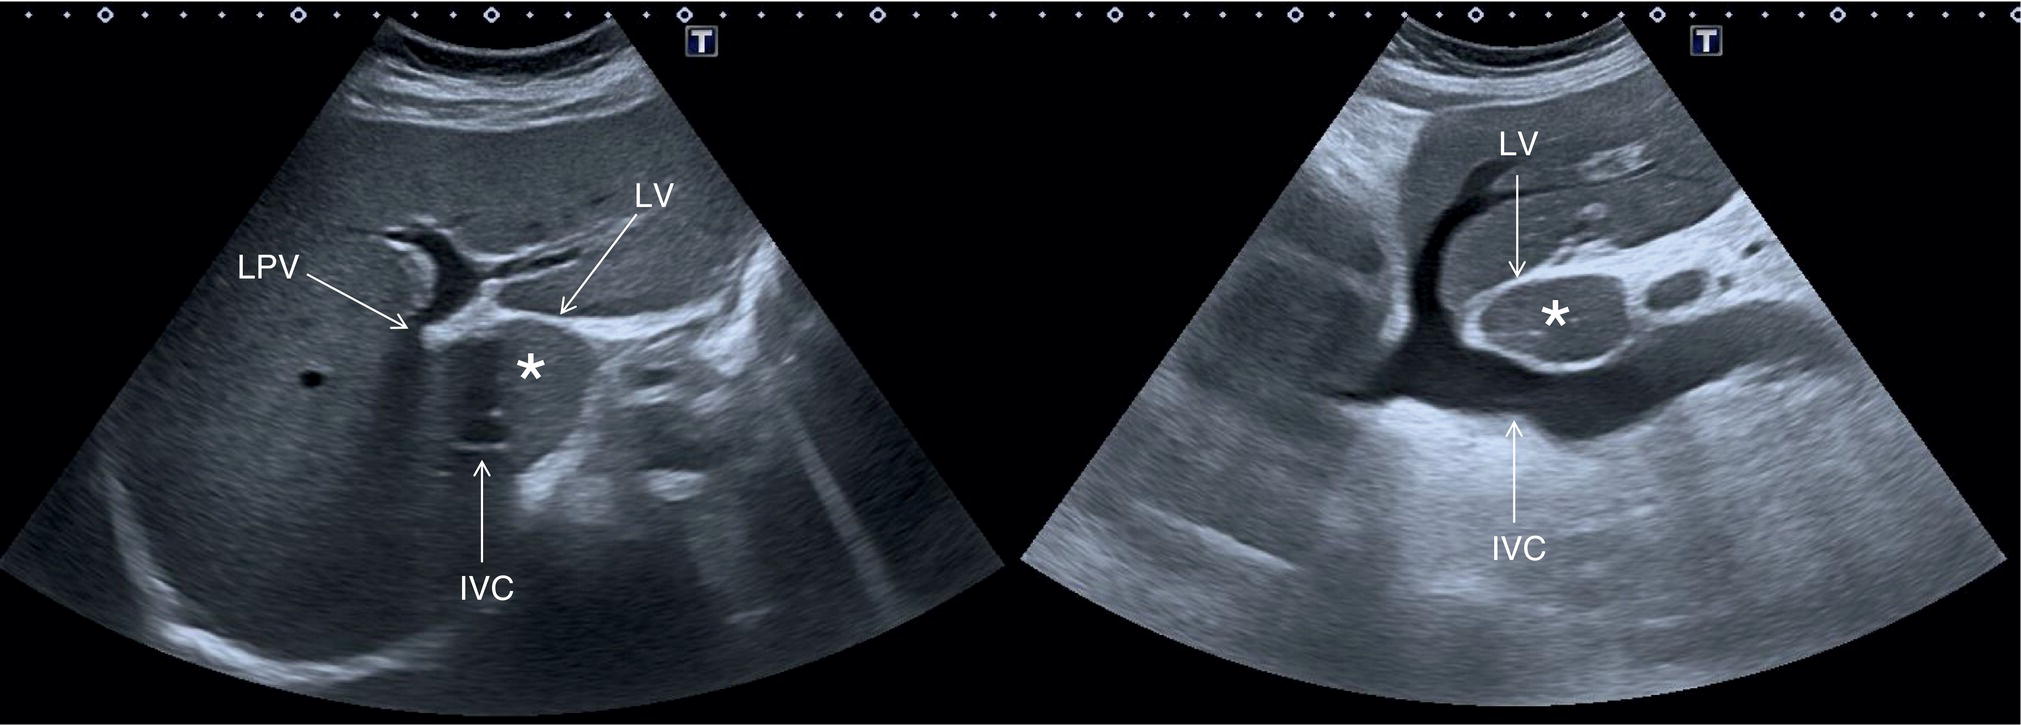
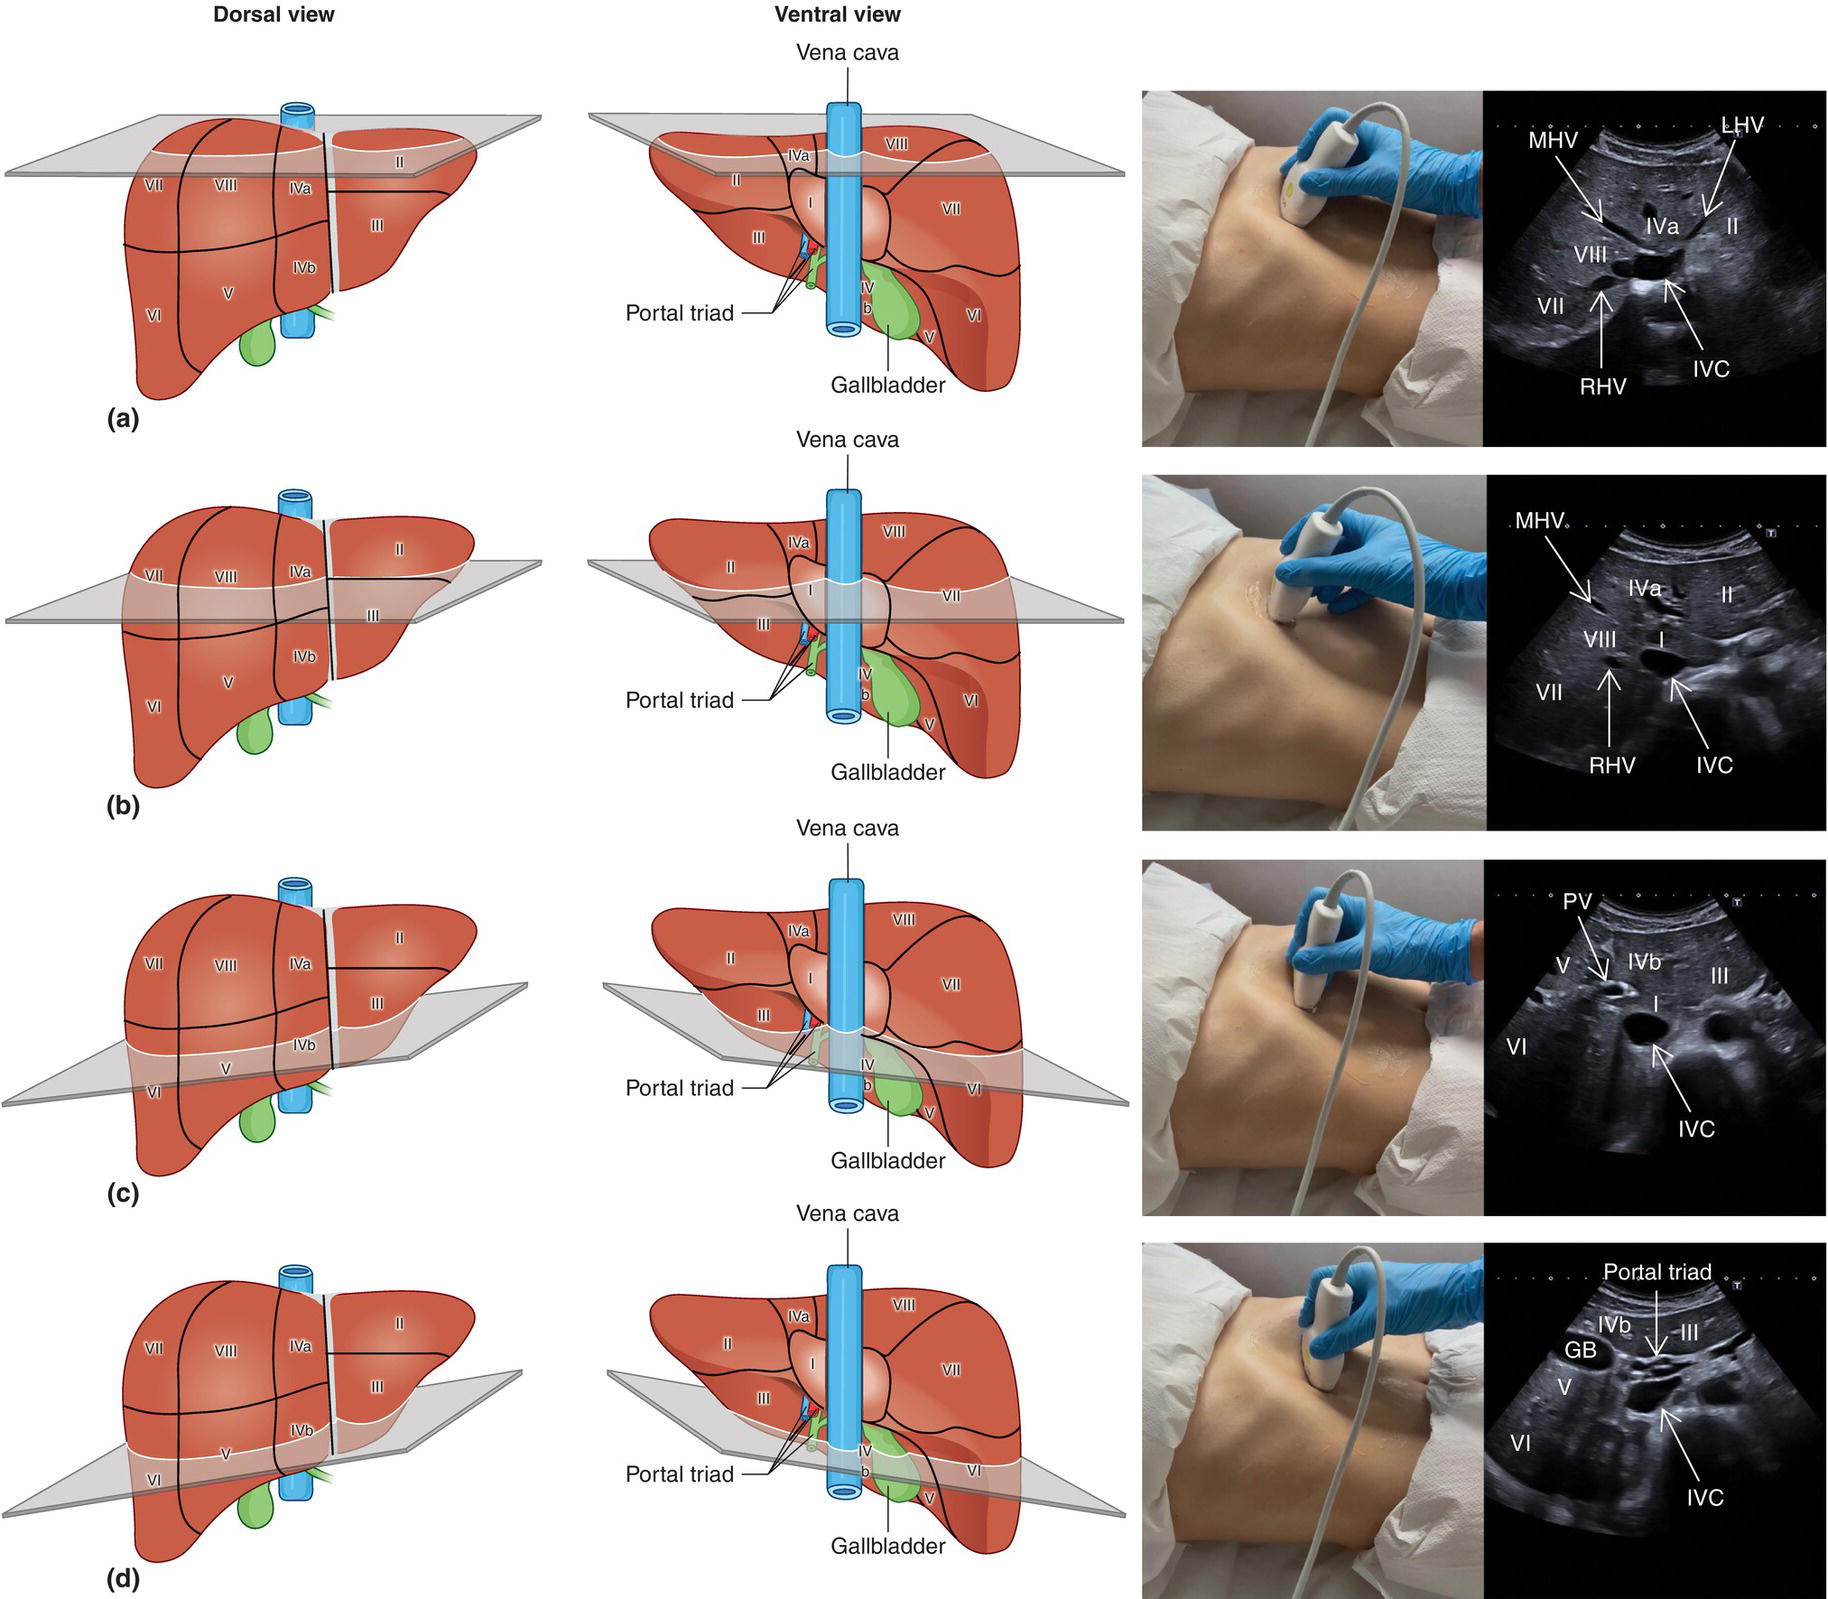
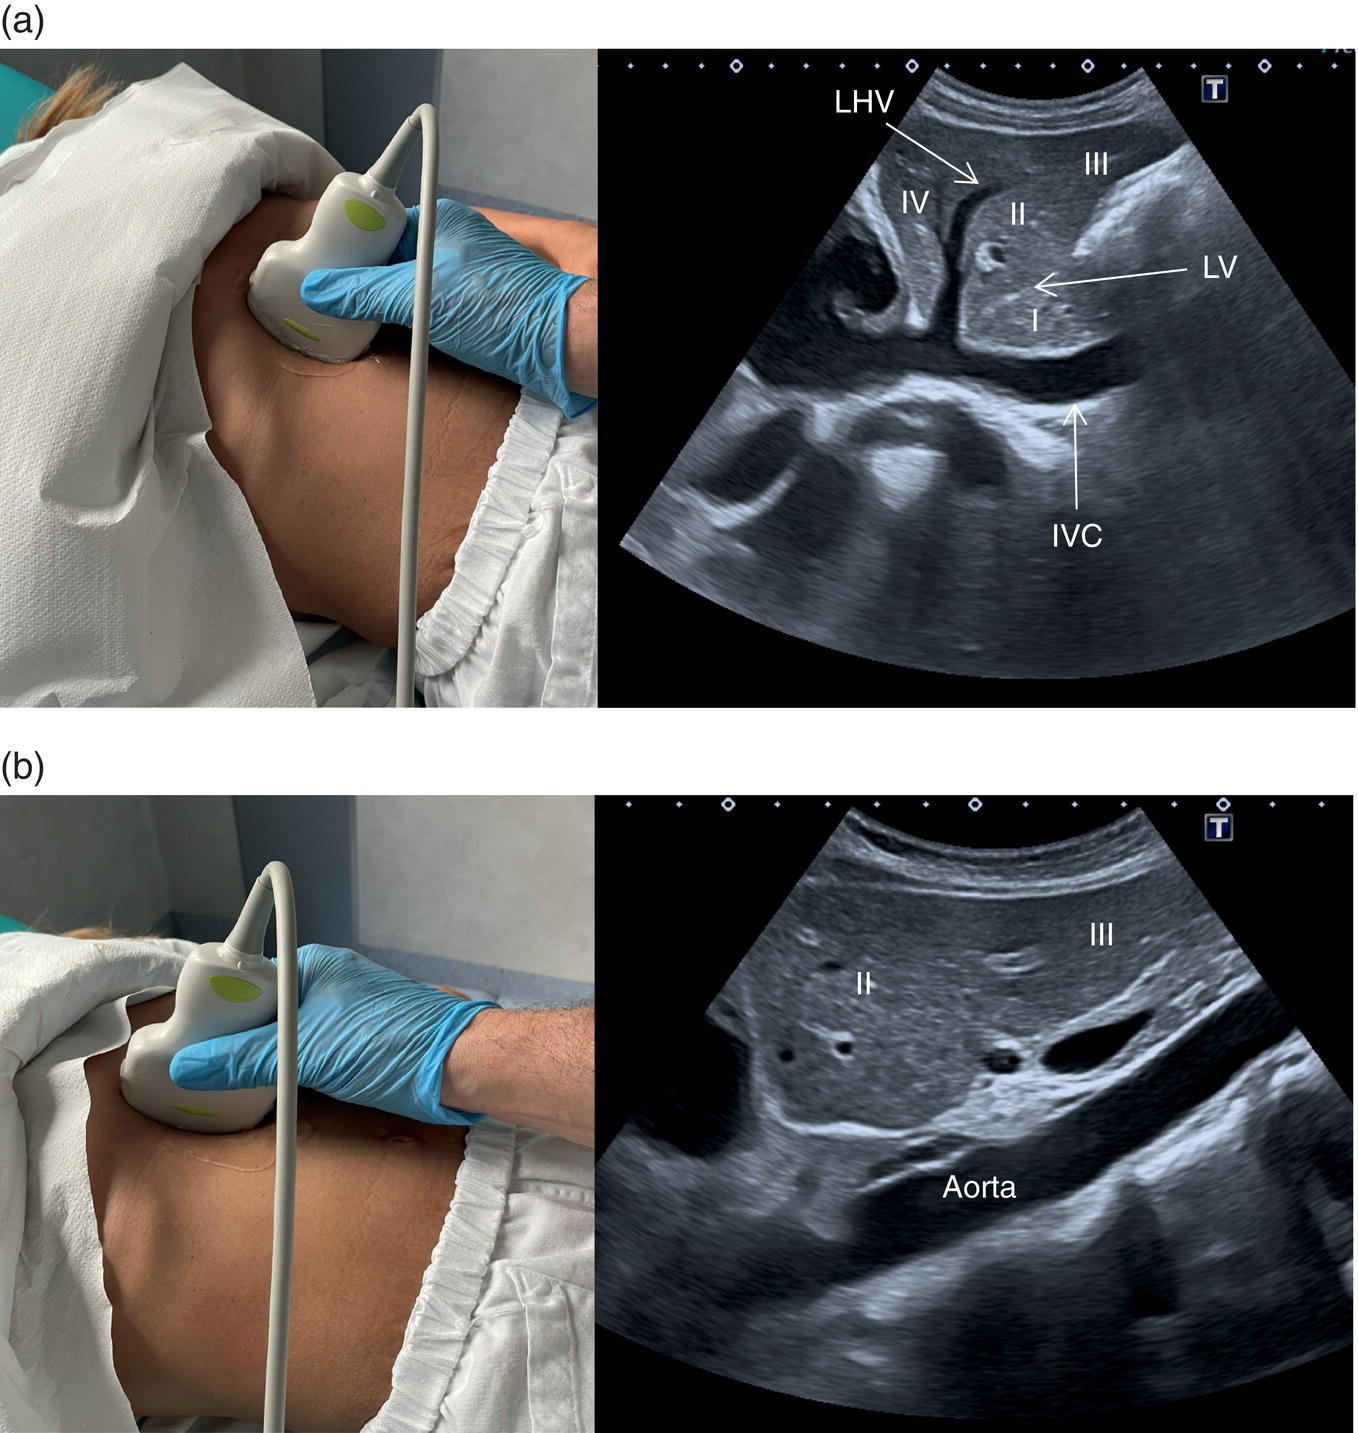
Start by scanning in the longitudinal scan (LS) plane within the epigastrium, showing segments I and II of the liver, the aorta, and the IVC. Ensure that you sweep from right to left of these liver segments to assess for any focal lesions, contour abnormalities, or biliary tree dilatation. When sweeping left (towards the right side of the patient), the IVC will be more clearly visible, with the caudate lobe well defined between the IVC and the ligamentum venosum (Figure 3.21a); when sweeping right (towards the left side of the patient) the aorta will appear running posteriorly to the left lobe (Figure 3.21b) (see Videos 3.1a and b). Of note are the possibility of accessory lobes (normal anatomical variants), particularly of segment II, which can extend to the left upper quadrant and around the spleen (Figure 3.17). 
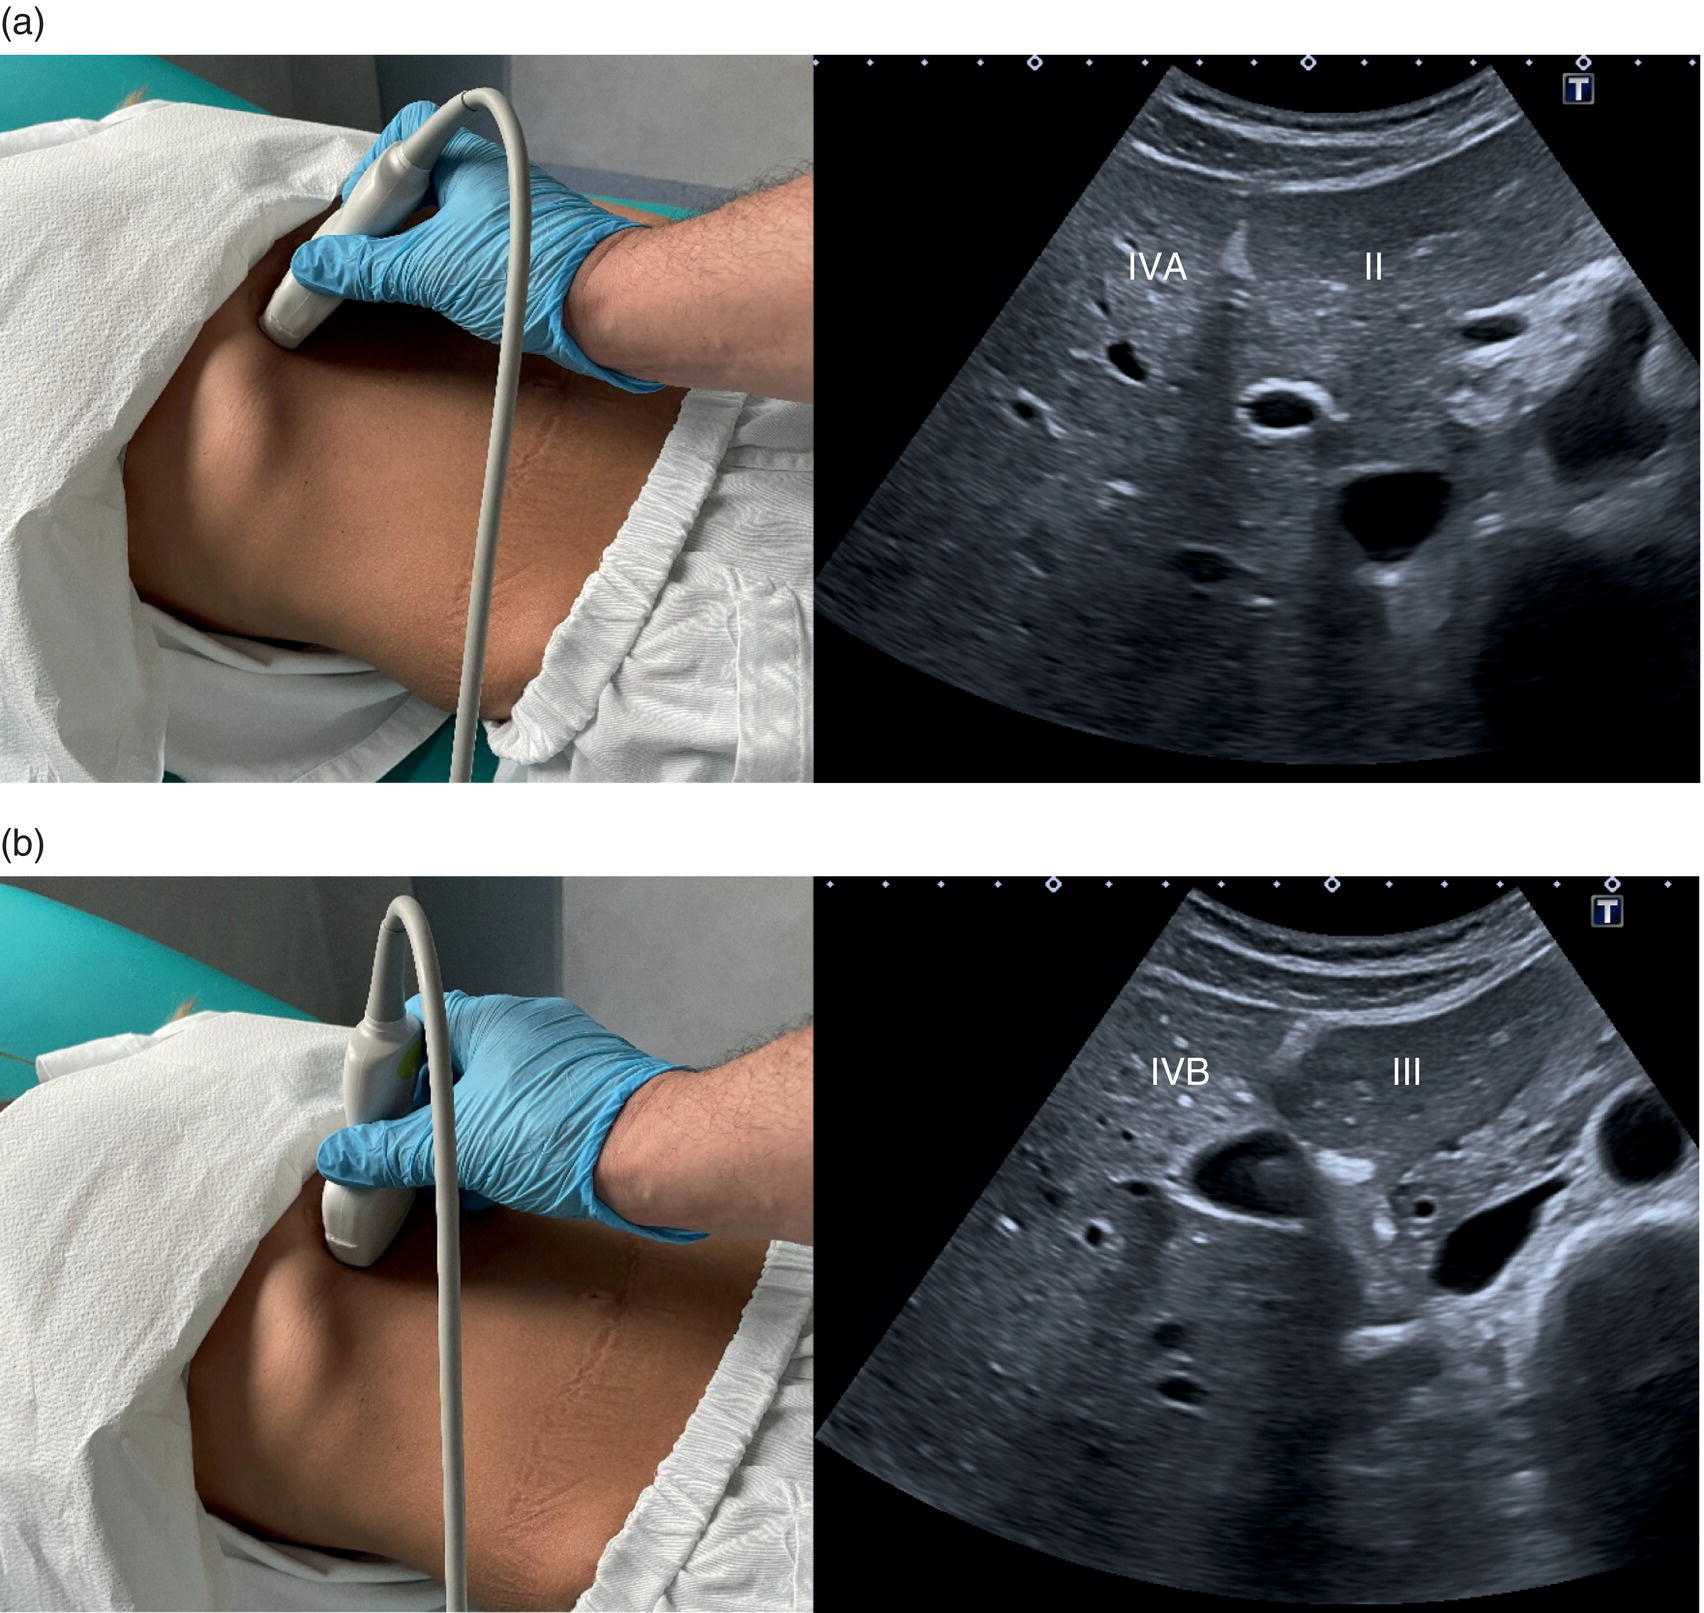
 Next, bearing in mind that the LHV represents the boundary between segments II/III and IV, turn the probe into the transverse scan (TS) plane and then sweep up and down, ensuring that these liver segments are also visualised in the orthogonal plane. By doing so segment IVA will be visualised in the most cranial plane next to segment II, and segment IVB will be visualised just below, next to segment III (Figure 3.22). Segment IV should also be imaged in LS view (Figures 3.21 and 3.23) (Videos 3.2 and 3.3). Be aware of the appearance of the ligamentum teres in the TS plane, since it may mimic a hyperechoic focal lesion, and keep in mind that all structures need to be visualised in at least two planes (Figure 3.5) (Video 3.4).

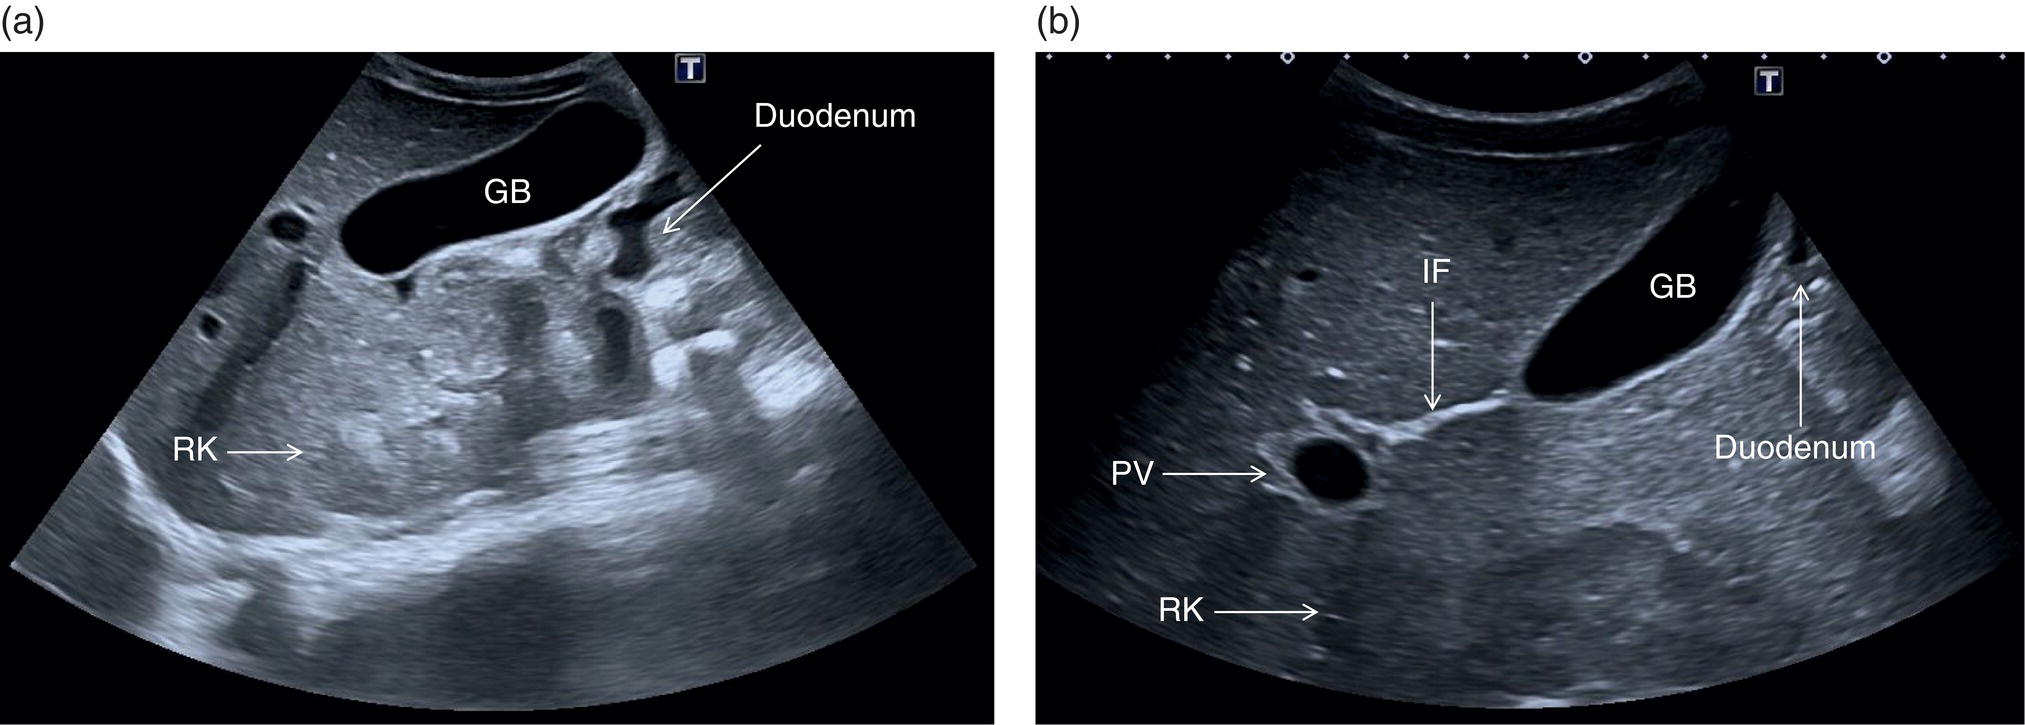
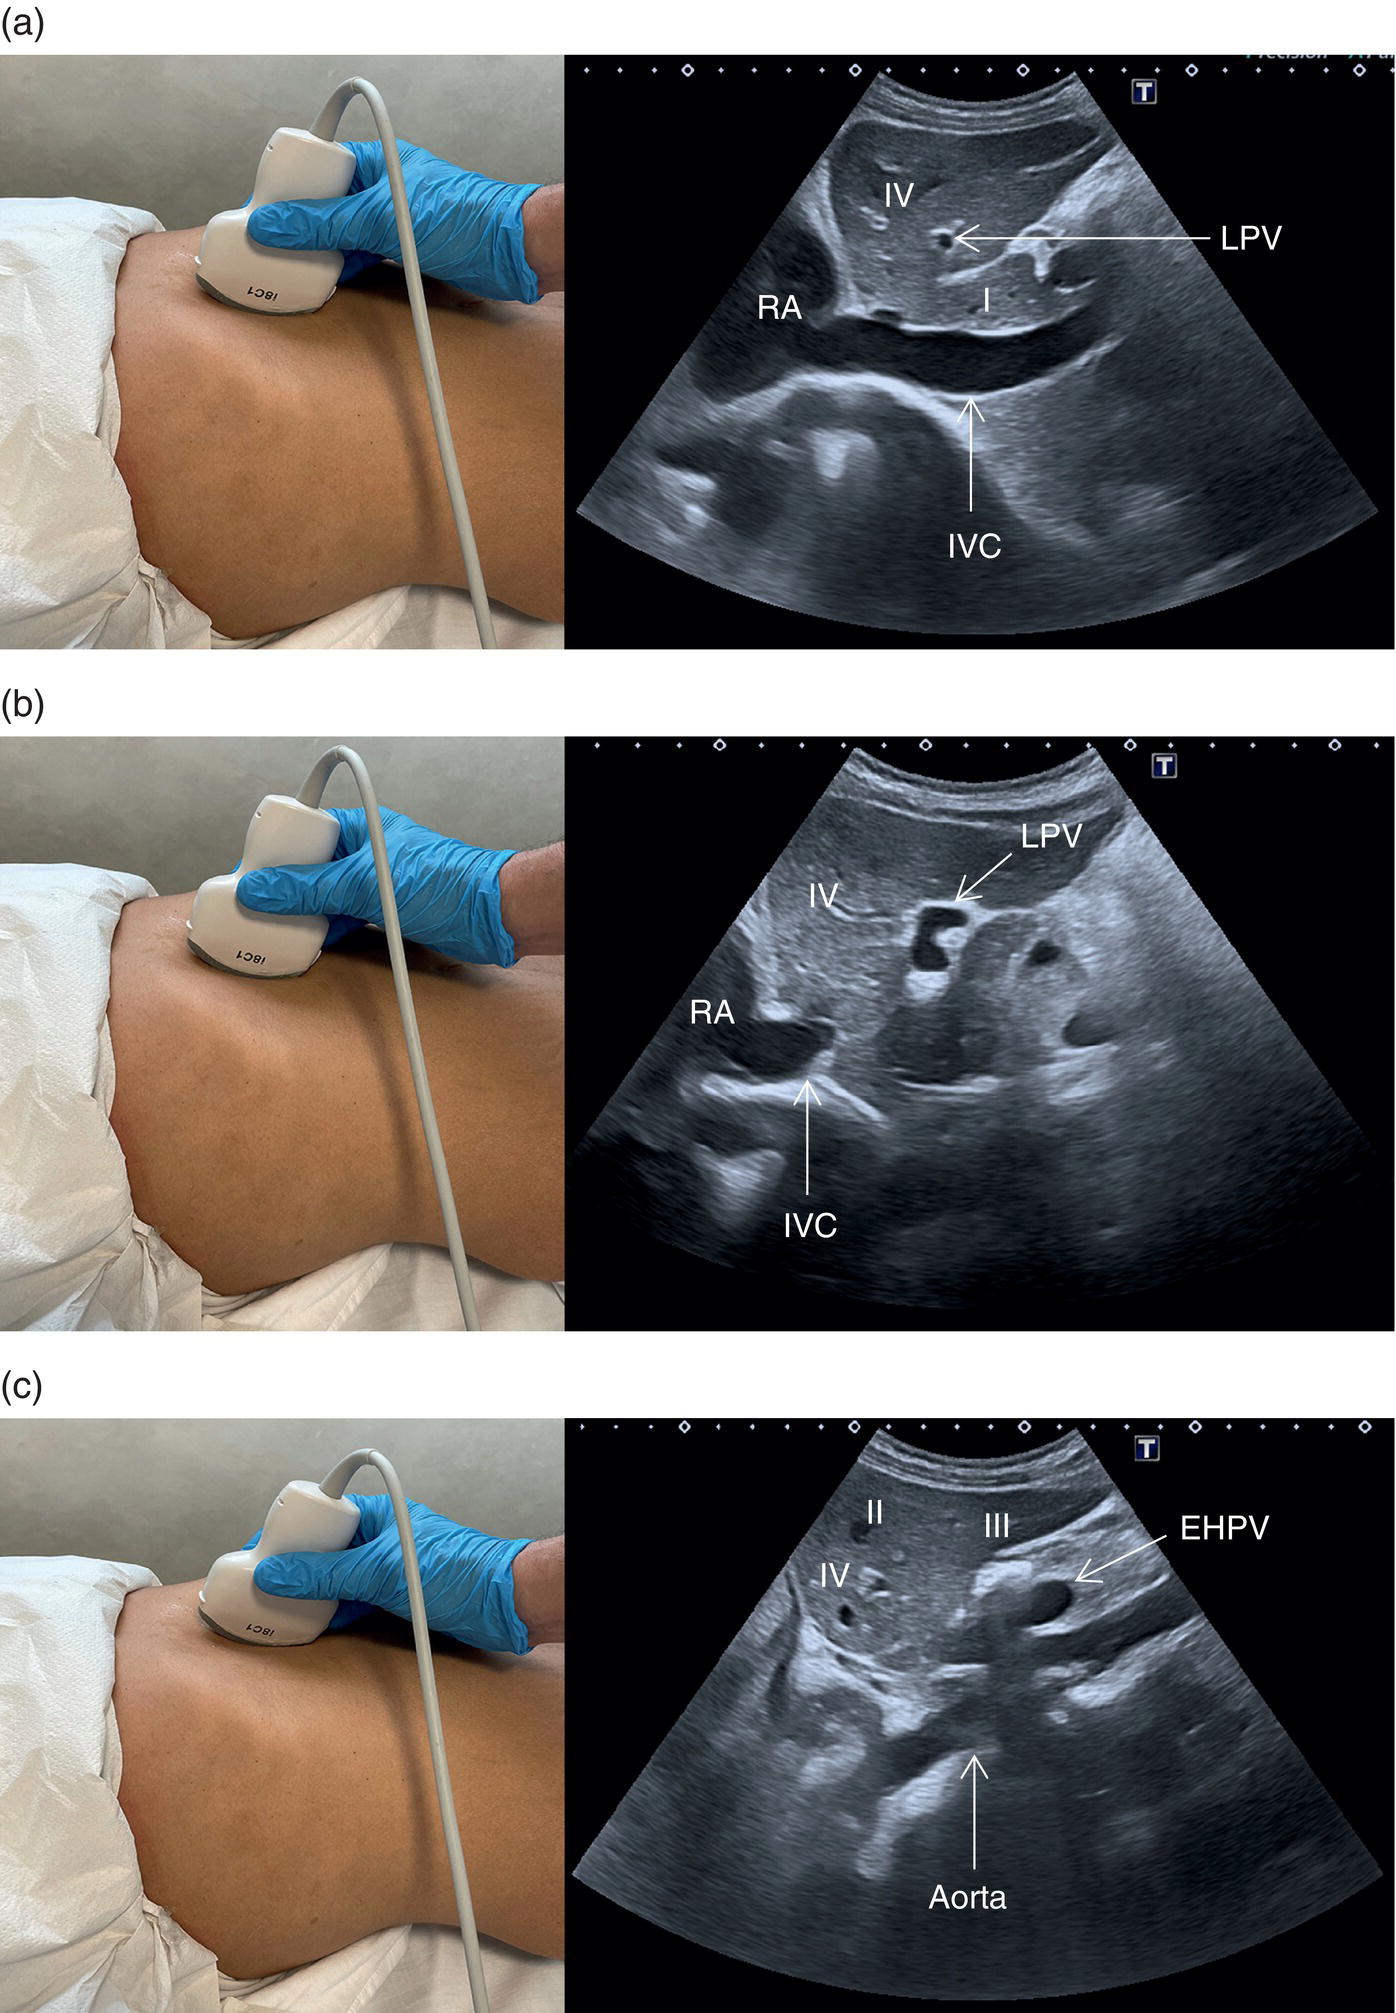
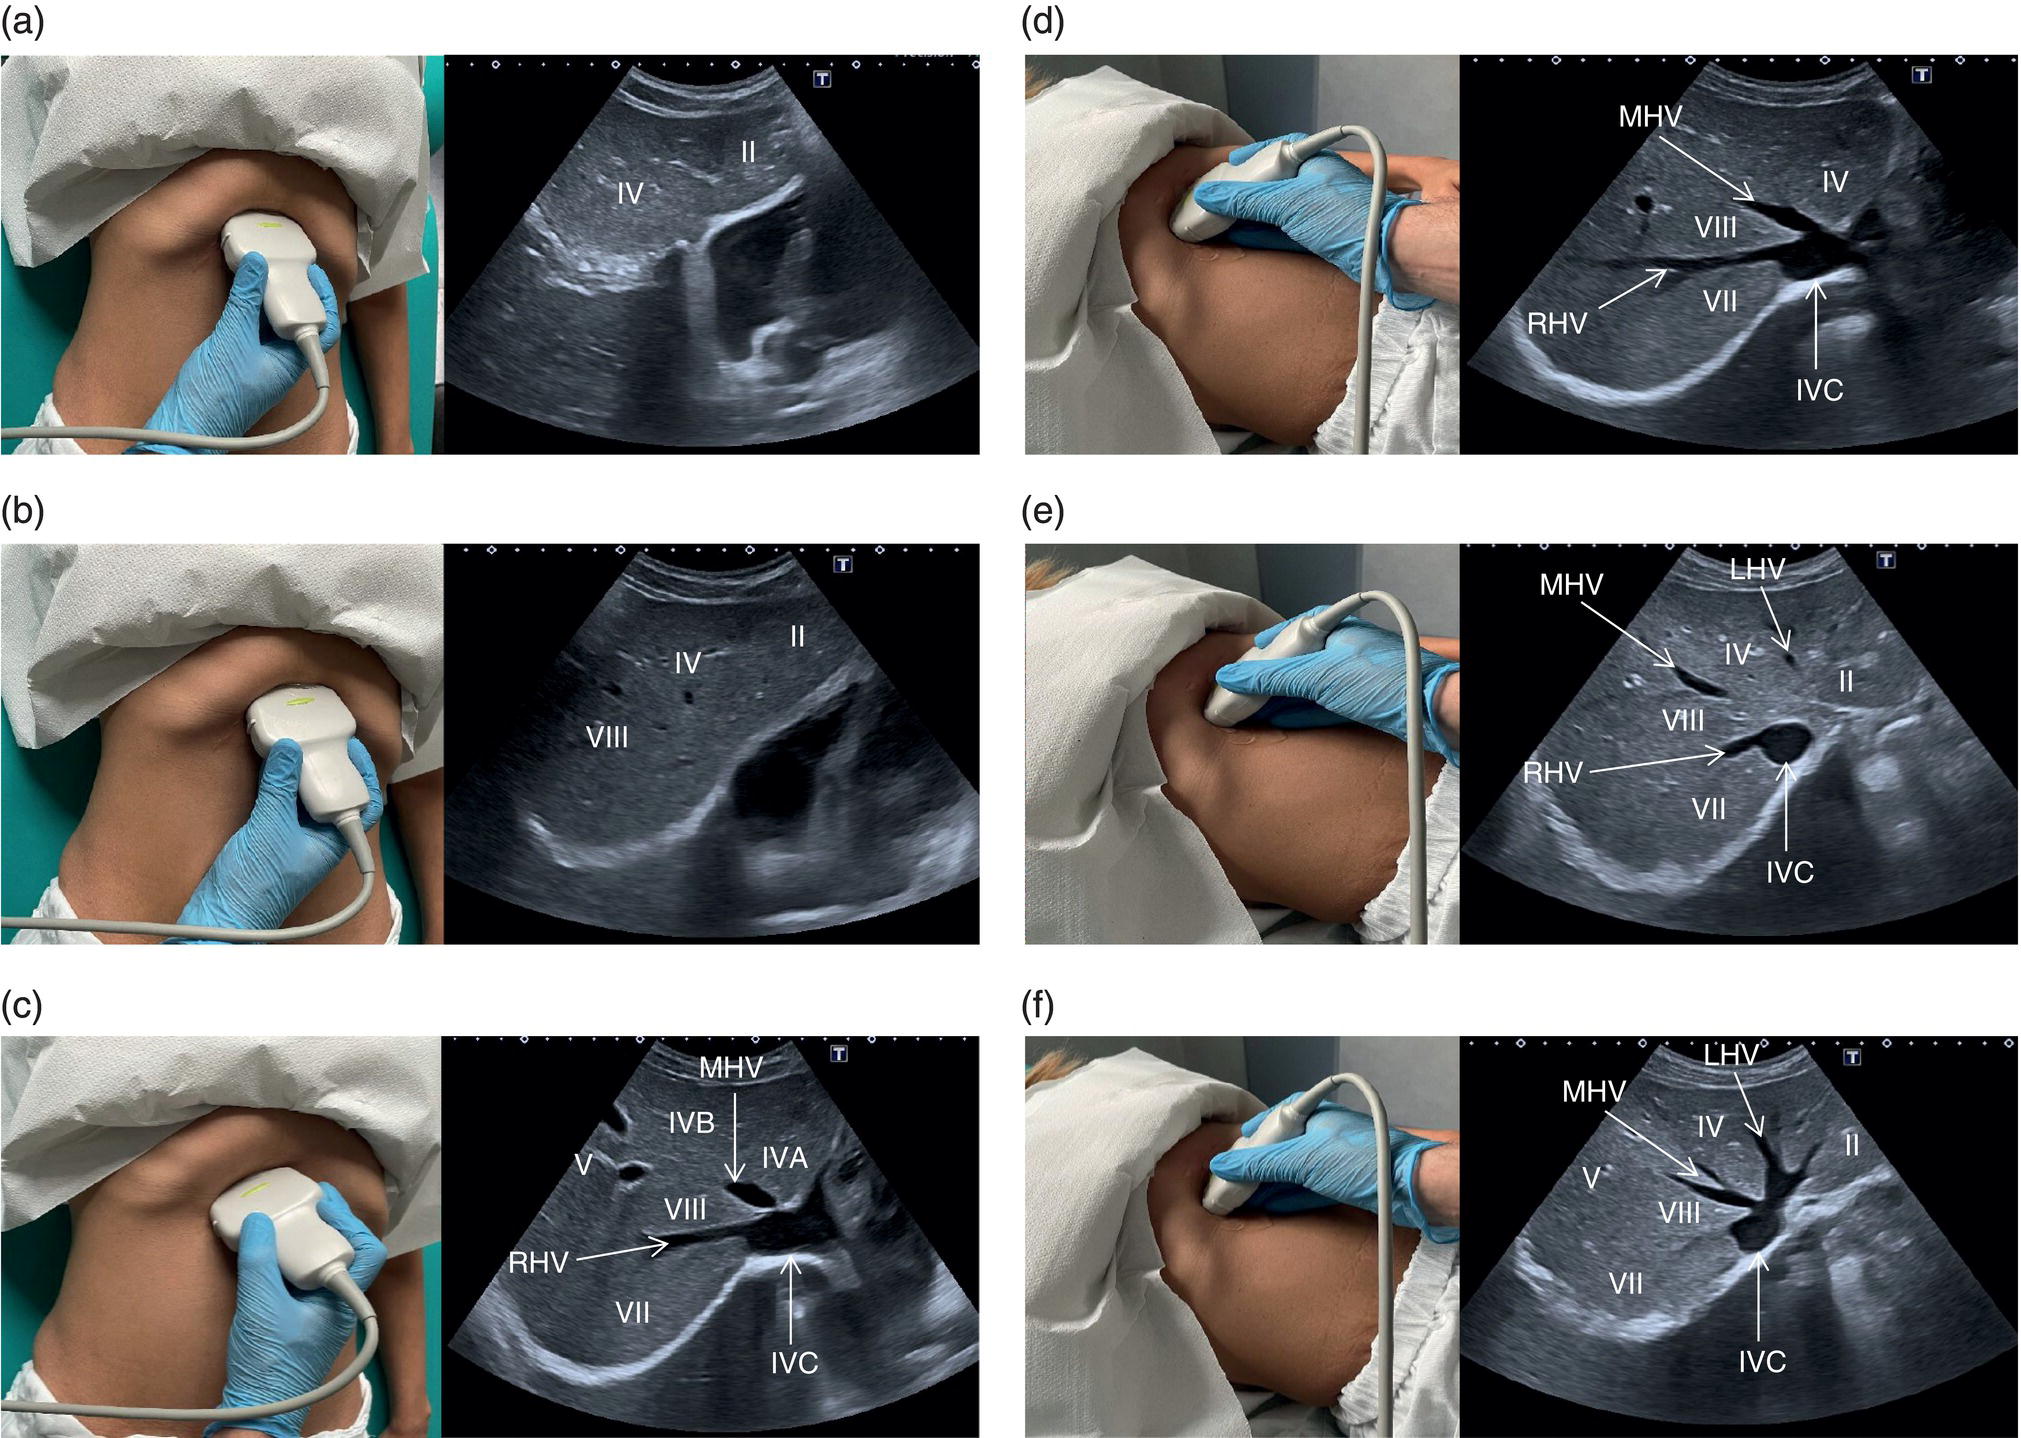
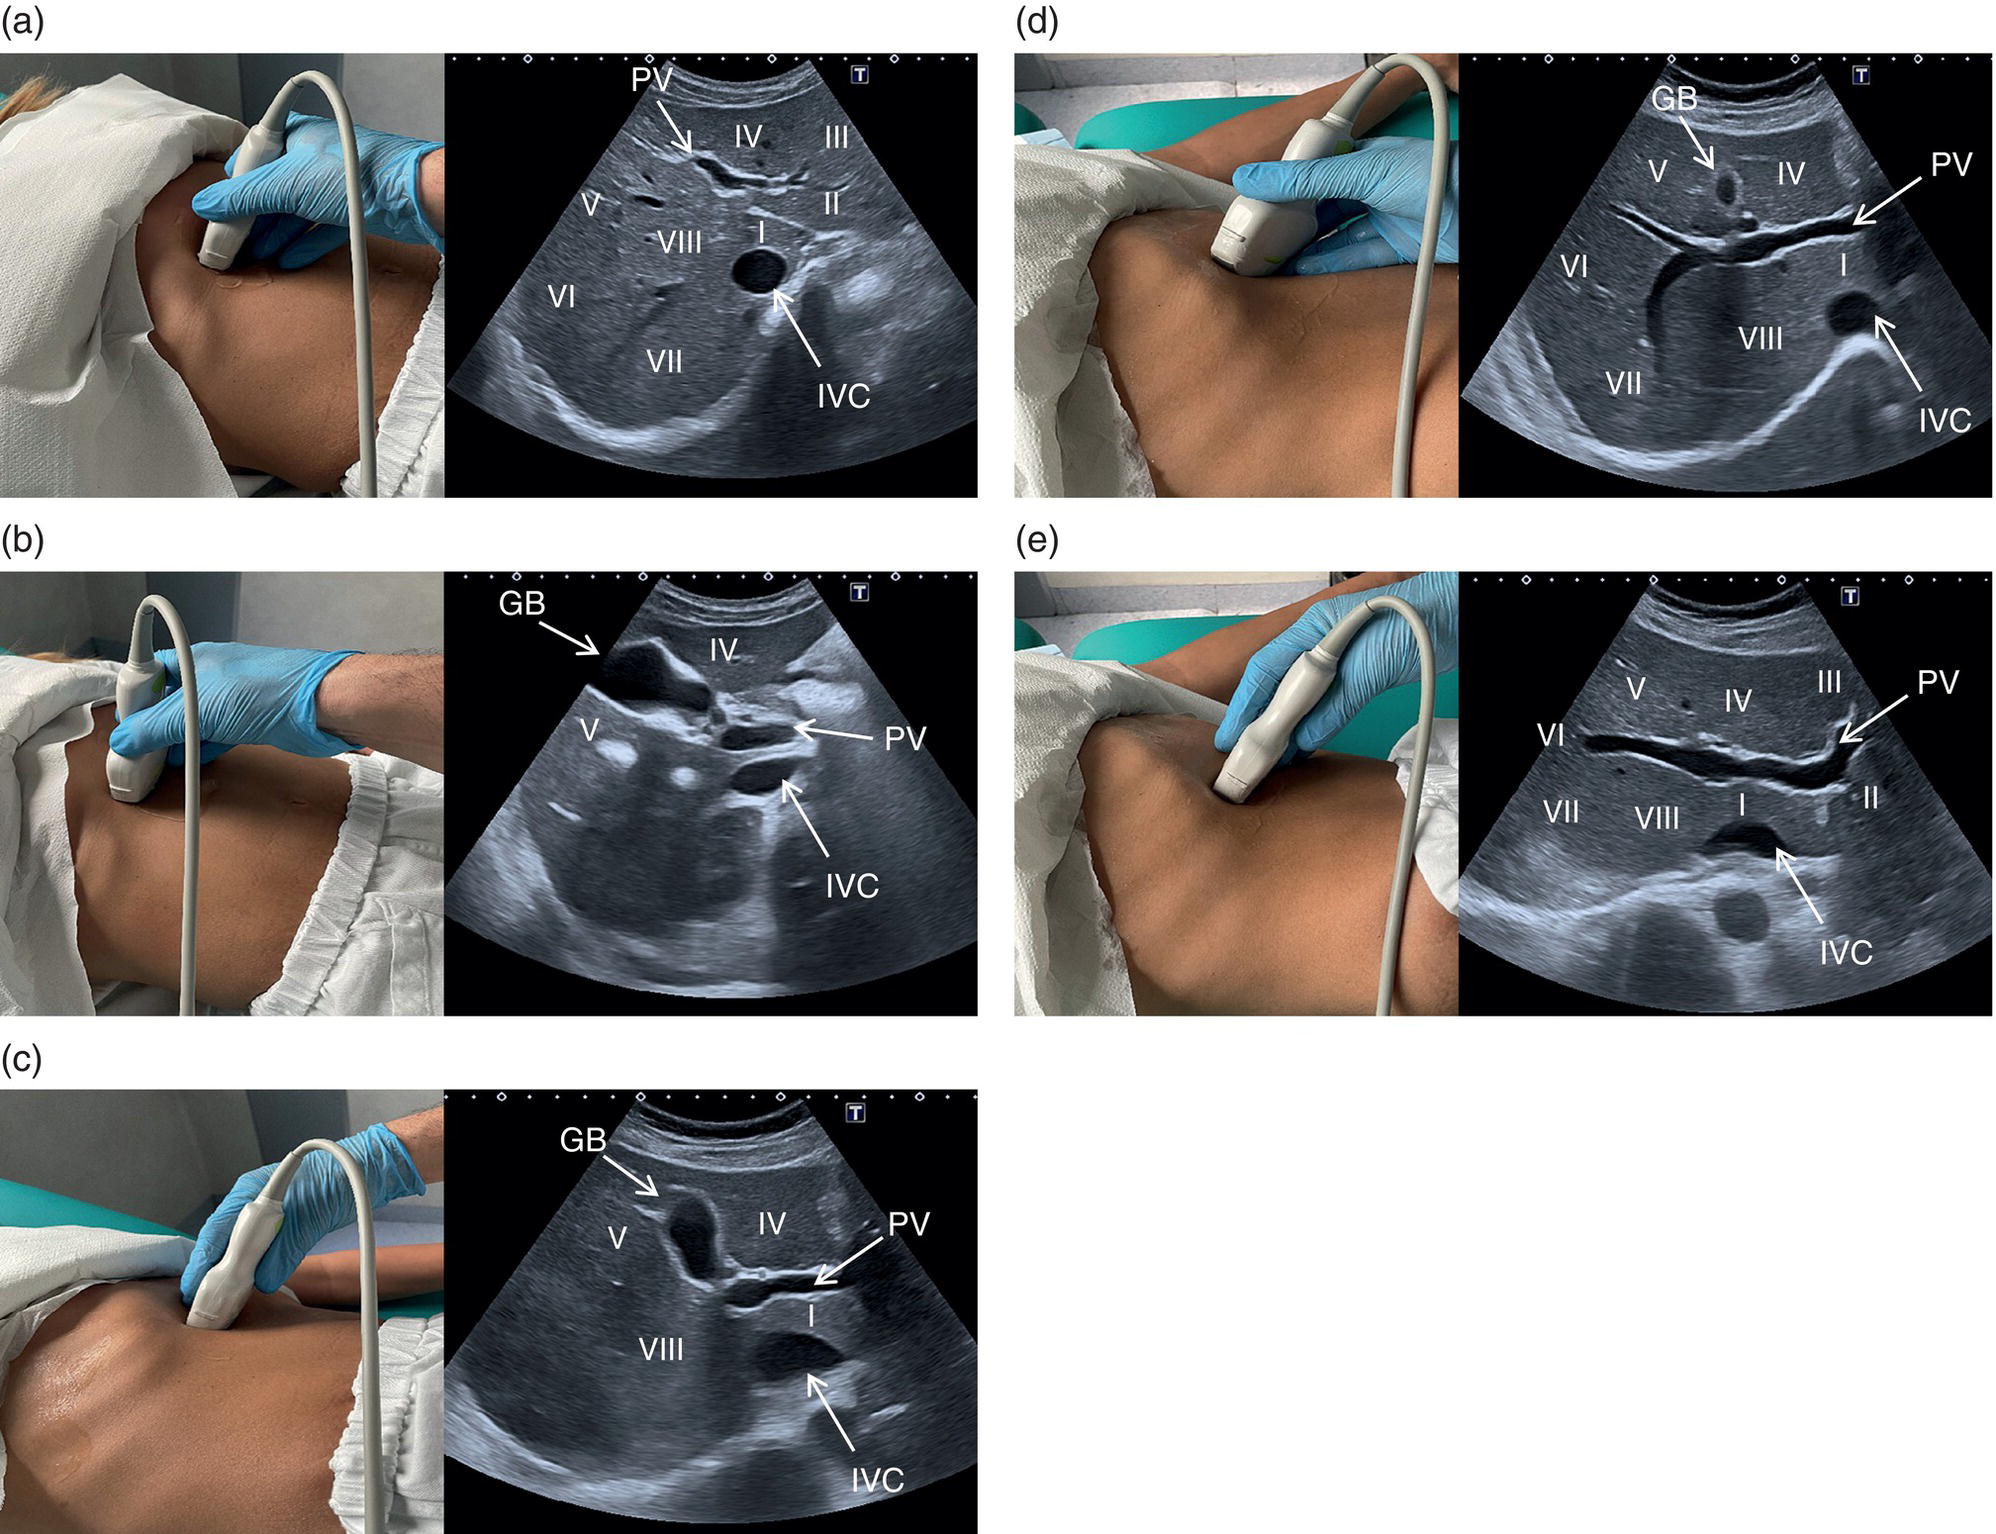
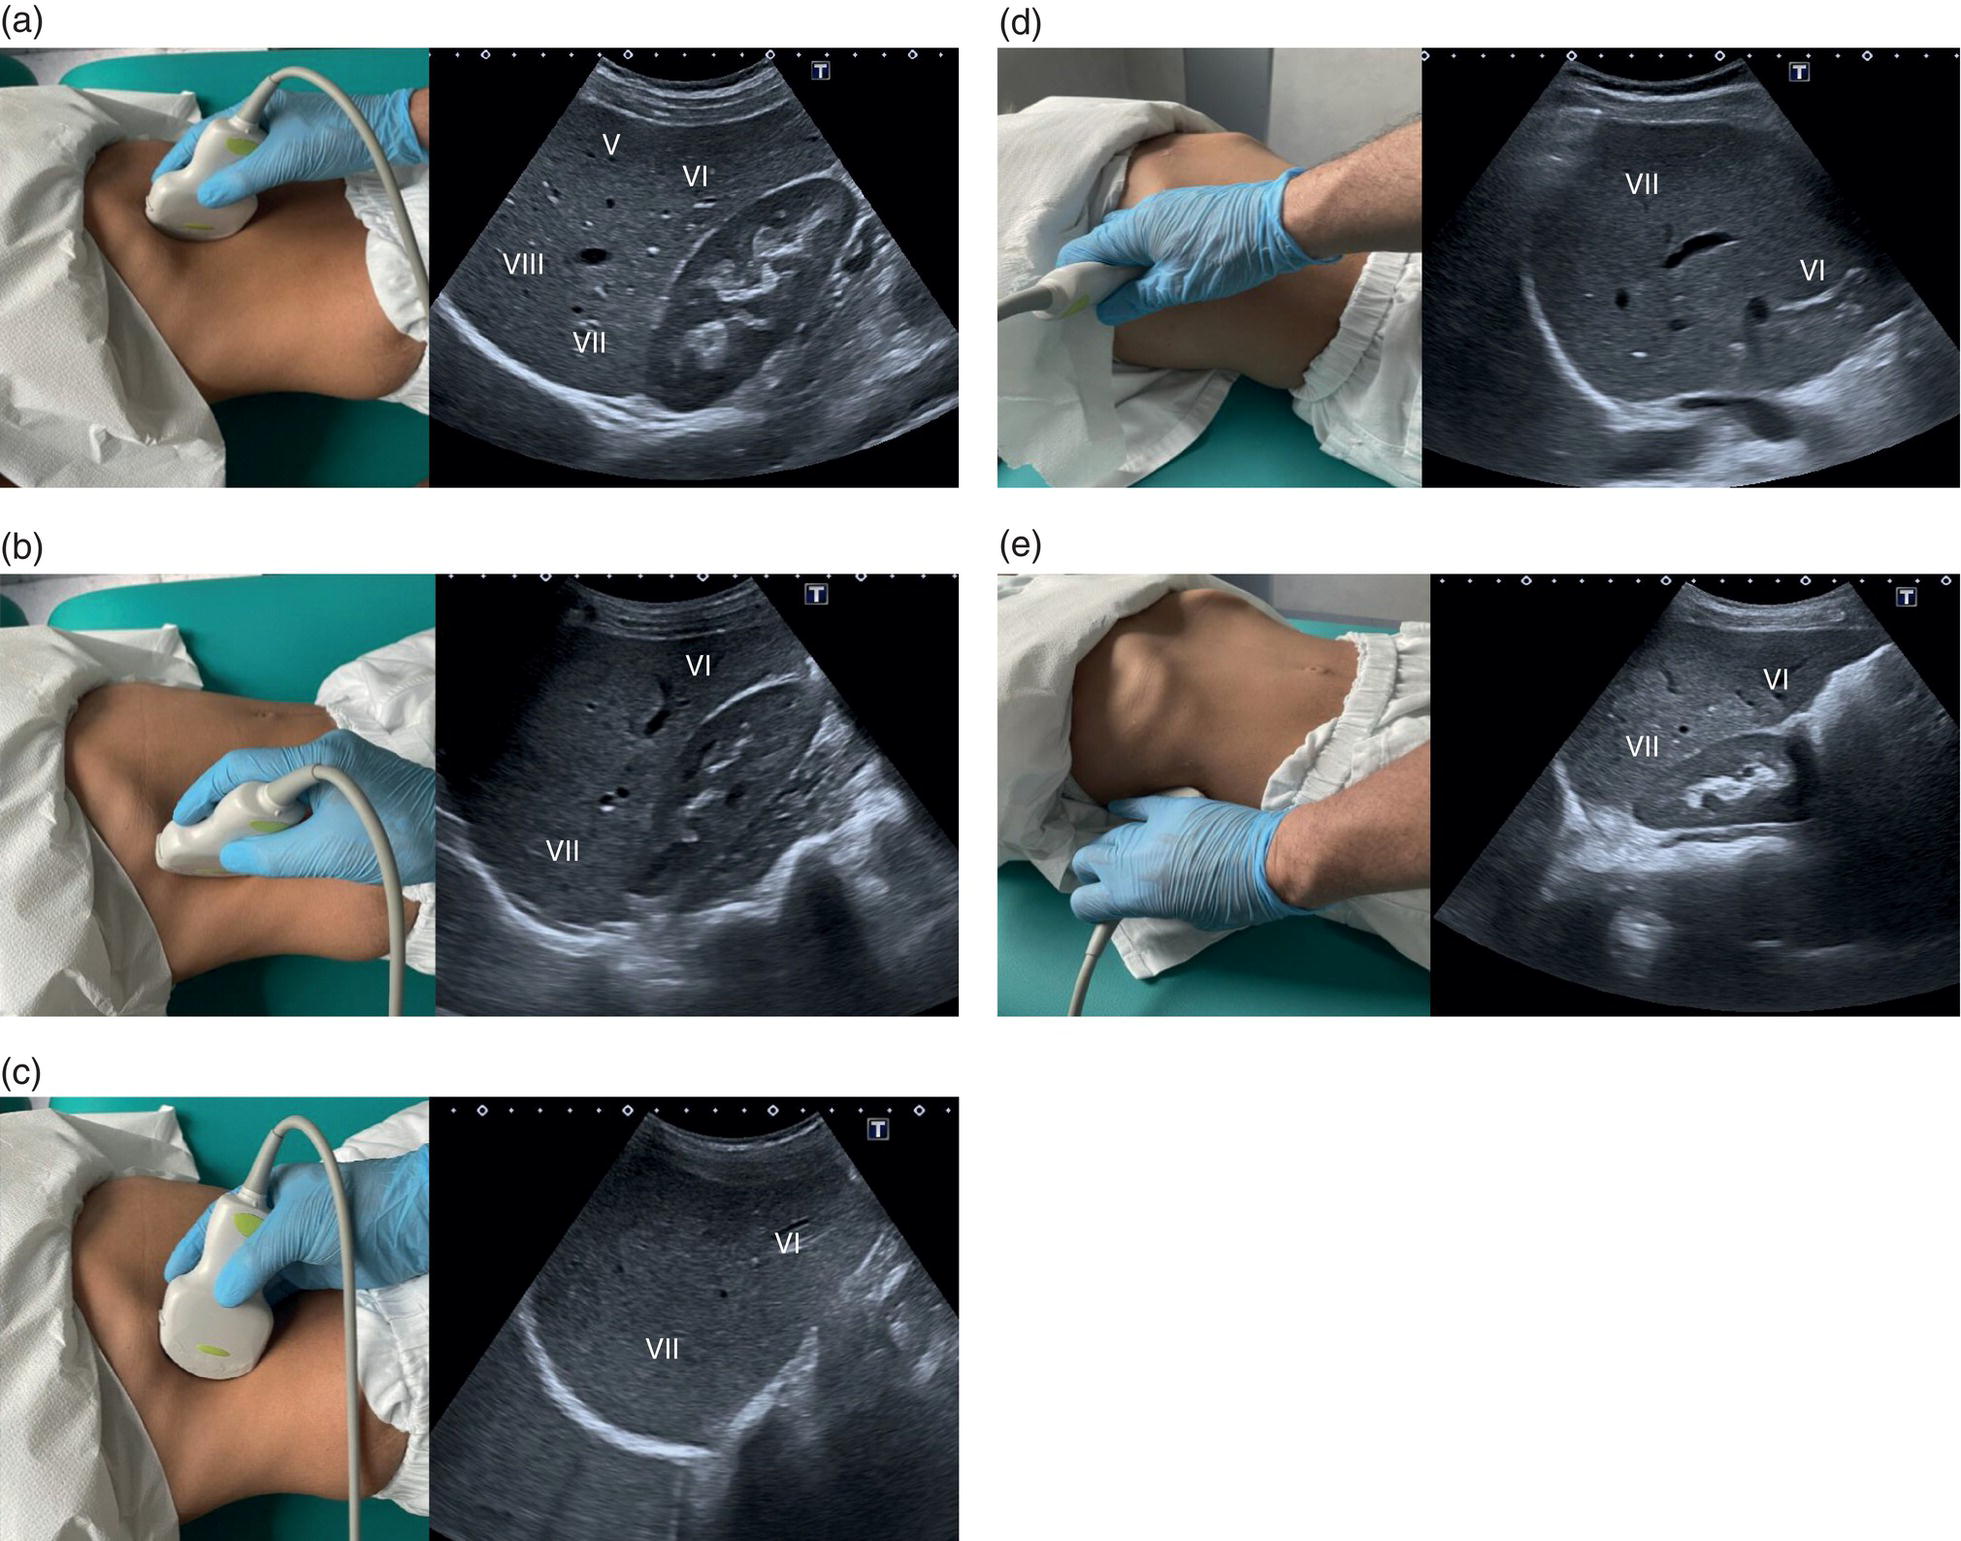
 The right liver lobe includes segments V–VIII, which should be assessed in both the LS and TS planes via a subcostal and intercostal approach, as shown in Figures 3.24–3.26 (Video 3.5). Start again by keeping the probe in the epigastric region in a TS view. By angling upwards, you will visualise the most cranial liver segments (from left to right of the patient will be segment II, IV, VIII) and you will image part of the heart, eventually excluding or highlighting the presence of a pericardial effusion. Then, remaining in the subcostal scanning position, turn the probe oblique (rotating anticlockwise) and slowly angle downwards, making small adjustments as required. By doing so you will visualise the confluence of the three hepatic veins and the IVC from two slightly different angles, with the oblique scan favouring the visualisation of the right hepatic vein (Figure 3.24) (Video 3.5). Maintaining the same probe position and slowly moving downwards, you will visualise first the GB and left branch of the PV and then, eventually turning the patient left side down and making small adjustments, you will visualise the PV crossing and ‘dividing’ the liver in a cranial and caudal region (Figure 3.25) (Videos 3.6 and 3.7). Bear in mind that according to body habitus, when sweeping downwards the PV might appear before the GB or viceversa. Representative images of the right lobe should also be obtained intercostally, moving the probe from one intercostal space to another angling upwards and downwards in order to have a complete view from each angle (Video 3.5). A representative image of the liver with the right kidney is important to allow comparison of its echogenicity to the cortex of the right kidney to diagnose or exclude steatosis. This image can be obtained in the LS plane, starting along the mid‐clavicular line and sweeping outwards (laterally) until the kidney is visualised, or intercostally in case of bowel gas interference (Figure 3.26) (Video 3.8).


Gallbladder and Common Bile Duct
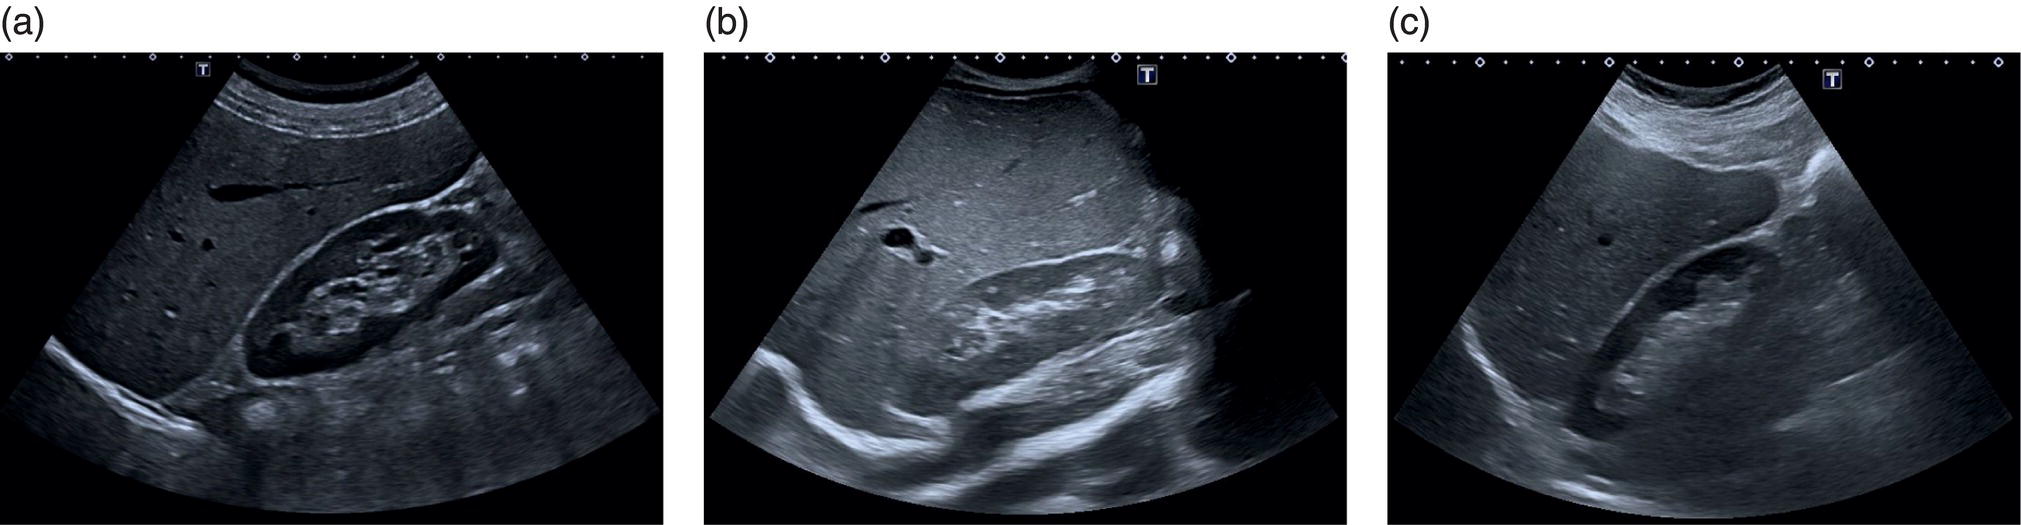
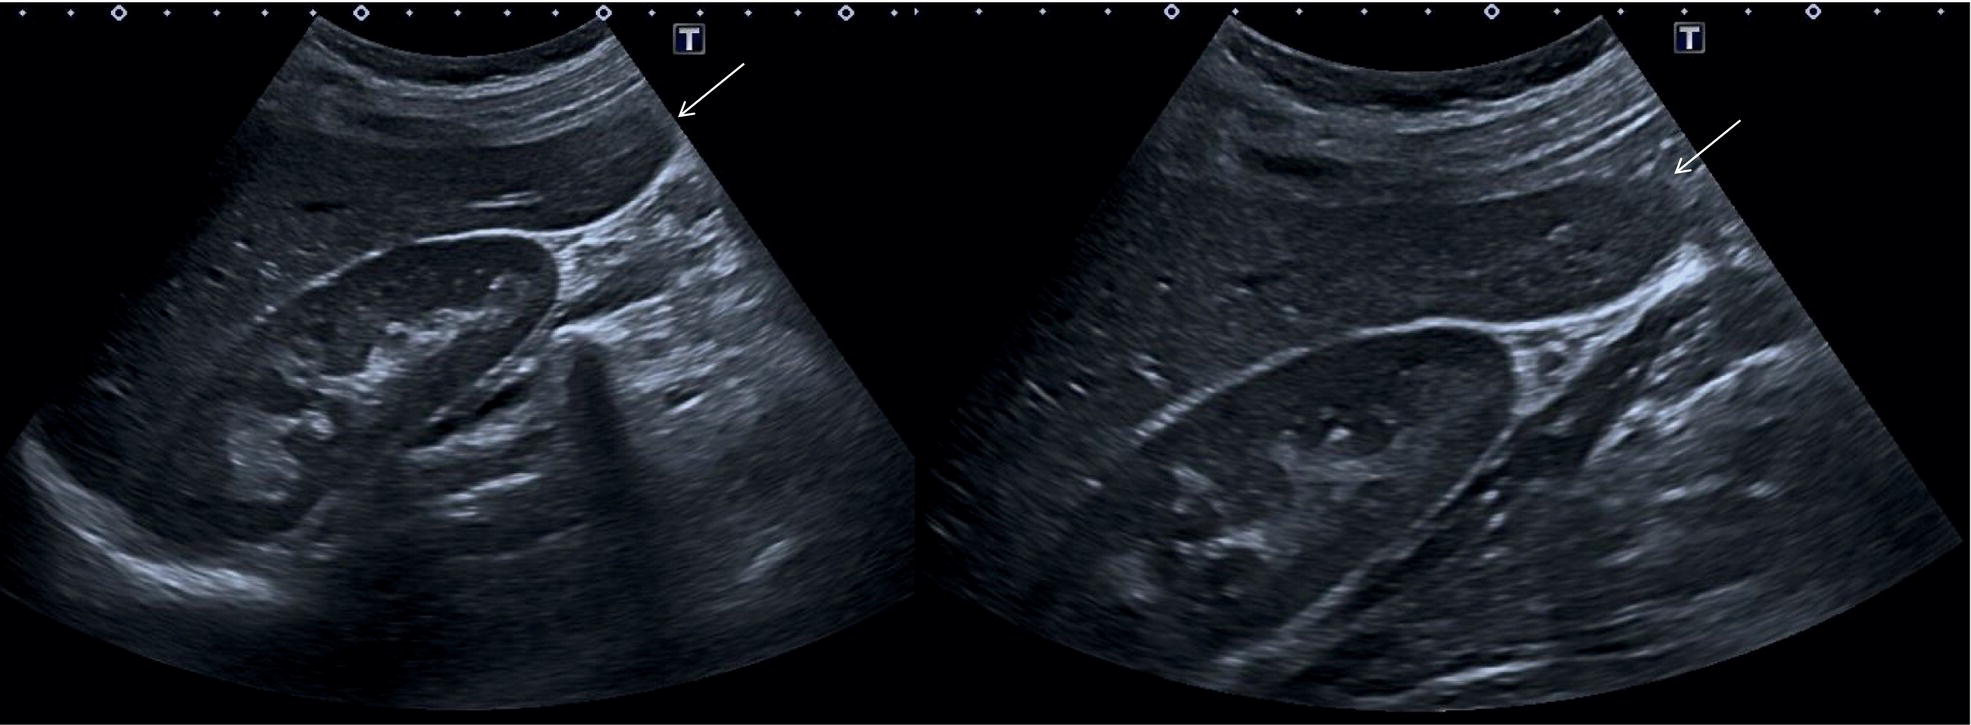
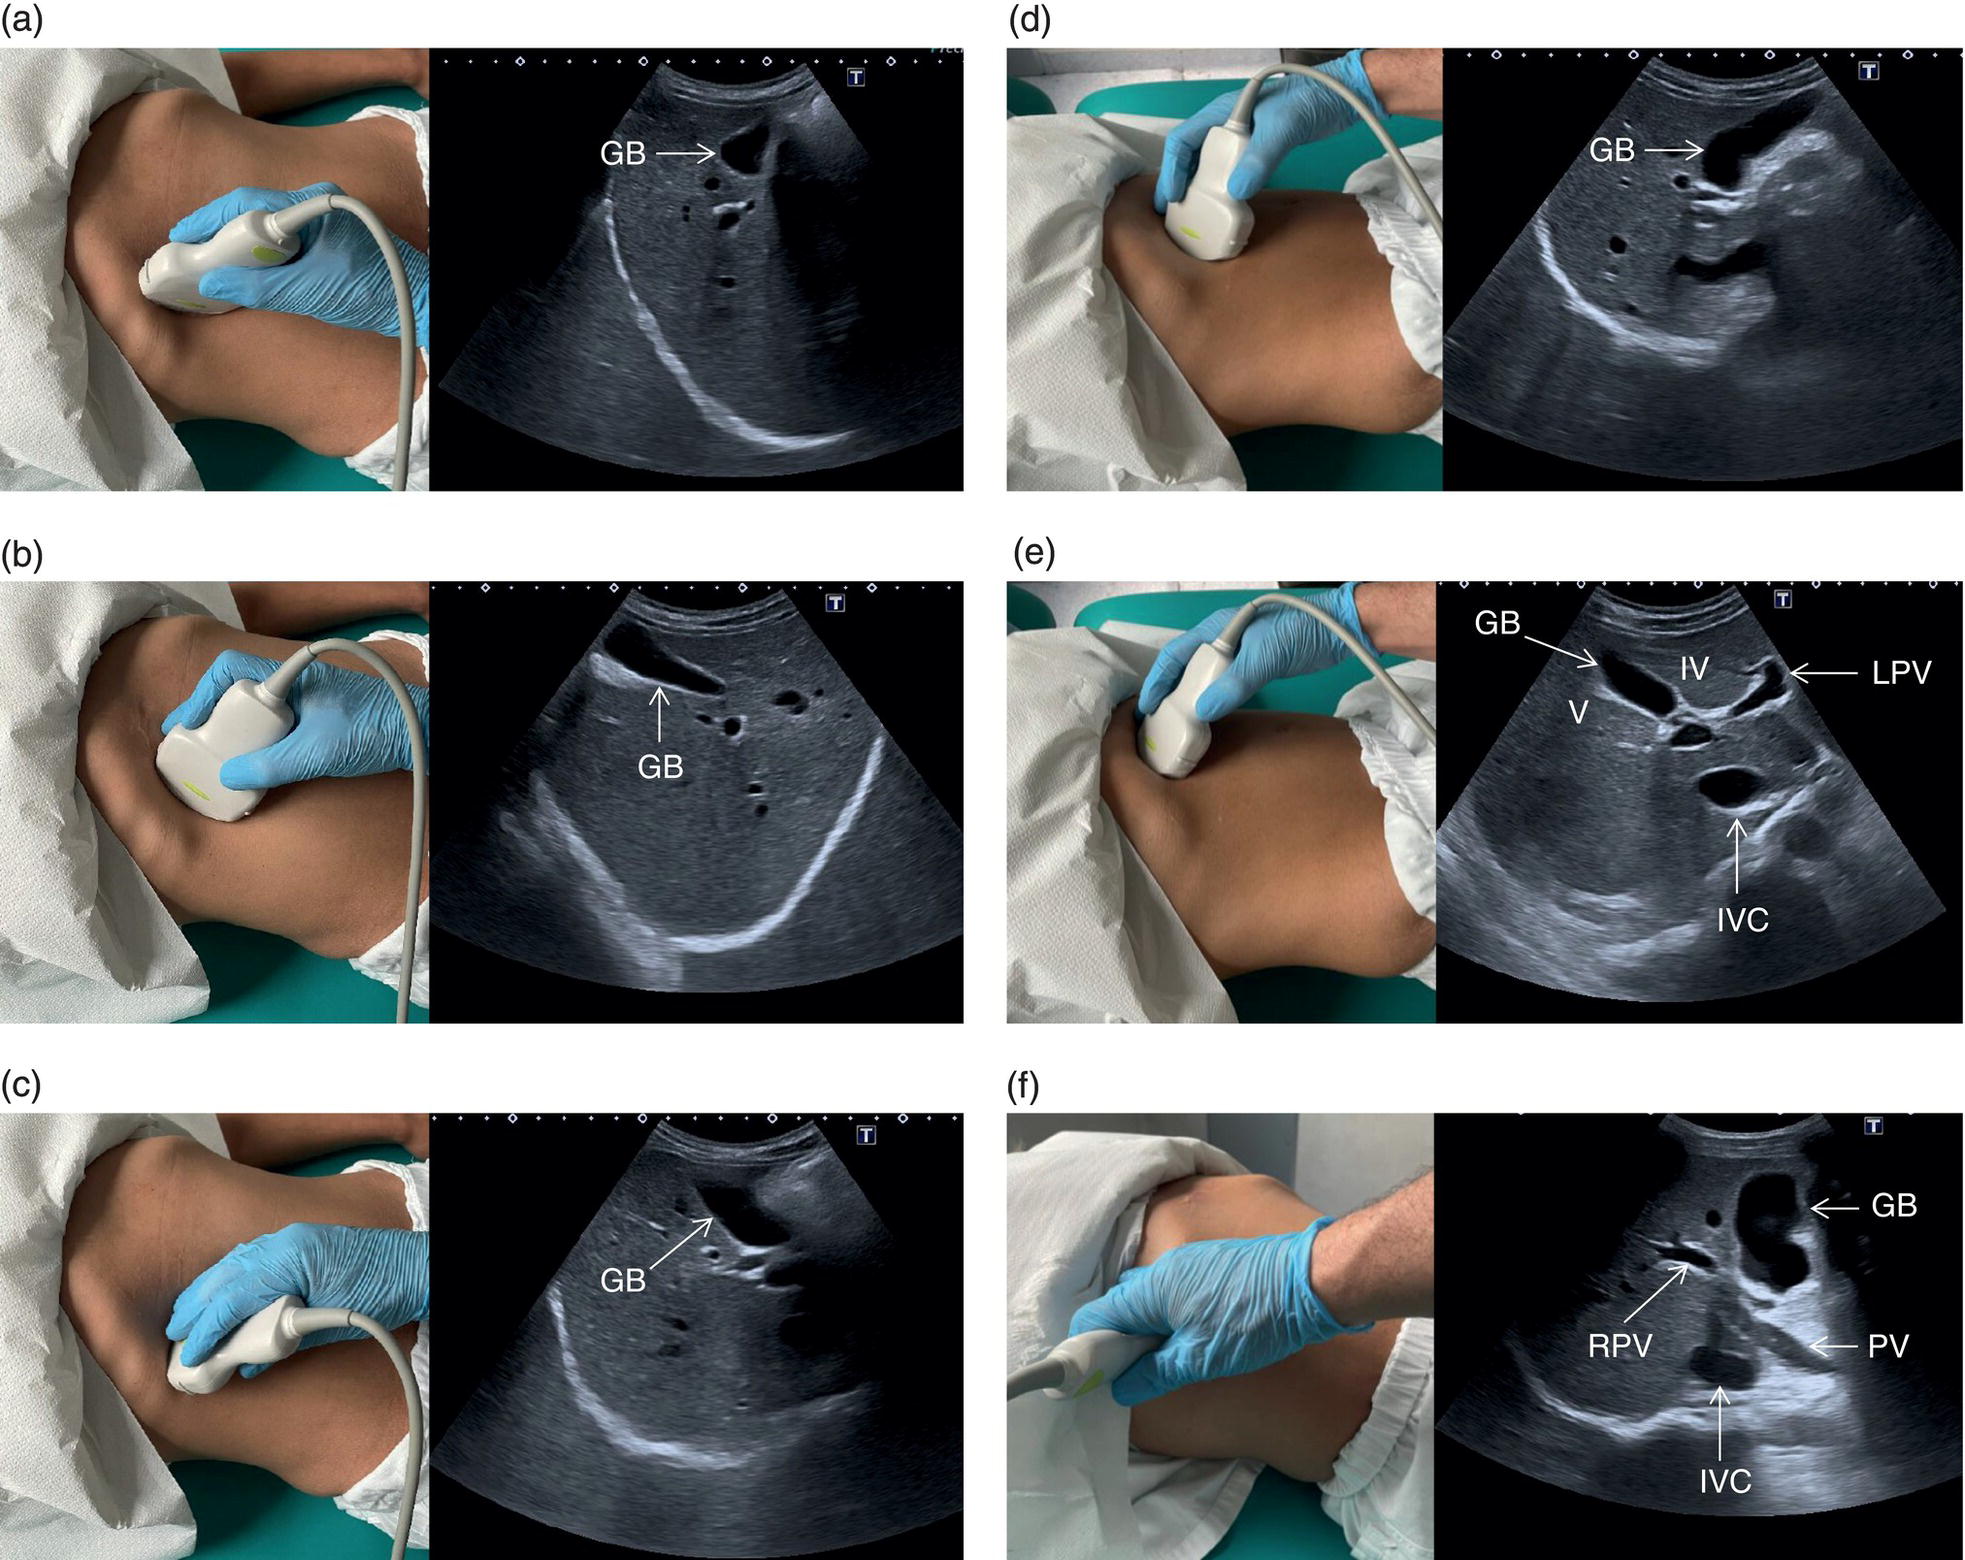
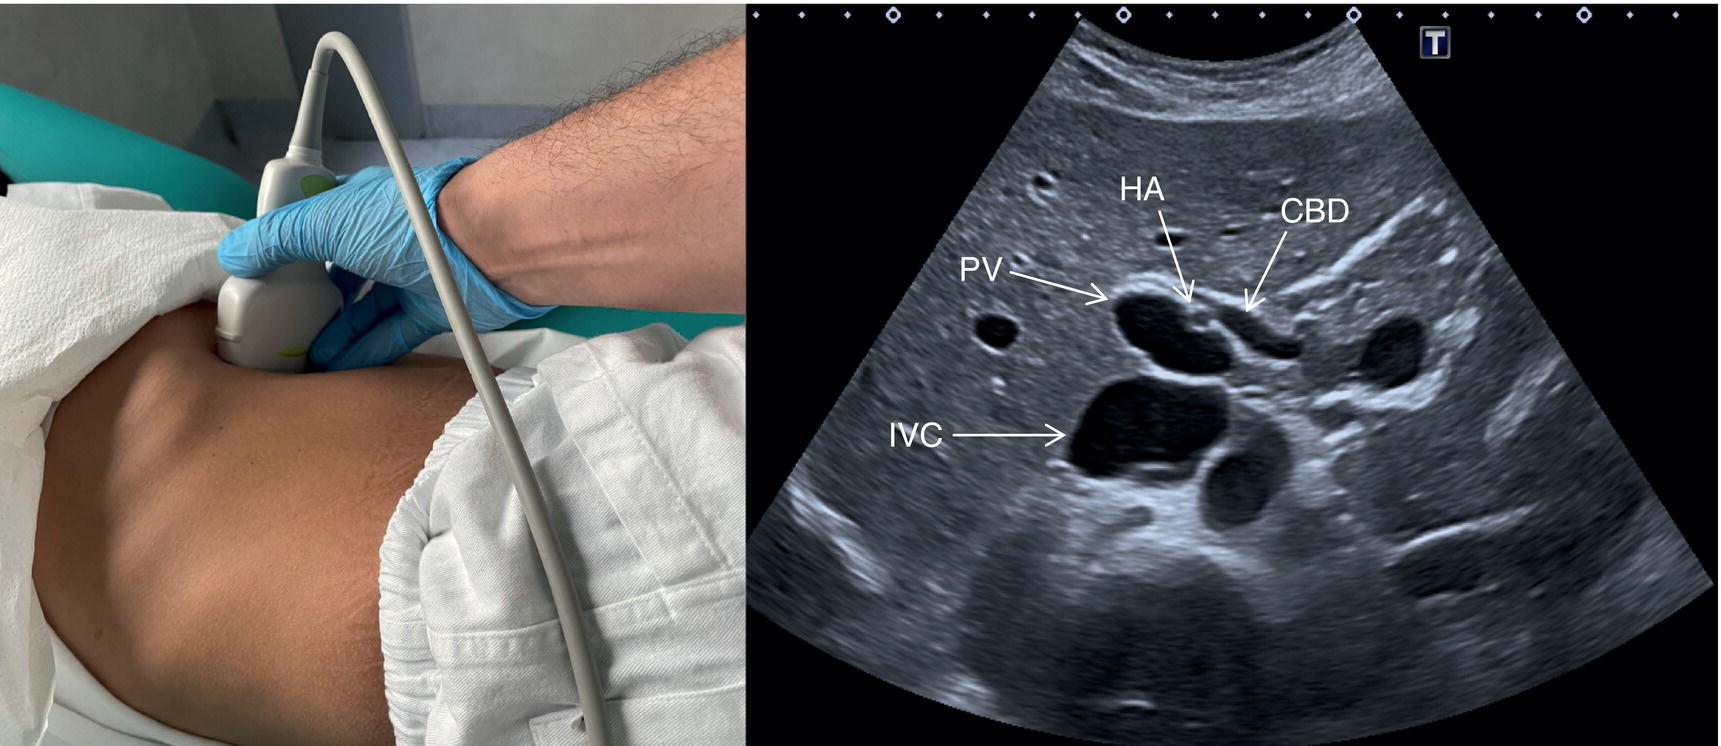
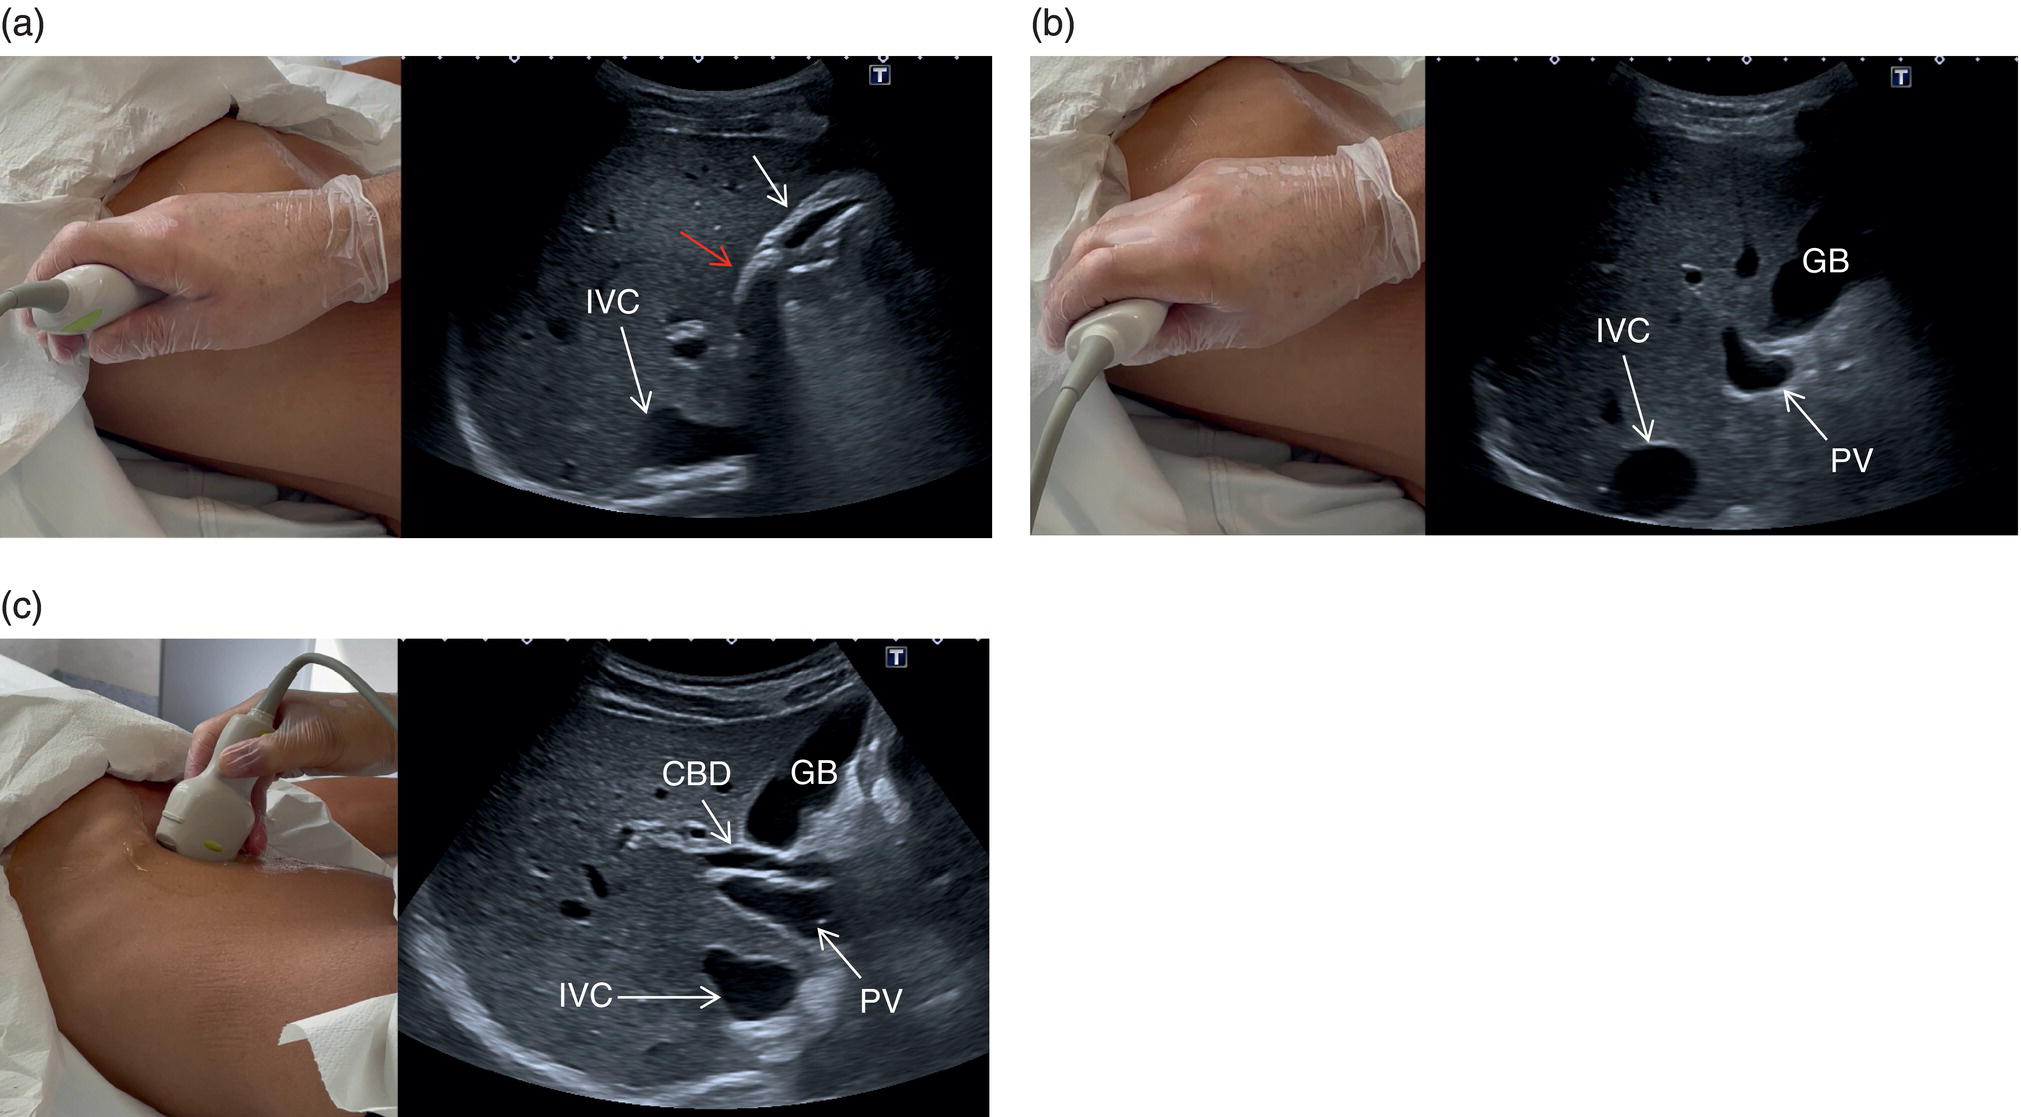
 The GB is assessed in the subcostal position, in two orthogonal planes, and also intercostally. As a first approach, place the transducer on the anterior abdominal wall along the mid‐clavicular line, adjusting its position until the GB is located. Ask the patient to take a deep breath to lower the diaphragm and push the liver downwards below the costal margin; this will facilitate GB visualisation. It is essential to image the GB in its entire long axis and to angle the transducer so that it is also imaged transversally. The longitudinal intercostal approach will complete the GB visualisation, also offering an alternative to a sometimes challenging subcostal view in case of bowel gas interposition (Figure 3.27) (Video 3.9). In other circumstances, especially in the presence of narrow intercostal spaces, an intercostal approach might not be ideal. The CBD is best visualised with the patient supine or slightly turned with the left side down. Start with the probe obliquely positioned in the epigastrium, in line with the anatomical plane of the CBD. Sweep subcostally and outwards until you see the image of the portal triad (Figure 3.28). This may require some fine adjustments of the probe position (Video 3.10). The CBD is usually measured longitudinally where the HA intersects the CBD and PV; nevertheless, if the CBD shows some size variations it should be measured at the level of its maximal calibre (Figure 3.29). As for the GB, there may be occasions, owing to bowel gas, in which the CBD is better visualised in the anterior intercostal plane (Figure 3.30).
Although GB ultrasound assessment can be easily carried out, there are a few important tips and pitfalls that should be kept in mind. Before starting the scan, check if the patient has undergone a cholecystectomy that might be associated with CBD dilatation, or endoscopic retrograde cholangiopancreatography requiring Oddi’s sphincterotomy that usually leads to aerobilia. Both these findings after these procedures should be considered paraphysiological, unless the clinical picture and laboratory results suggest that an underlying pathological obstructive/infective process is also present.
If the GB cannot be visualised, consider an ectopic position and check lower down within the pelvis. Always be sure that the patient has truly fasted for at least six hours, since a contracted GB can mimic cholecystitis and in general does not allow correct evaluation of its wall thickness and content, thus carrying a risk of missed pathology. Some congenital variants can make its visualisation or assessment difficult (see Chapter 6). It is important to keep in mind that the main interlobar fissure is a useful landmark to identify the GB fossa. Follow the fissure from the right branch of the PV to its other extremity that ends with the GB fossa (Figure 3.7) [6]. This will help to locate and identify the GB, especially when it is small or contracted. Be aware of the presence of near‐field artefact, which may obscure the anterior wall of the GB; the proximity of the duodenum may bulge against the posterior wall, mimicking pathology or limiting its correct assessment. Changing the patient’s position may also help to move the duodenum’s position and content and improve GB visualisation (Figure 3.31). Partial volume artefact can mimic the presence of sludge that accumulates in the infundibulum or a ‘side‐lobe artefact’ with posterior acoustic shadowing can give a false image of a stone lying in the neck of the GB. As previously mentioned, changing angle and plane of insonation will clarify the actual presence or absence of underlying pathology and confirm if the sonographic findings are artefactual.
Portal Vein, Hepatic Artery, and Hepatic Veins
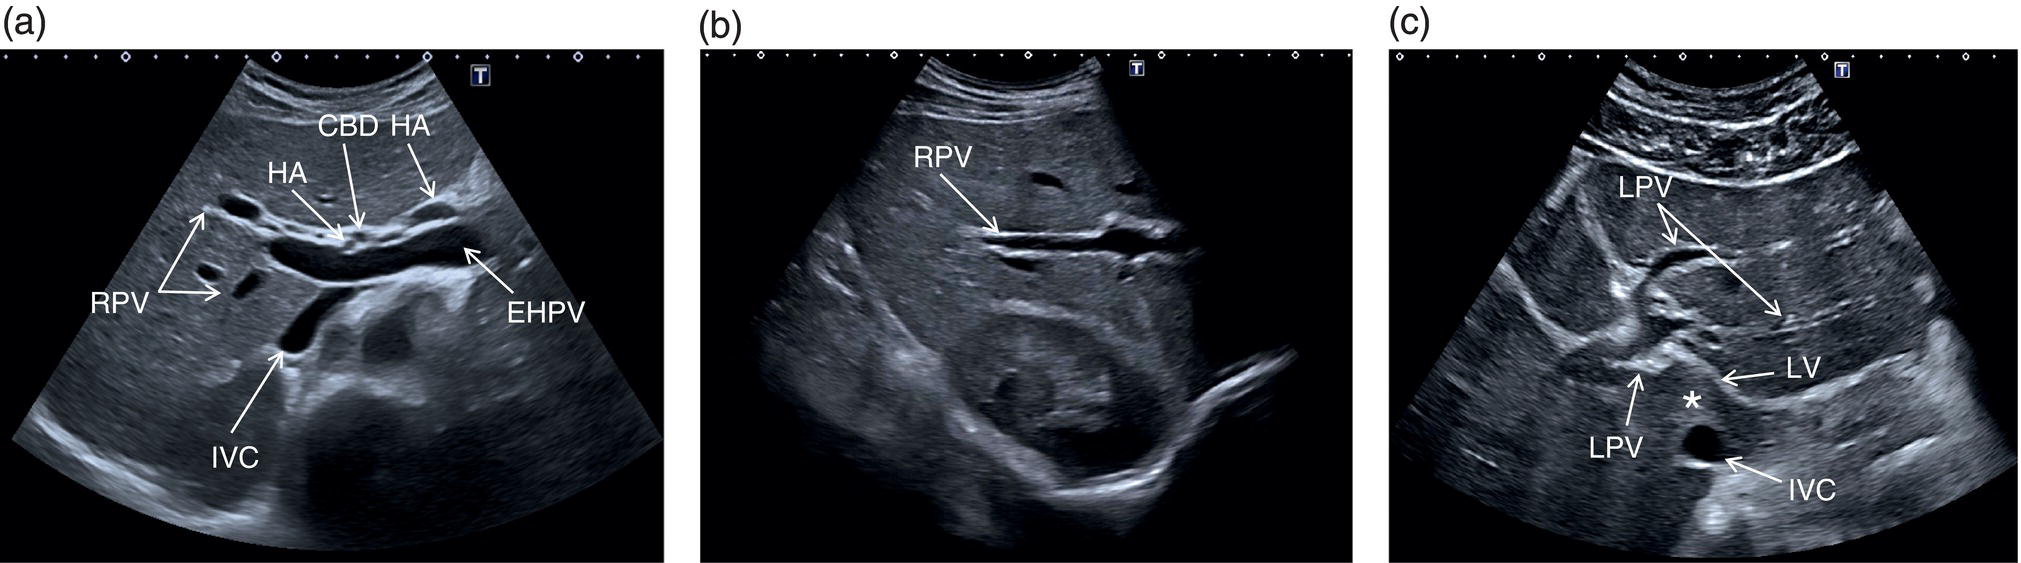
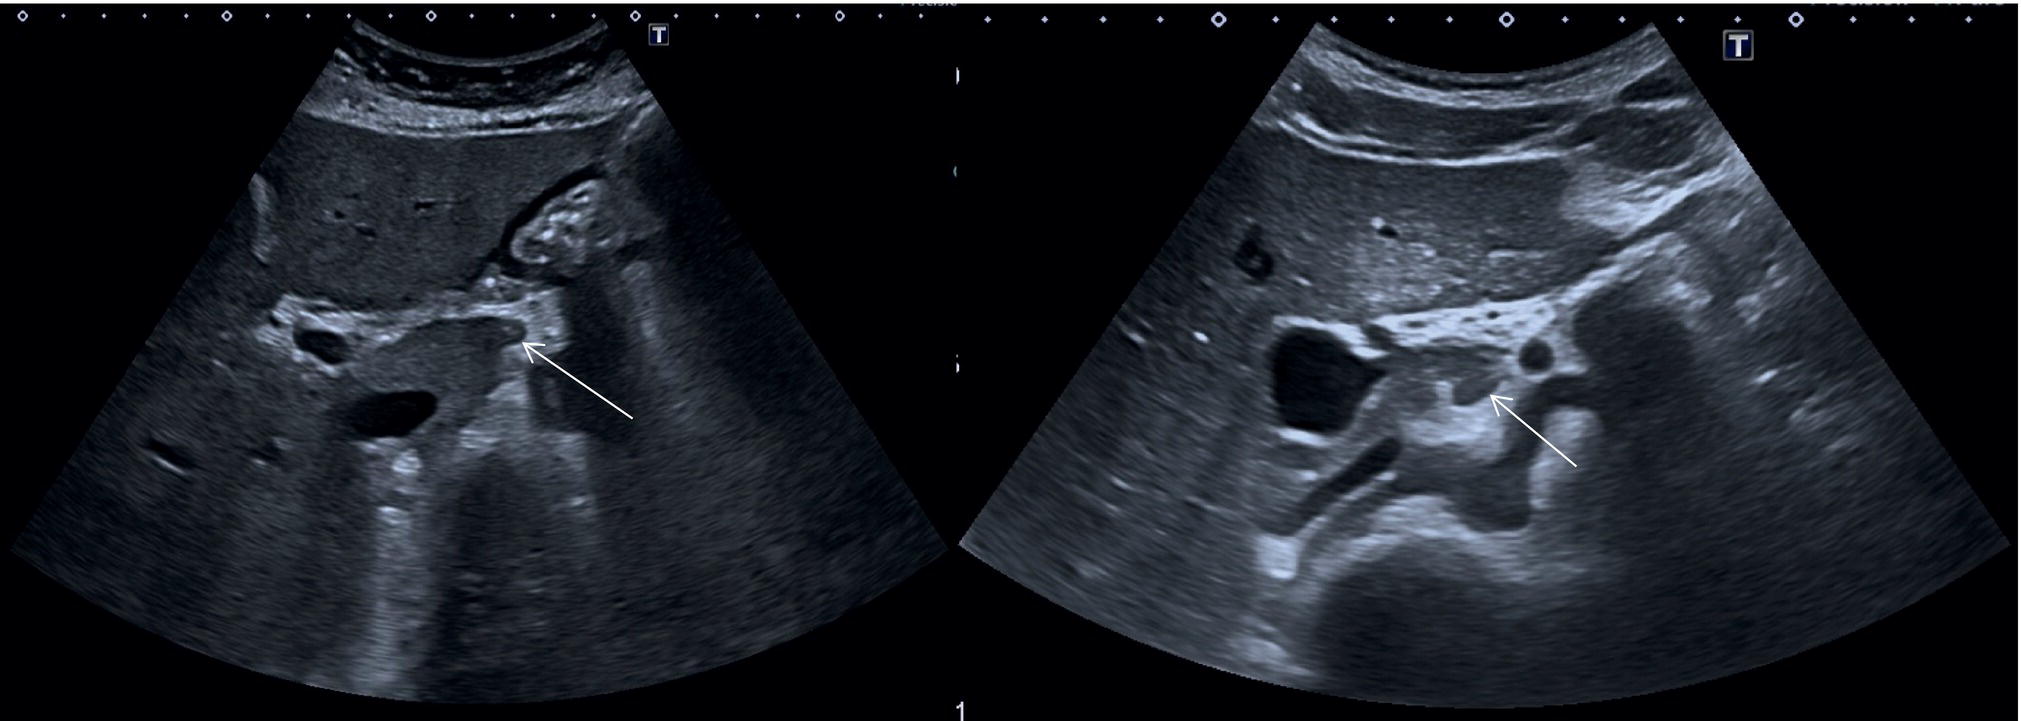
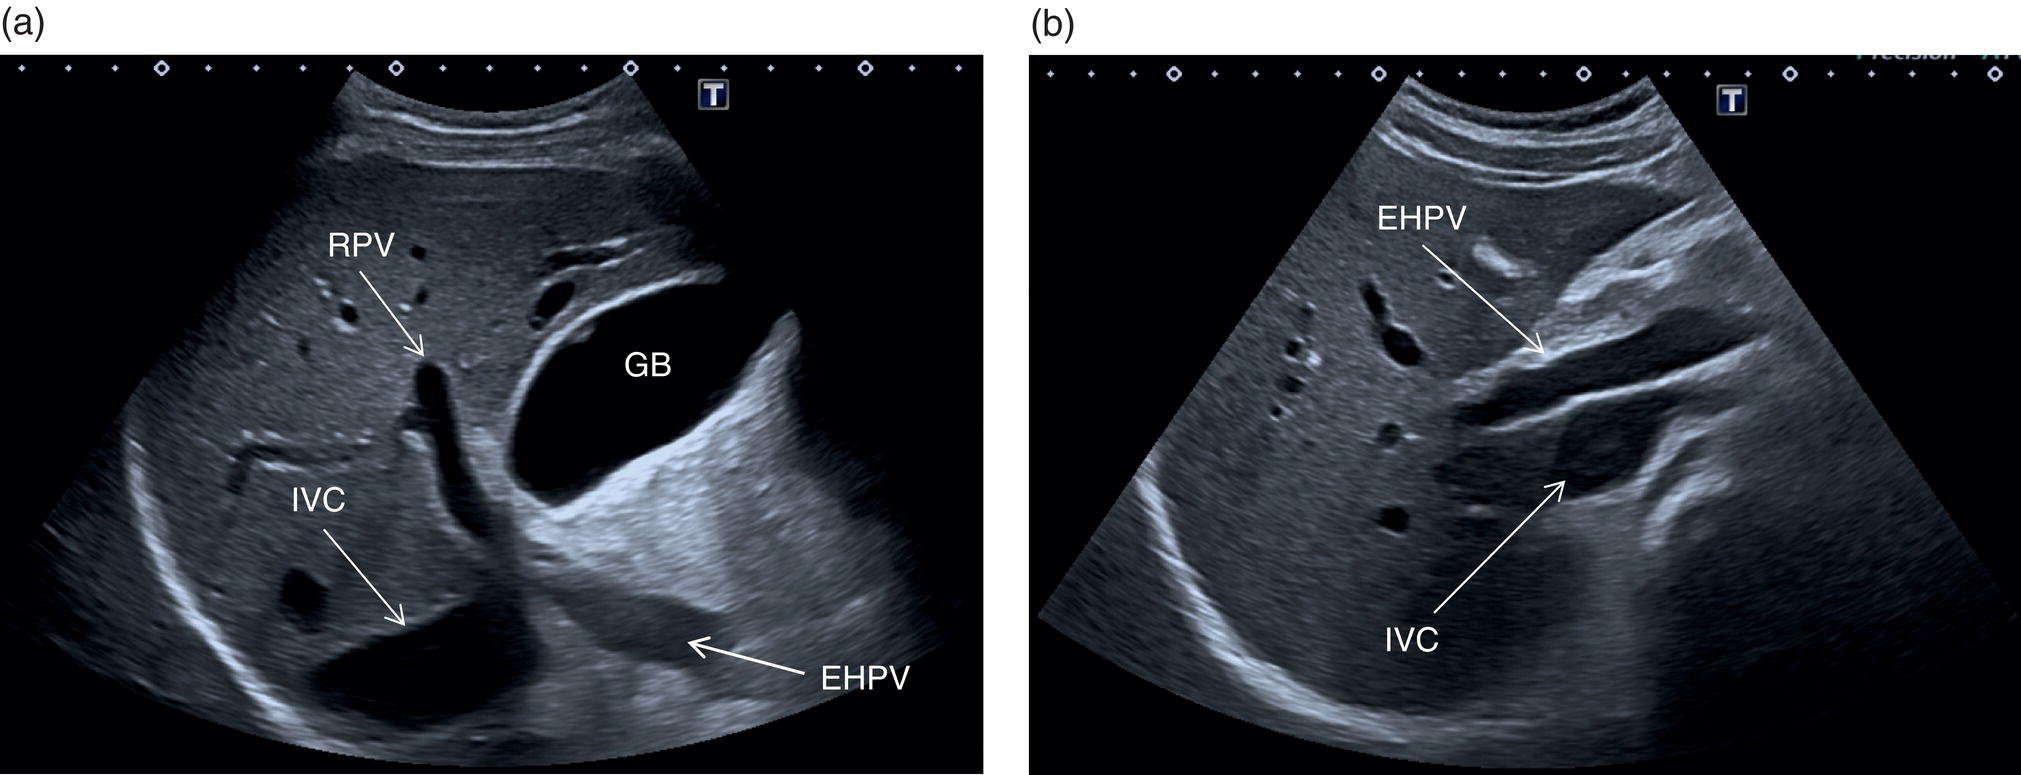
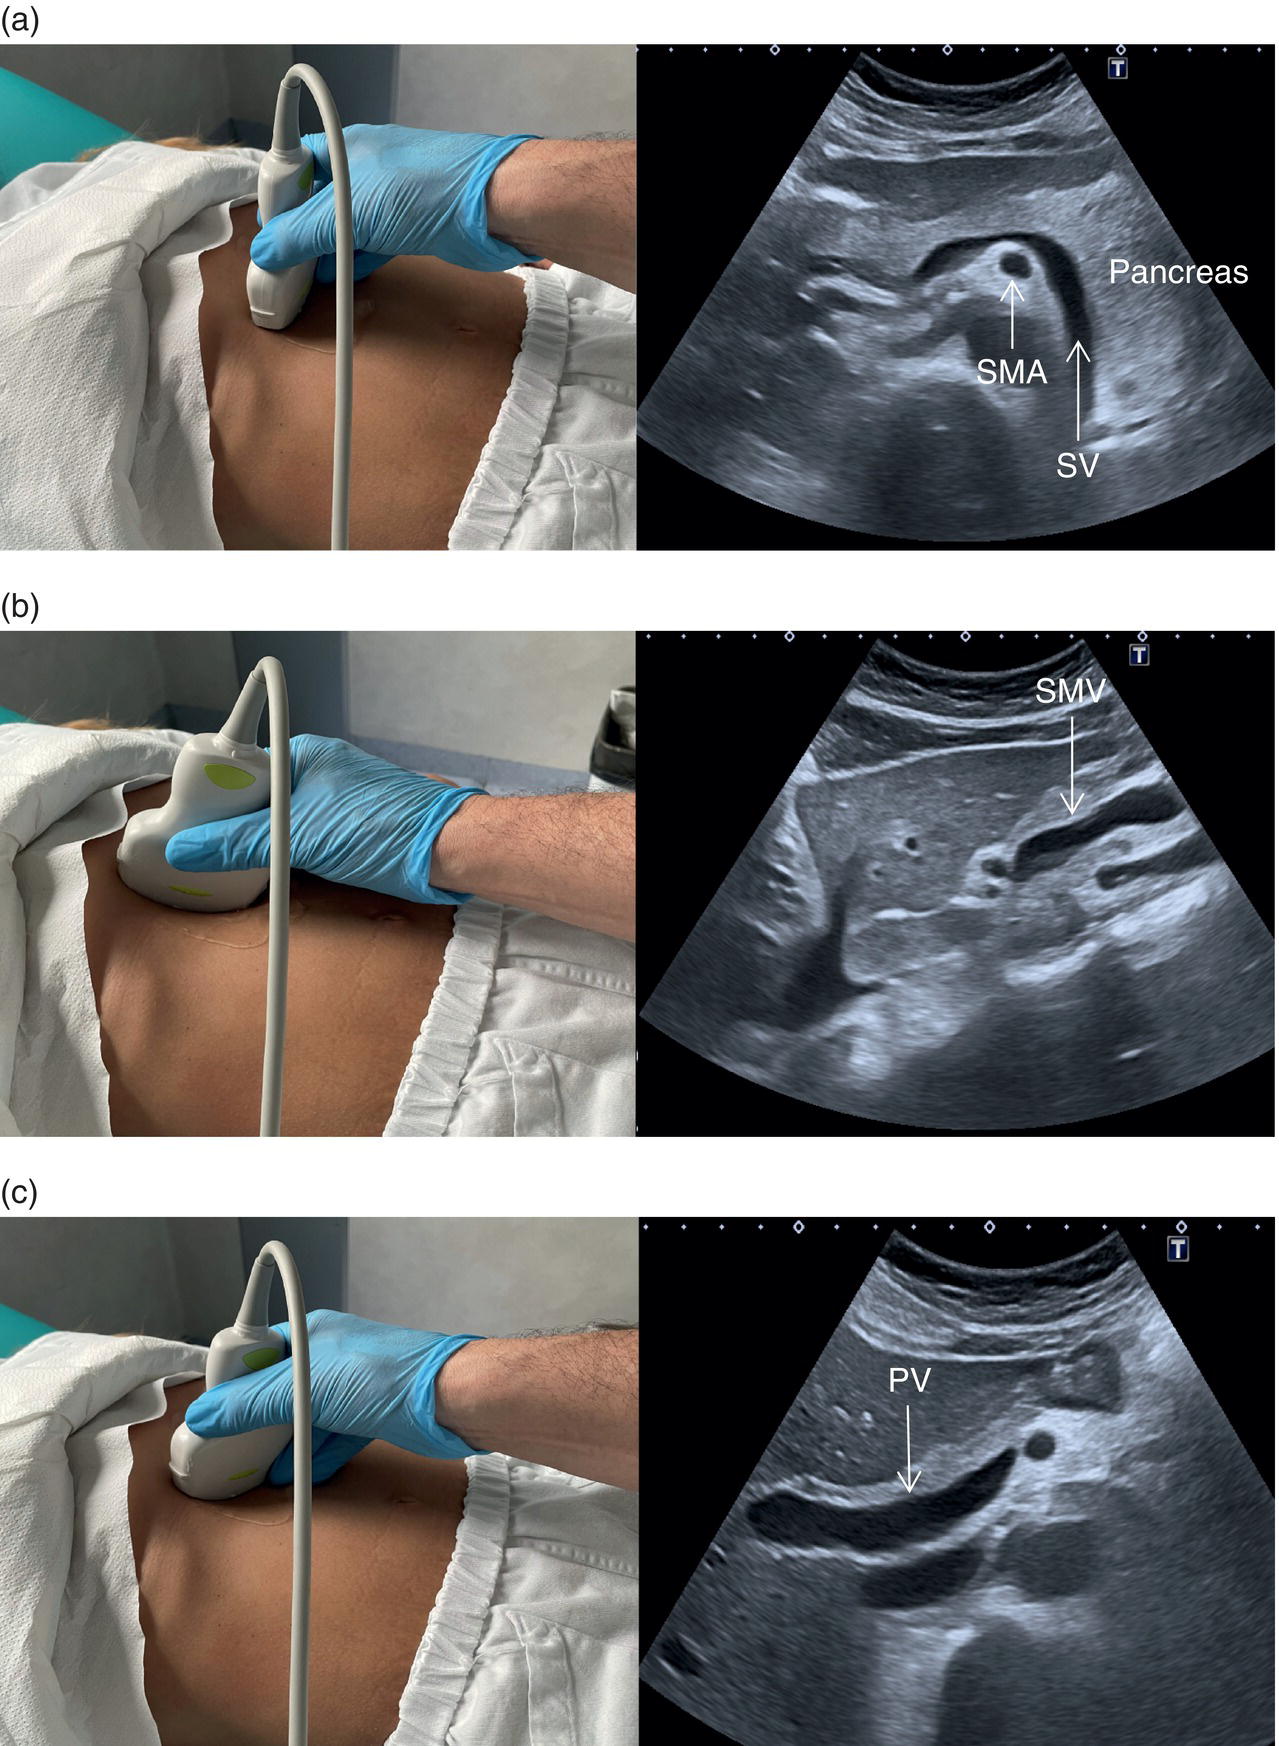
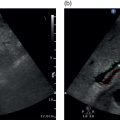
The PV is best assessed in the intercostal position, typically when scanning through the right liver segments. When scanning intercostally be sure to visualise the hepatic hilum and the main PV (the main trunk will appear as the more posterior structure) (Figure 3.32a). Alternatively the main PV can be visualised maintaining a subcostal oblique approach (Figure 3.32b). In order to visualise the origin of the main extrahepatic PV, start by searching the splenic vein with a transverse subcostal epigastric view. The splenic vein will be seen lying below the pancreas and above the superior mesenteric artery in its transverse section (Figure 3.33a). Once the splenic vein is visualised, slowly turn the probe clockwise approximately 90° in order to visualise the superior mesenteric vein (Figure 3.33b). Next turn the probe anticlockwise by 45°, maintaining an oblique subcostal position. By doing so the confluence of the splenic vein and superior mesenteric vein will be seen forming the extrahepatic PV entering the liver (Figure 3.33c) (Video 3.11). It is important to remember that there may be subjective variability in the visualisation of hepatic structures, especially of the vessels, according to the angle of insonation. Therefore, it is advised to follow the mentioned landmarks moving slowly, since small movements of the probe can lead to considerable changes in ultrasound imaging. 
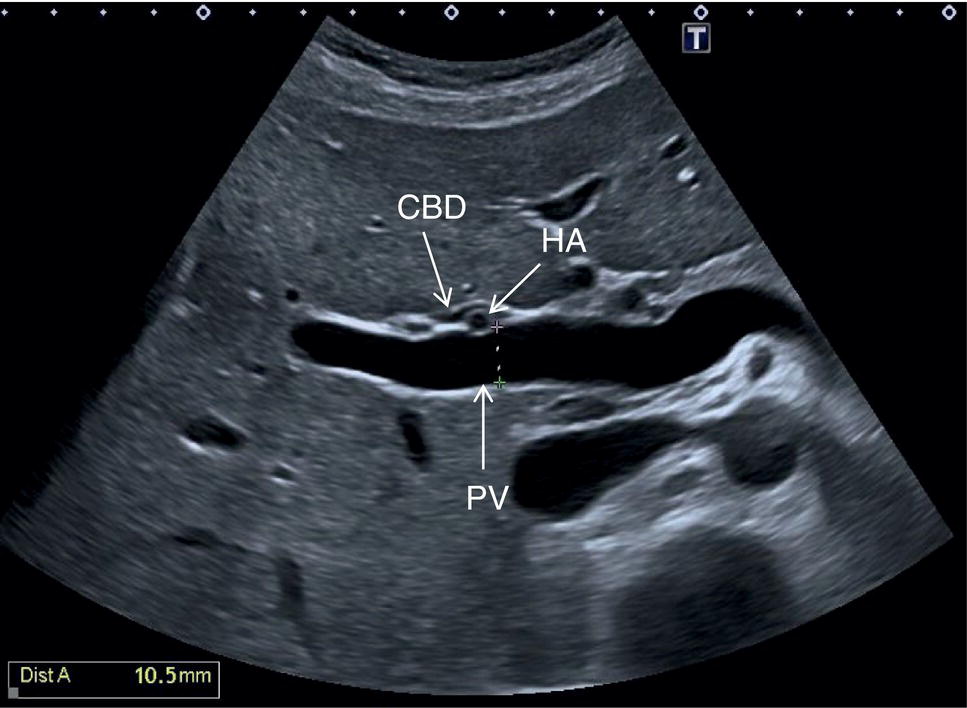
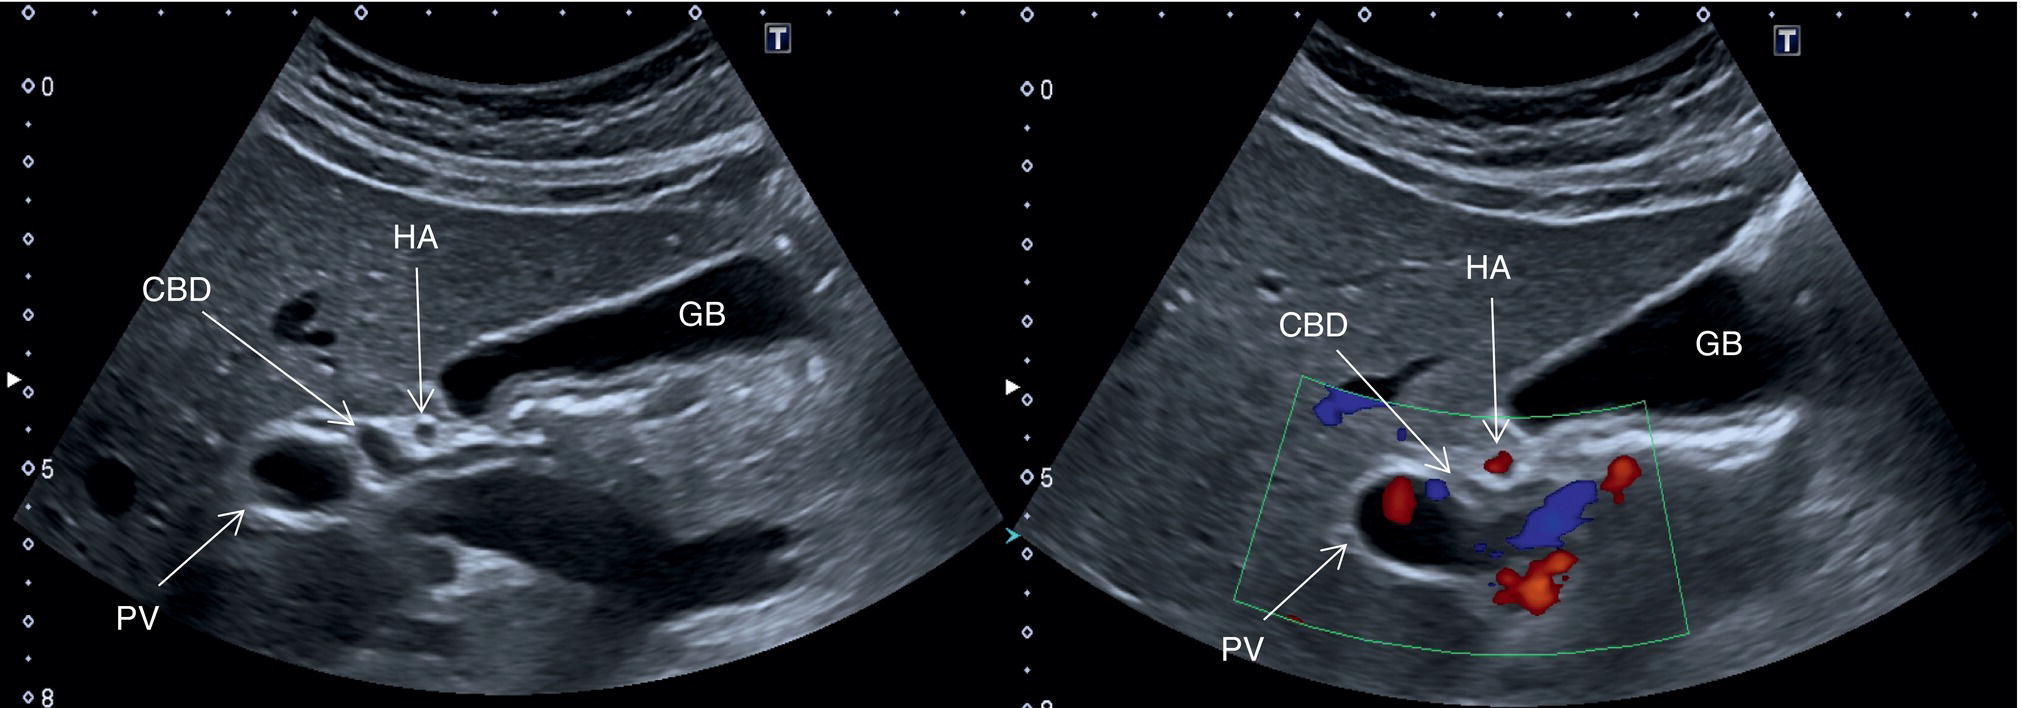
The PV calibre is measured at the hepatic hilum at the crossing with the HA, where a diameter up to 12.5–13 mm is considered normal (Figure 3.34).
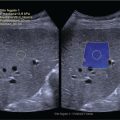
The HA has echogenic walls, it runs anteriorly to the PV and posteriorly to the CBD, and its normal calibre at the hepatic hilum measures up to 3 mm in diameter (Figure 3.34). The hepatic veins have thinner and less echogenic walls [8] and have a straighter and linear course compared to the portal venous system. Although the measurement of the hepatic veins is usually not performed on a routine basis, the cut‐off value of their calibre is approximately 8 mm, measured at about 2–3 cm from their confluence into the IVC [9]. It should be kept in mind that in lean subjects both IVC and hepatic veins may be more ectatic. When performing a liver ultrasound scan it is important to keep in mind that the echogenicity of both hepatic veins and PV walls changes according to the angle between the ultrasound beam and the vascular wall. The more acute is the angle of insonation, the closer it is to being parallel to the longitudinal axis of the vessel. Therefore, despite there being clear differences between the thick perivascular collagen of the portal venous system and the thin walls of the hepatic veins (Figure 3.35), if the angle of insonation is low between the ultrasound beam and the PV walls, these could appear very thin or even not be visible. On the other hand, if the angle of insonation with the hepatic veins is close to 90°, the walls will appear thick and echogenic. It is always important to keep in mind this physical principle, remembering the anatomical landmarks and tracing the vessels to their origin: the PV to the hepatic hilum and the hepatic veins to their confluence into the IVC.
The following is a liver assessment check‐list with probe position for segment visualisation:
- Segments I–III and segment IVA/IVB: Longitudinal and transverse subcostal epigastric view.
- Confluence Segments IVA and IVB and confluence of hepatic veins: mainly transverse subcostal epigastric view but also longitudinal subcostal view to focus on the left hepatic vein draining into the IVC.
- Segments V and VI right subcostal transverse view and right intercostal longitudinal view.
- Segment VII and VIII: epigastric/right subcostal view and right intercostal longitudinal view.
- GB and CBD measurement at porta hepatis: right intercostal longitudinal view or transverse epigastric and transverse/oblique right subcostal view.
Doppler Studies of the Liver
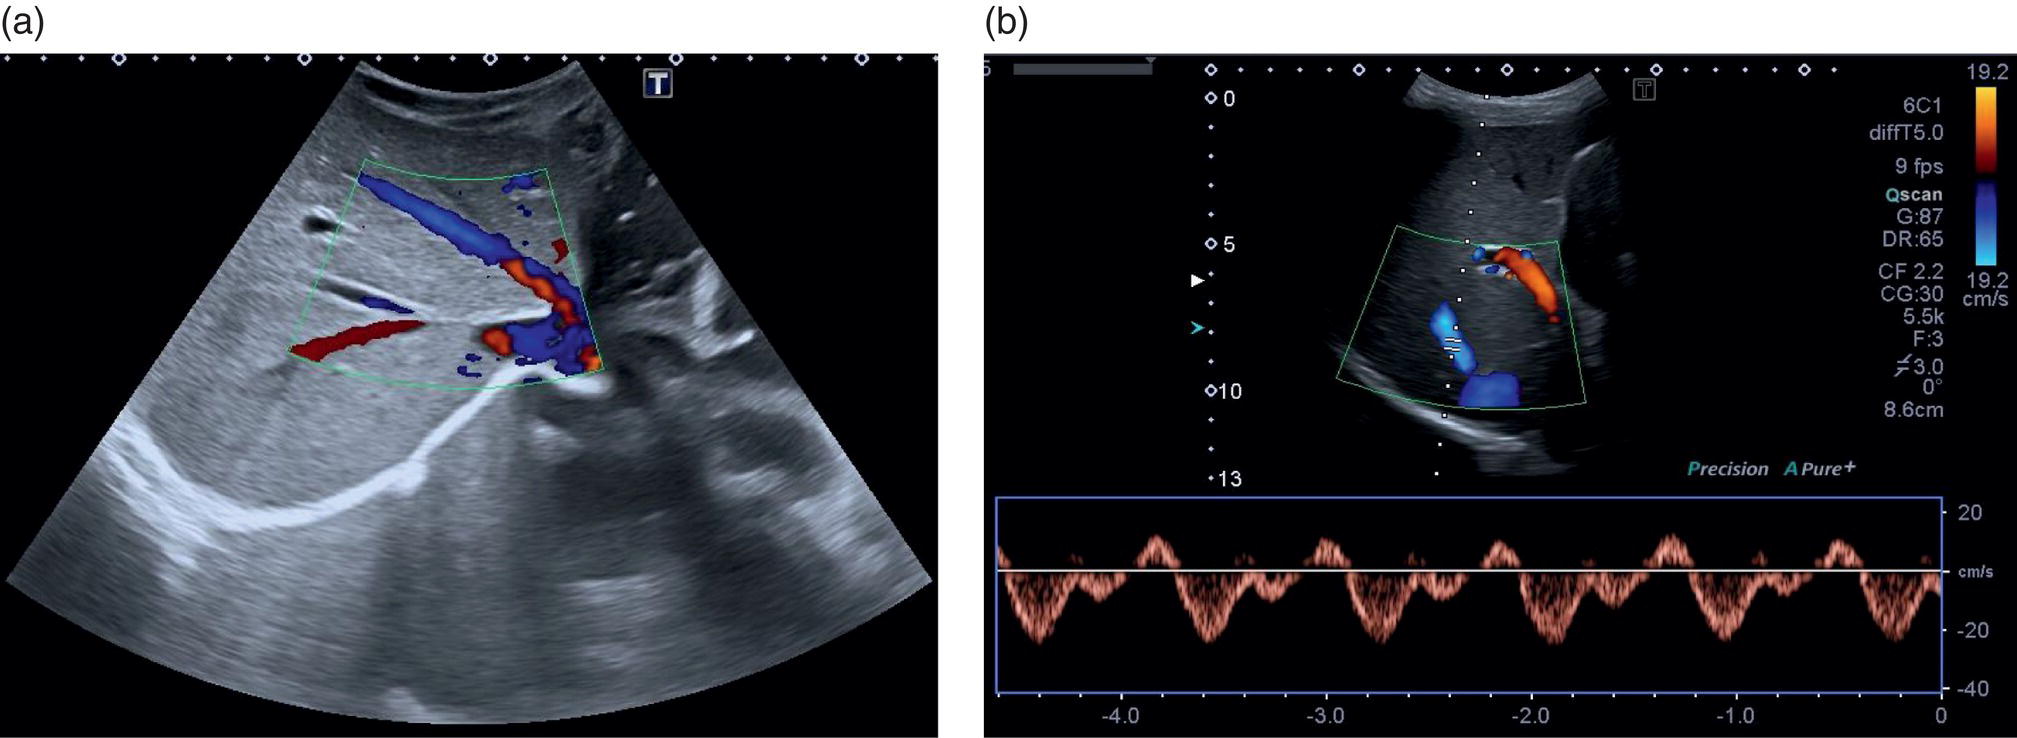
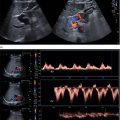
A more in‐depth assessment of the PV may be needed, and this is usually traced from the confluence of the superior mesenteric vein and splenic vein forming the main PV, as previously described. This should then be traced to its intrahepatic division into the main right and left lobes of the liver (Video 3.6). These vessels should be assessed with greyscale, colour, and spectral Doppler flow (see Chapter 1). Portal venous flow is usually monophasic or mildly phasic and hepatopetal in direction (Figure 3.36). Portal flow velocity may be influenced by obstruction and increased intrahepatic resistance, particularly in the presence of PV thrombosis and cirrhosis or severe heart failure/increased central venous pressure. In the latter case, the portal venous flow is typically pulsatile (see Chapters 8 and 12). 
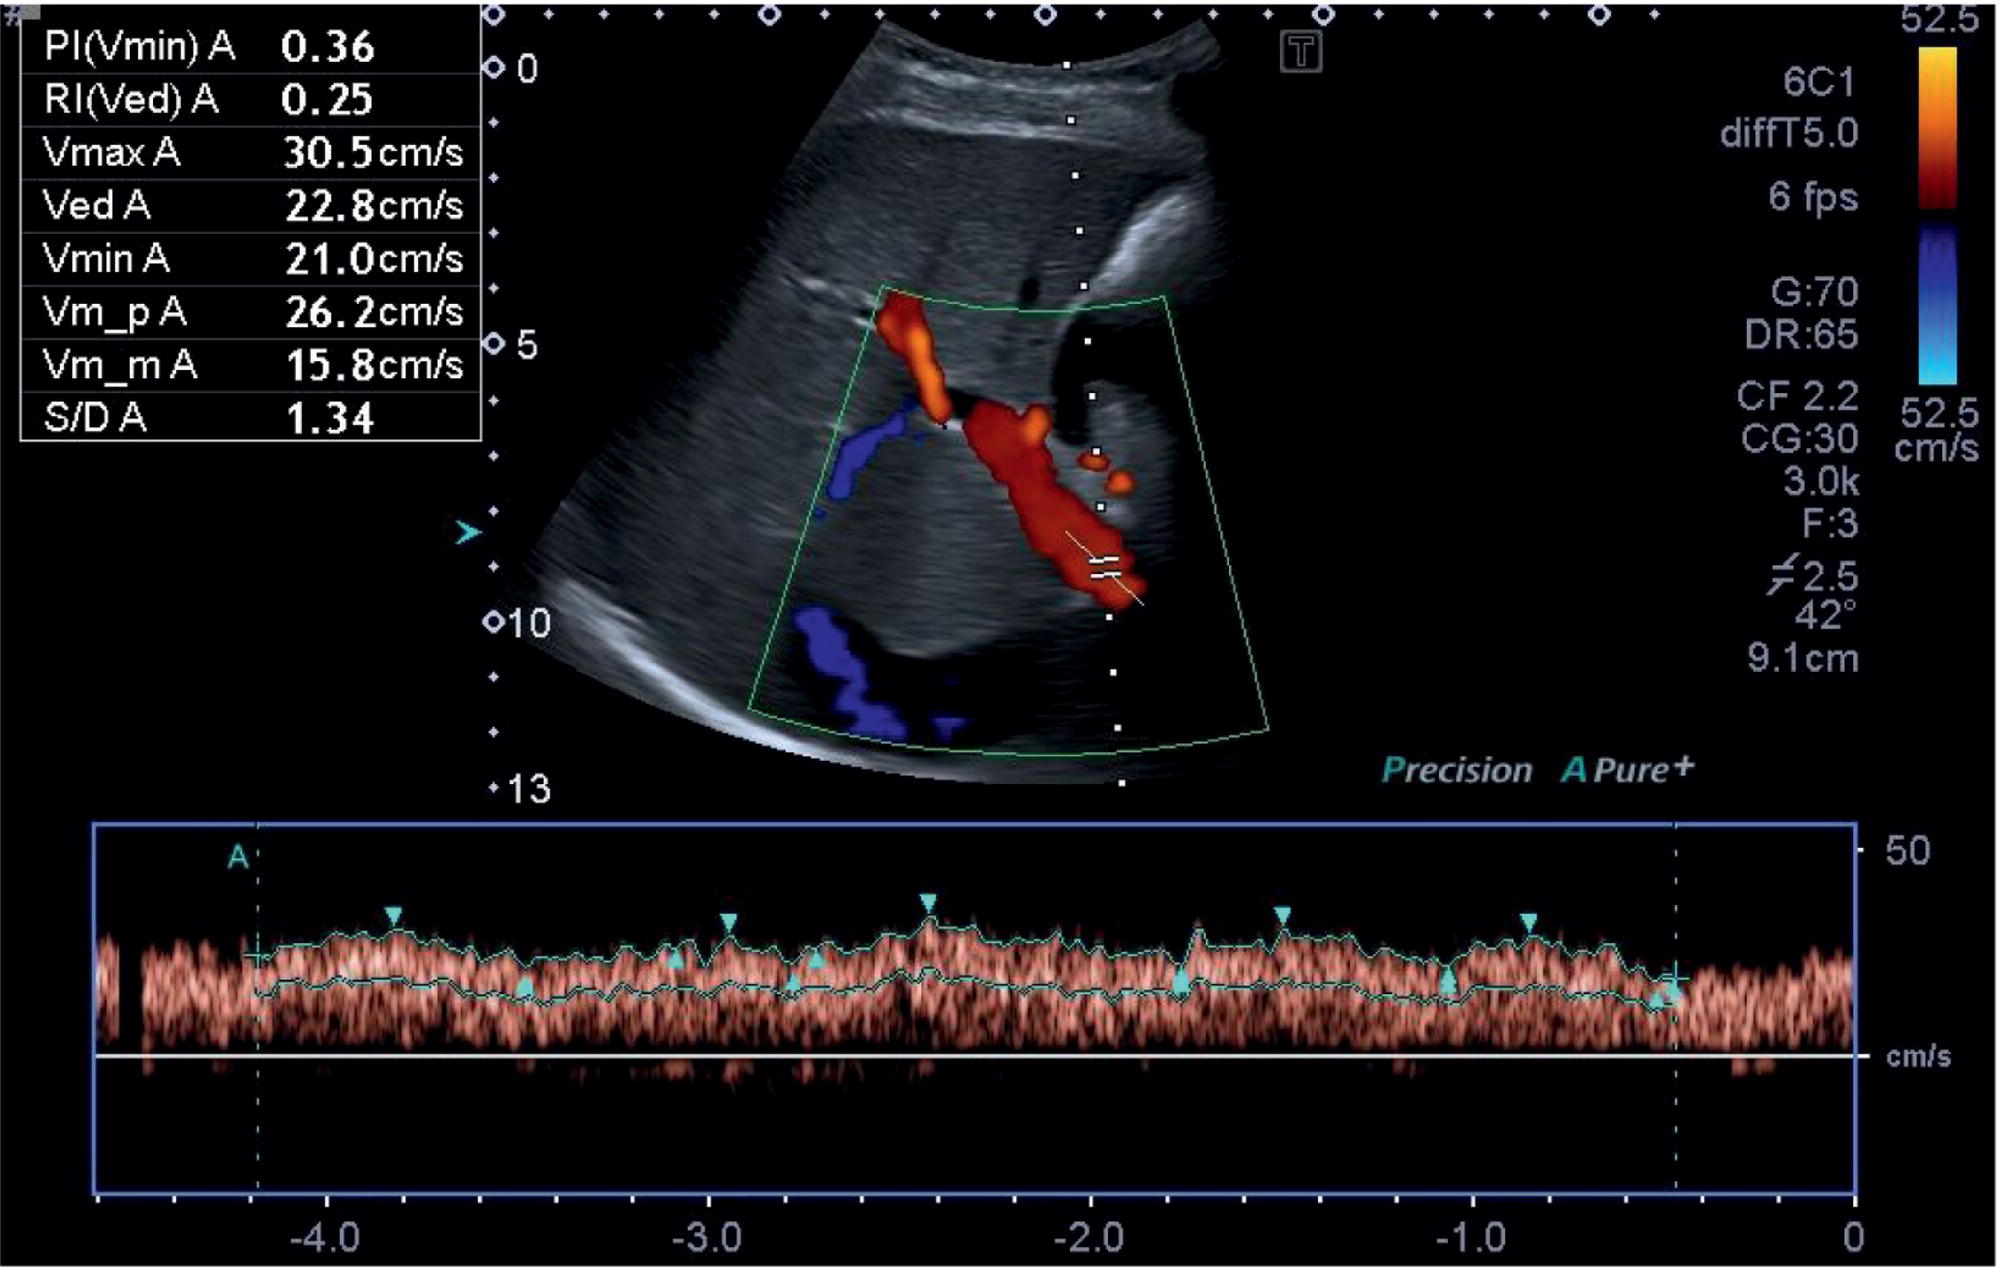
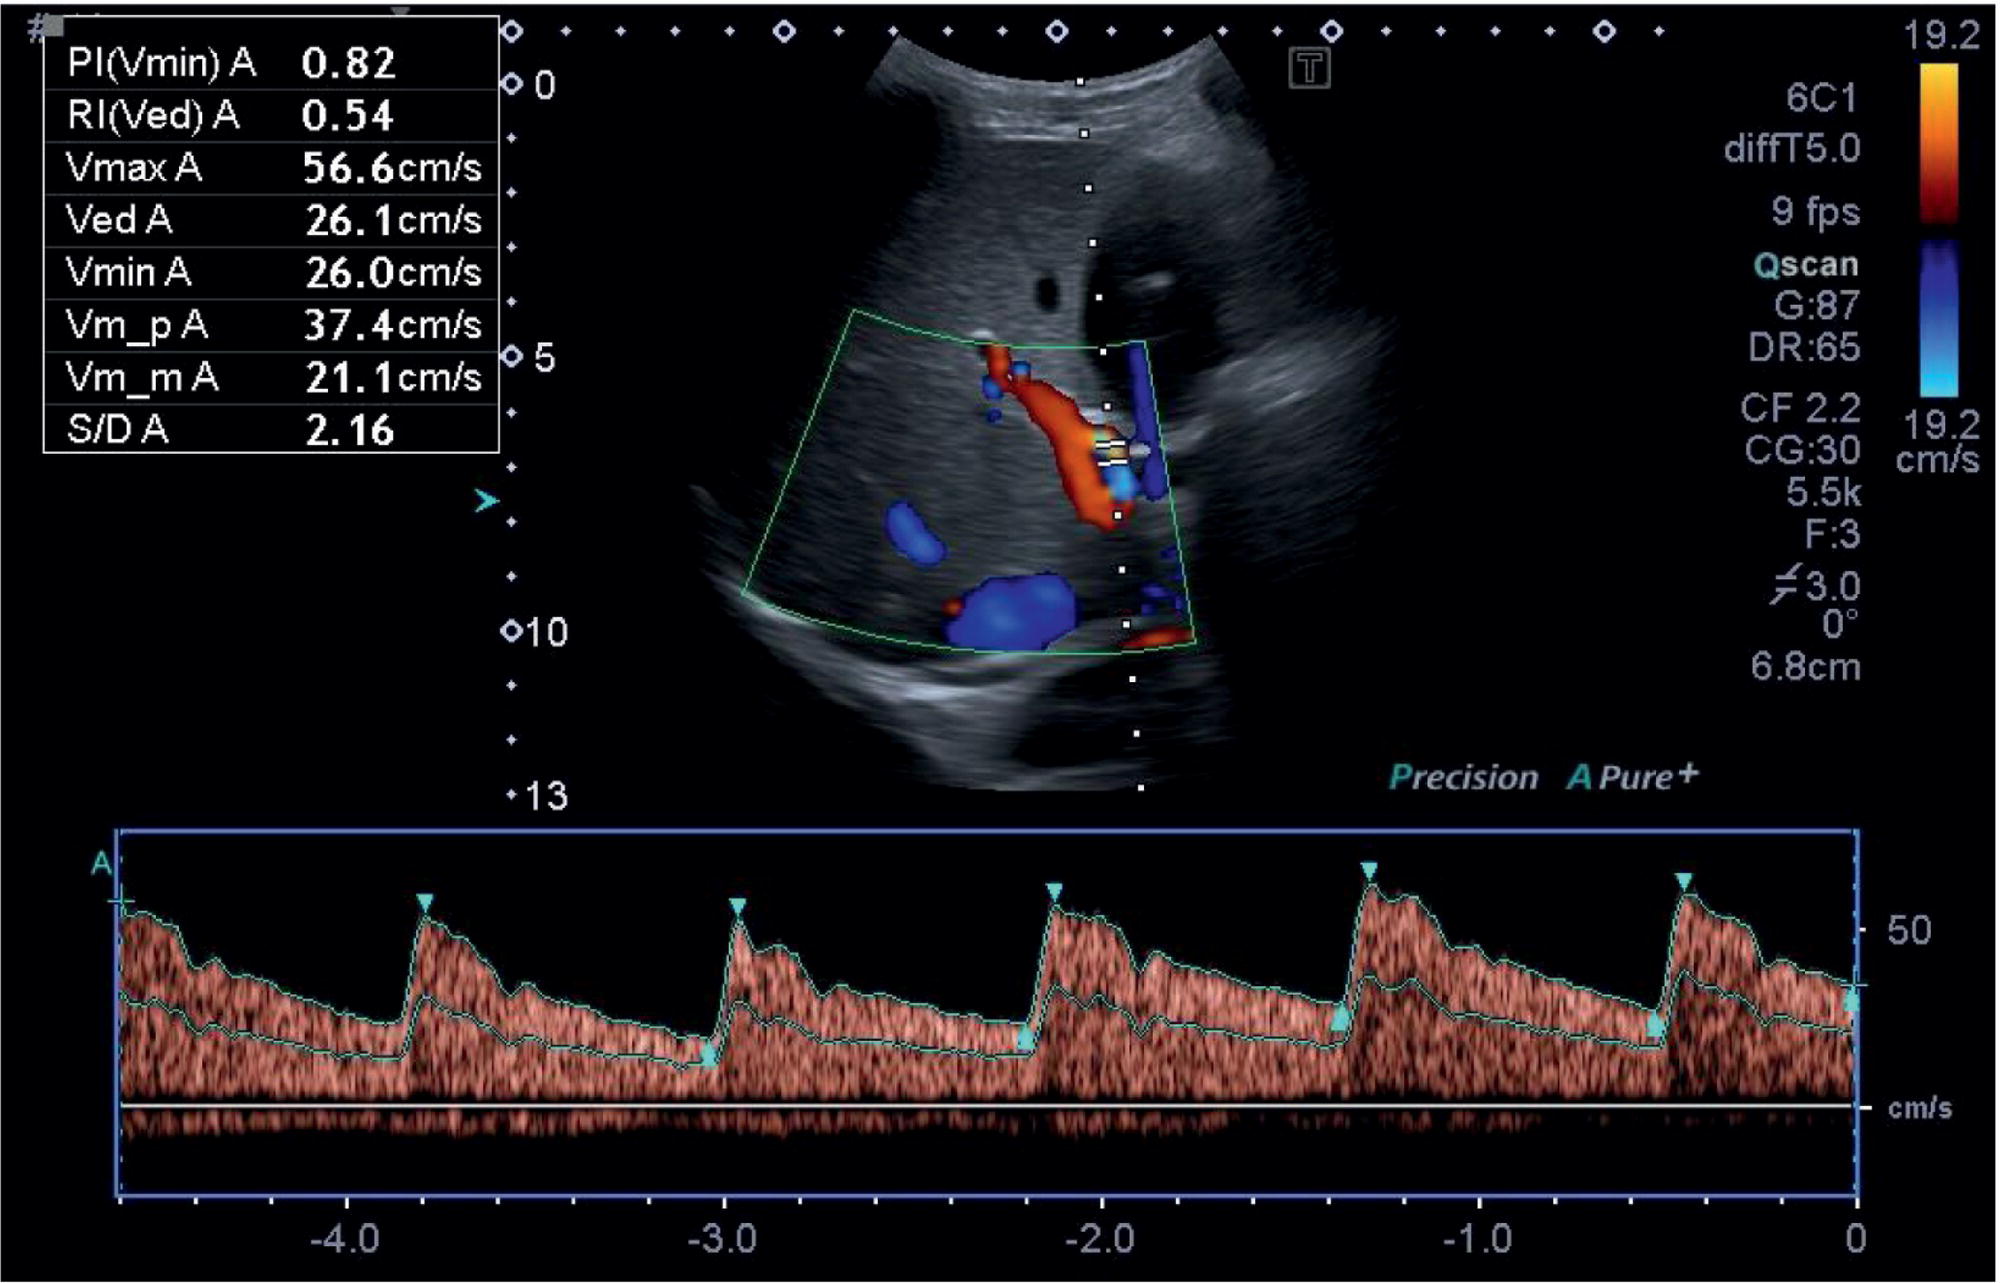
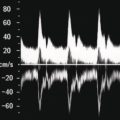
The confluence of the hepatic veins in the subcostal oblique view provides a good starting point to visualise their patency. From there the LHV, MHV, and RHV can be visualised along their entirety to the IVC with B‐mode and colour Doppler. These should also be assessed with spectral Doppler, best in the longitudinal plane, primarily to assess the flow phasicity (Figure 3.37) [9]. An assessment of the HA is usually not performed for routine clinical purposes. However, there has been much work assessing the Doppler flow of the HA in research studies for chronic liver disease [10–12]. The HA is typically visualised at the porta hepatis and in the longitudinal plane. A spectral Doppler trace allows measurement of the velocities and resistive index (Figure 3.38). Note that there are anatomical variants of the origin of the hepatic artery, which can be difficult to ascertain on occasion especially with ultrasound.
The Spleen
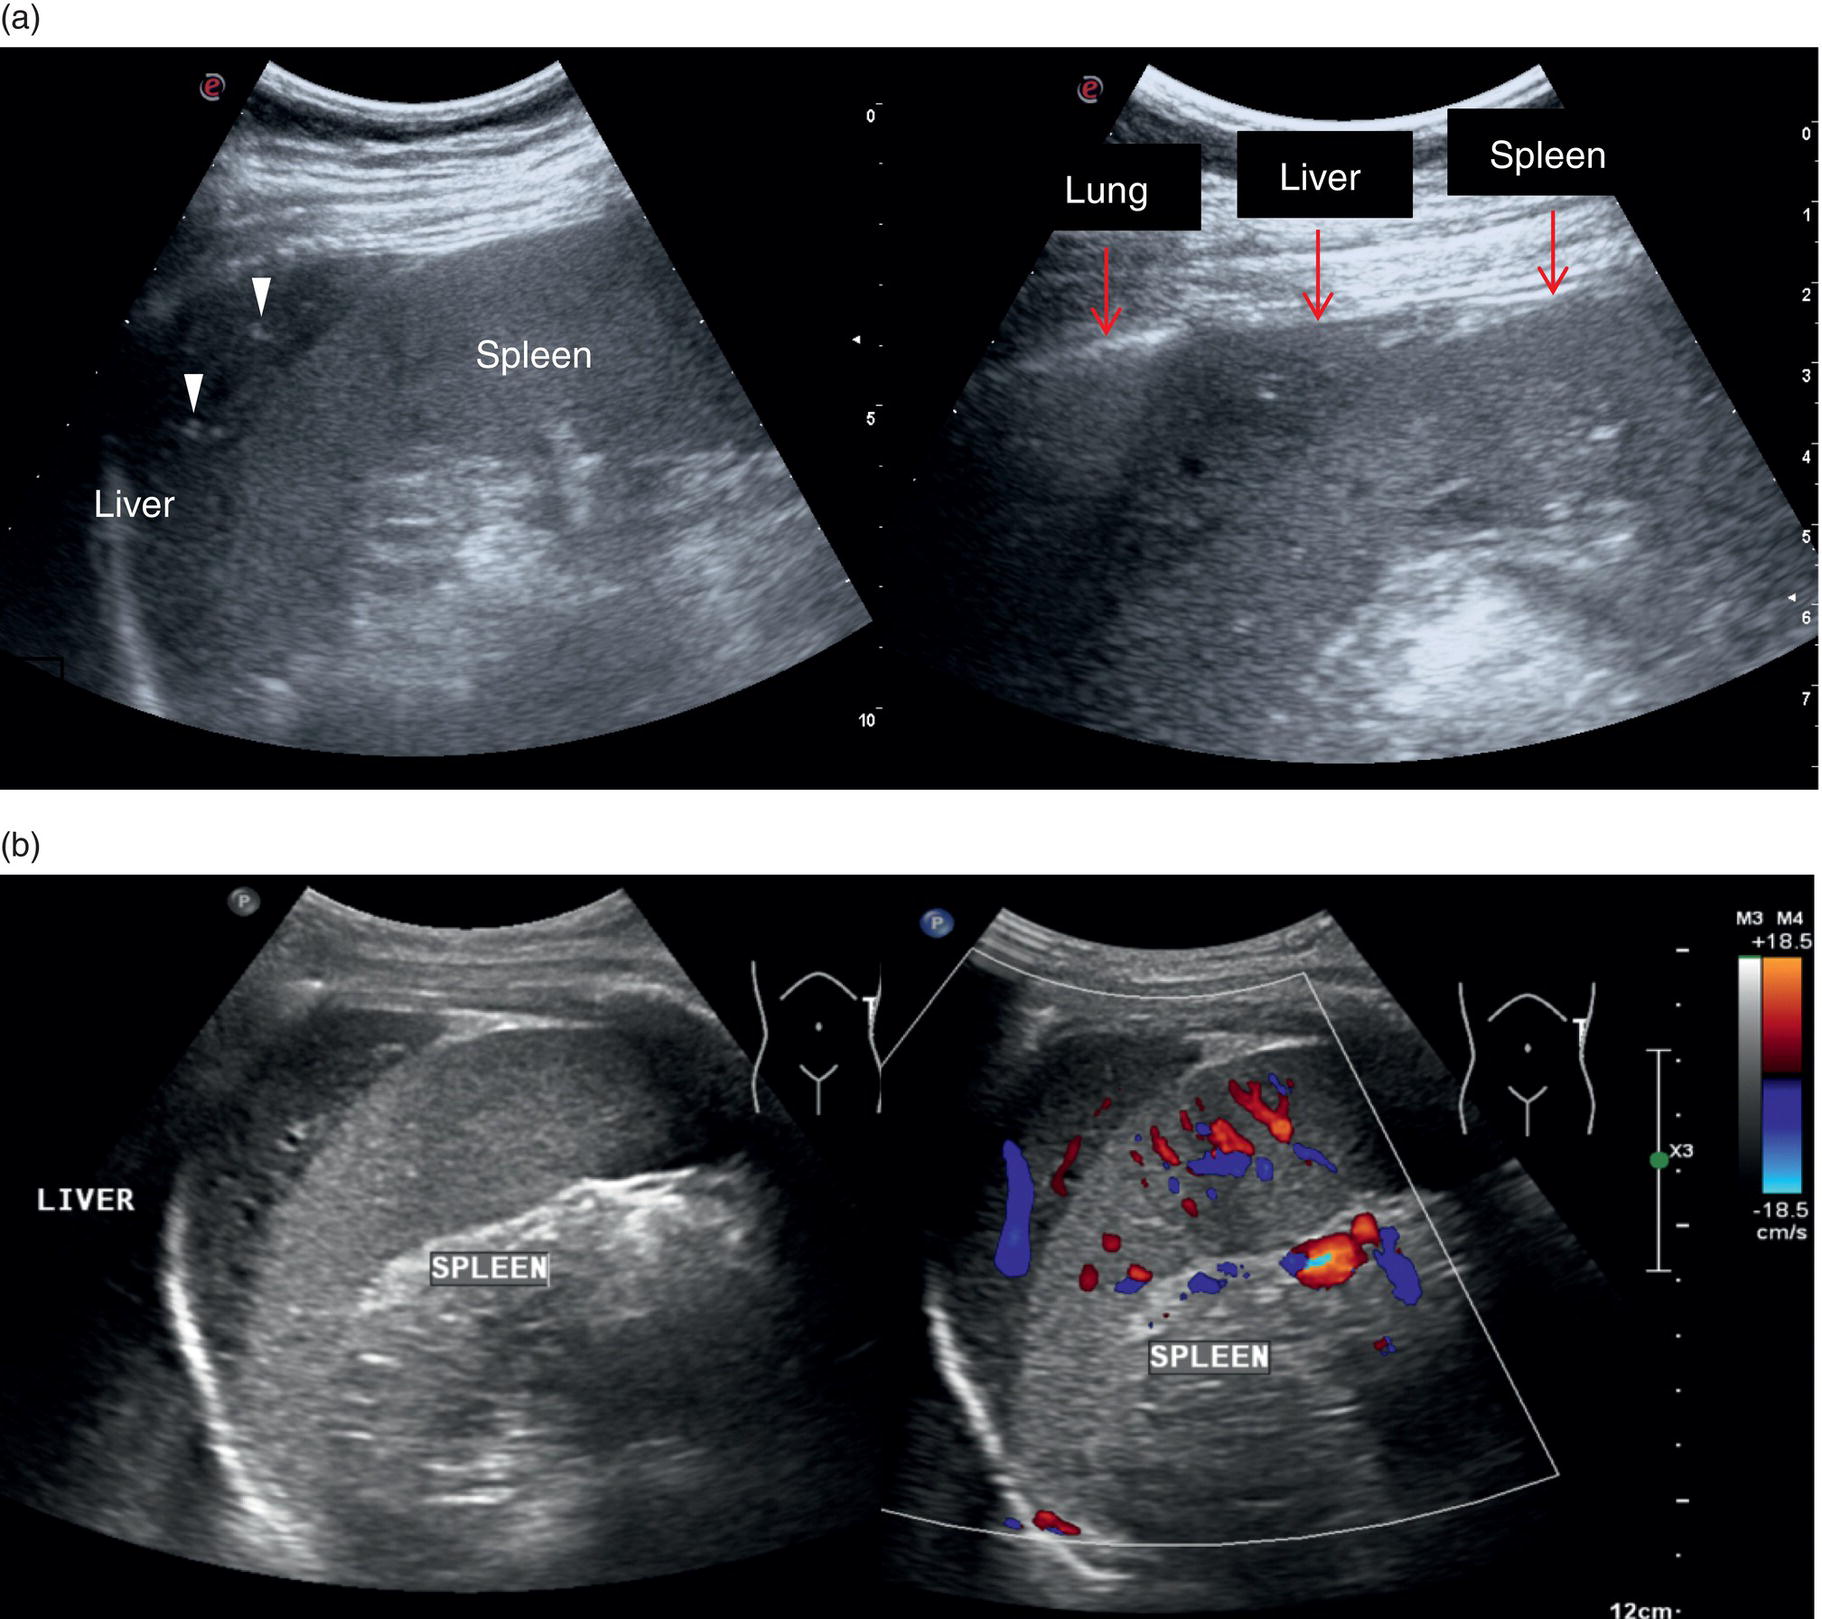
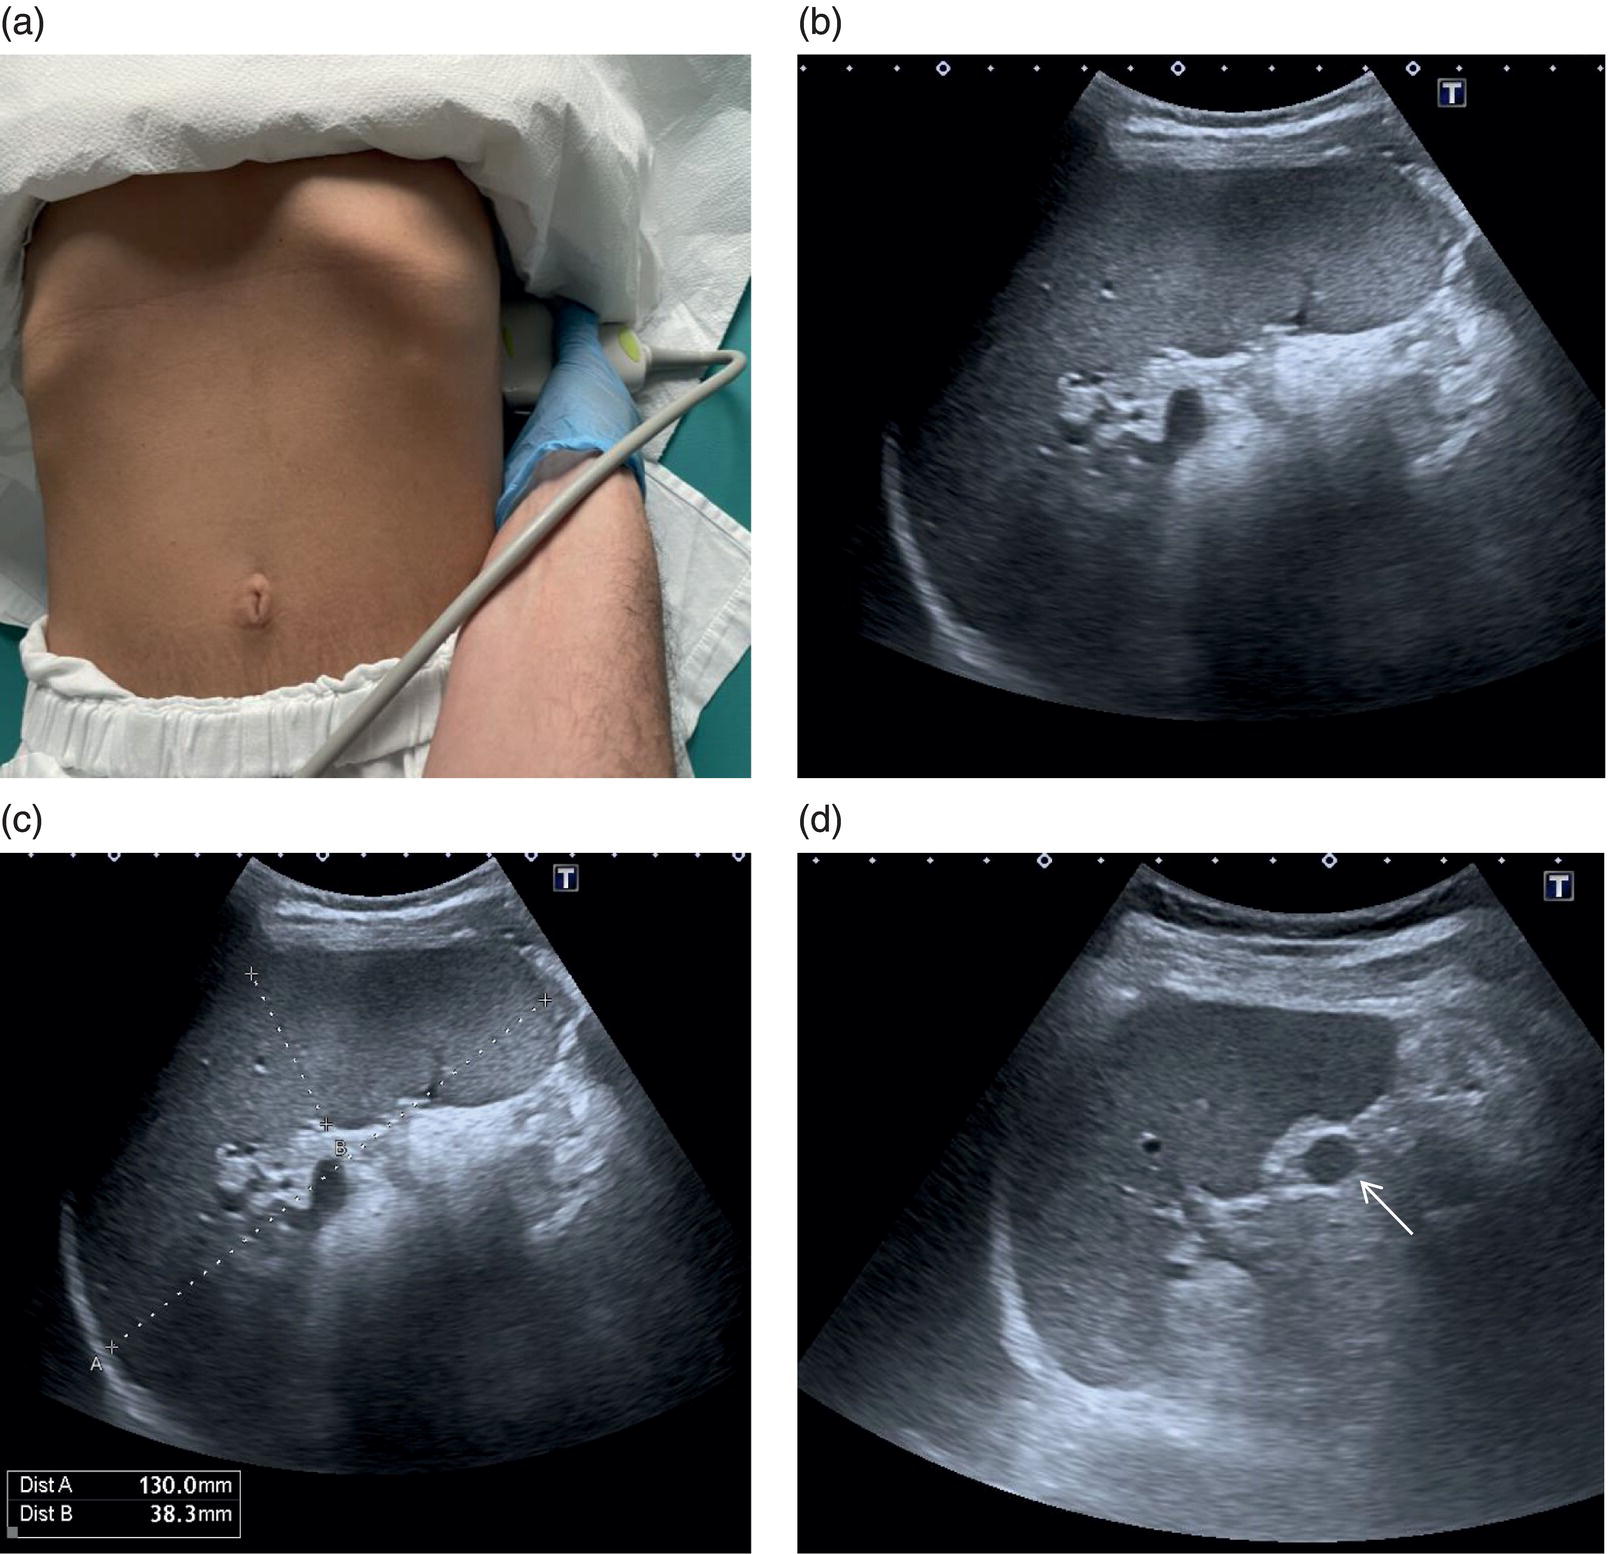
The spleen is a very important organ in liver disease, since it is linked anatomically and physiologically to the liver through the portal venous system. Its increase in size is described as one of the hallmarks of significant portal hypertension in cirrhosis (see Chapter 8), although extrahepatic causes of splenomegaly should always be borne in mind. Therefore, when performing a liver ultrasound scan, the size of the spleen must always be described, highlighting both longitudinal and anteroposterior diameters (respective cut‐offs ≤13 cm and ≤4 cm). However, splenic parenchymal evaluation is also very important in addition to the splenic size, where textural differences can be seen with different pathological conditions ranging from infectious diseases, haematological and immune/inflammatory‐related pathologies as well as congenital and acquired vascular malformations. Moreover, splenic parenchyma can also be the site of benign and primary or secondary malignancies manifesting as discrete focal lesions. Of note, accessory spleens (splenunculi) are relatively common (Figure 3.39). These are typically rounded or ovoid small lesions with similar splenic echotexture and vascularity. They are a result of the incomplete fusion of splenic tissue into a single organ during its embryonal development and thus can occur anywhere along the splenic bed. Occasionally, these can be difficult to distinguish from peritoneal or renal lesions and thus may require contrast ultrasound or further imaging for confirmation.The spleen is assessed intercostally through the left lateral intercostal spaces with the patient lying supine. Keep in mind that in some cases the spleen is more posterior and difficult to visualise entirely (Figure 3.39). In case of splenomegaly, the spleen can be assessed with a longitudinal subcostal scan; alternatively, in case of a normal‐sized spleen the intercostal approach remains the best option. Imaging may be improved sometimes by turning the patient right side down, although sometimes bowel loops and the lung might interfere, leading to suboptimal imaging.
Liver Ultrasound Report
The ultrasound report is an official document, a proof of findings that has medical and legal implications. Hence, for clarity, it is best to follow a standardised ‘checklist’. This has the advantage of being a point of reference for the operator, but also makes for ease of reading and interpretation by the referring clinical team. Ideally, the report should be clear, concise, simple to read, and, importantly, it should answer the clinical question.
The name and date of birth of the patient as well as the clinical history‐specific request for the scan should be documented within the report. A misleading result of a ‘normal scan’ should be avoided. Therefore, if for any reason imaging is suboptimal or the scan inconclusive, this should be clearly documented in the report, owing to the potential for a missed pathology. In some instances, the types of transducer used may also be specified.
The ultrasound report should start describing the size, echotexture, echogenicity, and contour of the liver. Note should be made of any anatomical variants. A normal liver typically has a homogeneous echotexture, with angular margins and a smooth contour. The liver contour is best assessed using the highest‐frequency linear transducer possible. The liver echogenicity is equal to or subtly brighter than the cortex of the right kidney.
The echotexture of the liver is a very important feature to describe, because it is related to the potential presence of underlying chronic liver disease. However, it is a sensitive but not specific observation, since it is also seen in other conditions, hence careful integration with other parameters and patient information is warranted before jumping to conclusions.
Finally, the observation of hepatic parenchyma should include the description of focal liver lesions or highlight their absence. If a focal lesion is found, several parameters should be described: the location, in terms of right or left lobe and the relative liver segment; the shape and size (maximum diameter); the echogenicity as well as the homogeneous or heterogeneous appearance; the presence of calcifications; the presence of a peripheral halo. If present, the displacement of vessels or biliary tracts adjacent to the lesion should also be described. The use of colour/power Doppler may be useful in some cases, as well as the description of some artefacts that may help with a differential diagnosis.
The GB assessment requires the description of its size, appearance of its lumen (if it has a distended or contracted appearance), as well as the wall width and content. Signs of inflammation or sinister pathology and indications for further imaging should be outlined. The biliary tree should be described with respect to the intra‐ and extrahepatic ducts and the calibre of the CBD should always be reported. If dilatation of the biliary tree is noted, information on the site of the obstruction or calibre change should be documented. The pancreas should also be commented on, especially if there is dilatation of the CBD and pancreatic duct.
When describing the portal venous system, the calibre, patency, and flow direction of the intra‐and extrahepatic PV should be reported, together with the splenic and superior mesenteric veins if these can be clearly visualised. If features of PV thrombosis are found, the extent, echogenicity, and partial or complete occlusion of the vessel should be reported.
The HA usually is not described on a routine scan unless specific abnormalities are found, such as dilatation and areas suspected of shunting. In conditions such as hepatic trauma or liver transplantation, focal dilatations need to be excluded, since they may be complicated by pseudoaneurysms, while flow velocities and resistive indices may highlight the presence of stenosis or other post‐transplant complications (see Chapter 13).
The IVC and hepatic veins should always be described because of their haemodynamic cardiac relationship and potential underlying pathology, which may directly cause an outflow obstruction syndrome. The IVC should always be traced up to the atrio‐caval junction (see Chapters 8 and 12).
The spleen is an important organ in liver pathology and in general its echotexture, size, and presence of focal lesions including splenunculi, should always be described. In cirrhosis, the presence of perisplenic porto‐systemic vascular shunts suggesting clinically significant portal hypertension should always be reported.
Even if the ultrasound request is focused on liver imaging, in general, an upper abdominal ultrasound scan should also include both kidneys. The right kidney is commonly evaluated since it serves as a comparison of liver parenchyma echogenicity to highlight the possible presence of steatosis, as mentioned previously.
Lastly, the presence or absence of ascites needs to be highlighted, describing if there is a small, moderate, or marked amount of fluid. If present, the sonographic characteristics of the ascitic fluid should also be described, especially if it has a multiloculated appearance, as that may be a result of infection, bleeding, or underlying malignancy. Moreover, it has therapeutic implications where drainage may prove challenging.
It is also worth commenting on observations above the right hemidiaphragm, most commonly a pleural effusion or lobar consolidation.
Overall, a good ultrasound study is tailored to the clinical history and question to be answered. It is beneficial that the operator should have sufficient knowledge and skill to be able to assess the other respective upper abdominal organs and not just the liver. If not, then the operator should be aware of their own limitations and put pathways in place for referral to an appropriate person with the required skills.
Videos
Videos for this chapter can be accessed via the companion website: www.wiley.com/go/LiverUltrasound.
References
- 1 Dietrich, C.F., Serra, C., and Jedrzejczyk, M. (2020). Ultrasound of the Liver. London: European Federation for Ultrasound in Medicine.
- 2 Jenssen, C., Bridson, J.‐M., Barreiros, A.P. et al. (2020). Ultrasound of the Gallbladder and Biliary System. London: European Federation for Ultrasound in Medicine.
- 3 Neumyer, M.M. (2017). Ultrasound evaluation of the hepato–portal system. J. Vasc. Ultrasound 41 (2): 76–86.
- 4 Couinaud, C. (1957). Le foie: Etudes anatomiques et chirurgicales. Paris: Masson.
- 5 Caseiro‐Alves, F., Seco, M., and Bernardes, A. (2013). Liver anatomy, congenital anomalies, and normal variants. In: Abdominal Imaging (ed. B. Hamm and P.R. Ros), 983–1000. Berlin: Springer.
- 6 Glennison, M., Salloum, C., Lim, C. et al. (2014). Accessory liver lobes: anatomical description and clinical implications. J. Visc. Surg. 151: 451–455.
- 7 Catalano, O.A., Singh, A.H., Uppot, R.N. et al. (2008). Vascular and biliary variants in the liver: implications for liver surgery. Radiographics 28 (2): 359–378.
- 8 Wachsberg, R.H., Angyl, E.A., Klein, K.M. et al. (1997). Echogenicity of hepatic versus portal vein walls revisited with histologic correlation. J. Ultrasound Med. 16 (12): 807–810.
- 9 McNaughton, D.A. and Abu‐Yousef, M.M. (2011). Doppler US of the liver made simple. RadioGraphics 31: 161–188.
- 10 Lim, A.K., Patel, N., Eckersley, R.J. et al. (2005). Can Doppler sonography grade the severity of hepatitis C‐related liver disease? Am. J. Roentgenol. 184 (6): 1848–1853.
- 11 Park, H.S., Desser, T.S., Jeffrey, R.B., and Kamaya, A. (2017). Doppler ultrasound in liver cirrhosis: correlation of hepatic artery and portal vein measurements with model for end‐stage liver disease score. J. Ultrasound Med. 36 (4): 725–773.
- 12 Piscaglia, F., Gaiani, S., Calderoni, D. et al. (2001). Influence of liver fibrosis on hepatic artery Doppler resistance index in chronic hepatitis of viral origin. Scand. J. Gastroenterol. 36 (6): 647–652.
3
Normal Liver Anatomy
How to Perform a Liver Ultrasound Scan
Adrian K.P. Lim1,2, Ivica Grgurevic3, and Matteo Rosselli4,5
1 Department of Imaging, Imperial College Healthcare NHS Trust, London, UK
2 Department of Metabolism, Digestion and Reproduction, Imperial College London, UK
3 Department of Gastroenterology, Hepatology and Clinical Nutrition, University Hospital Dubrava, University of Zagreb School of Medicine and Faculty of Pharmacy and Biochemistry, Zagreb, Croatia
4 Department of Internal Medicine, San Giuseppe Hospital, USL Toscana Centro, Empoli, Italy
5 Division of Medicine, Institute for Liver and Digestive Health, University College London, Royal Free Hospital, London, UK
Anatomy of the Liver and Ultrasound Appearance
Location, Shape, and Borders
The liver is the largest parenchymal organ in the abdominal cavity. It is located below the diaphragm, extending from the right hypochondrium to the epigastrium, usually reaching the left subcostal edge (Figure 3.1). It has a smooth, dome‐shaped diaphragmatic surface and a visceral, more irregular one, moulded by the adjacent organs and indented by the left, right, and interlobar fissures (Figure 3.2). Normally during respiration, the liver moves following the diaphragm. This movement is important and can be increased with deep inspiration to optimise liver visualisation during ultrasound imaging in a subcostal view. The magnitude of these excursions depends on the individual’s lung capacity as well as body habitus and the mechanical properties of the thoracic wall (obesity and some structural diseases of the musculature or bone of the thoracic wall reduce this oscillation). Owing to the liver’s high anatomical variability, it is generally accepted to compare its size to the right kidney to gauge whether it is enlarged, normal, or atrophic, rather than taking an exact measurement of its diameter [1]. A subcostal maximal length of 16 cm taken in the mid‐clavicular is considered the upper limit of normal.
The suspensory system of the liver is constituted by ligaments that are seen on ultrasound as hyperechoic linear structures of different widths that fix the liver to the diaphragm, abdominal wall, and adjacent organs. Other ligaments envelope vascular and biliary structures and provide useful landmarks for the description of the complex liver structure. More specifically, the falciform ligament connects the dorsal surface of the liver to the diaphragm and to the anterior abdominal wall dividing the liver into the anatomic right and left lobes. Its free margin continues with the remnant of the obliterated umbilical vein, which is known as the ligamentum teres (or round ligament) and runs along the ventral surface of the liver, coming into direct contact with the left branch of the portal vein (PV) (Figure 3.5). The obliterated remnants of the ductus venosus constitute the venous ligament, which is seen on ultrasound as a thin hyperechoic line that surrounds the parenchyma adjacent to the retrohepatic inferior vena cava (IVC) defining the borders of the caudate lobe (Figure 3.6). The lesser omentum attaches the liver to the lesser curvature of the stomach through the hepatogastric ligament and to the duodenum through the hepatoduodenal ligament. The latter envelopes the portal triad running from the porta hepatis to the very first portion of the duodenum. It contains the liver lymphatics and is often the site of lymphadenopathies that can be seen in infective, inflammatory, or neoplastic liver diseases.
In normal conditions, the liver has smooth margins and regular contour, the echotexture is homogeneous, and the echogenicity is almost equal to or slightly brighter than the cortex of the right kidney (Figure 3.3). The liver is enveloped within the fibrous Glisson’s capsule, which contains sensitive nerve endings supplied by the phrenic nerve. The capsule can be barely seen on ultrasound as a hyperechoic line that permeates the liver in direct contact with the peritoneum and is therefore more easily distinguished when there is ascites (Figure 3.4).
Gallbladder and Biliary Tree
The gallbladder (GB) is a pear‐shaped structure located in the GB fossa along the inferior surface of the right liver lobe, lateral to the second portion of the duodenum and anterior to the right kidney (Figure 3.7). Its position is variable according to the patient’s body habitus [2]. Four anatomical variants are described and should be borne in mind, since anatomical landmarks and GB positioning might vary considerably:
- Hypersthenic body habitus: the diaphragm, liver, GB, and stomach tend to lie high in the abdomen and the ultrasound examination is often limited due to the presence of overlying bowel gas and food residue.
- Sthenic: the liver and GB lie as expected in the right upper quadrant and the GB has an oblique position.
- Hyposthenic: the liver and GB lie lower, often in the lumbar region, and the GB is more vertically oriented.
- Asthenic (extremely hyposthenic): the liver and GB might lie as low as in the right iliac fossa and the GB is vertically oriented [2].
The biliary tree can be divided into intrahepatic and extrahepatic segments. The intrahepatic ducts run across the liver from the periphery to the liver hilum, converging in larger ducts, and are in tight anatomical connection with the hepatic arterial supply and the portal venous system. In proximity to the liver hilum, the cystic duct that drains bile from the GB joins the main hepatic duct to form the common bile duct (CBD). The CBD terminates with the pancreatic duct at the ampulla of Vater within the second portion of the duodenum.
In normal physiological conditions, the CBD is the only biliary duct that can be clearly seen as a thin tubular structure with echogenic walls that in the majority of cases runs anteriorly and parallel to the PV at the level of the hepatic hilum (Figure 3.8). However, the anatomical relationship of the biliary ducts and the portal vessels may vary along their course, and usually the peripheral biliary ducts (which are only clearly visible when dilated or significantly thickened) run posteriorly to the PV (Figures 3.9 and 3.10).
The CBD measures between a minimum of 2–3 mm and an upper limit of 6–7 mm. Larger calibres are observed, especially post cholecystectomy and with age, where it is generally accepted that the calibre may increase by 1 mm each decade after 70 years [3].
Liver Vascular Anatomy
The PV is formed by the confluence of the superior mesenteric vein and the splenic vein, draining the blood of the whole digestive system and spleen (Figure 3.11). Under physiological conditions the portal venous system delivers 75% of the total hepatic inflow, whereas the hepatic artery (HA) is responsible for the remaining 25%. It is important to keep in mind the physiology and pathophysiology of the hepatic blood inflow, since during the progression of liver disease, especially when cirrhosis and portal hypertension develop, the portal venous inflow is reduced while the arterial hepatic inflow is increased (See Chapter 8). The PV can be recognised on ultrasound as a tubular structure with a variable normal calibre of approximately 8–12.5 mm, with thick echogenic walls that enters the liver together with the HA at the level of the hepatic hilum. It is followed by the HA and the biliary system in its whole intrahepatic course and for a short portion in its extrahepatic tract at the level of the porta hepatis, where it is contained within the hepatoduodenal ligament. Upon entering the liver, the PV and HA divide into the left and right branches, with further divisions providing the blood supply to each of the eight main liver segments (Figure 3.12). At the periphery of the liver lobules the arterial and venous blood mix and enter the sinusoids, terminating finally in the central veins that converge to form the right (RHV), middle (MHV), and left hepatic veins (LHV) that finally drain into the IVC (Figure 3.13). It is of note that the caudate lobe is drained independently by a main or multiple small pericaval veins. Its independent venous drainage system is the reason why the caudate lobe typically hypertrophies in advanced chronic liver disease. In Budd–Chiari syndrome, this compensatory mechanism is even more pronounced, since while the main three hepatic veins are obstructed, the pericaval ones often remain patent, leading to an abnormally hypertrophied caudate lobe (See Chapter 11).
Vascular Segments of the Liver
Based on the divisions of the portal and hepatic veins, the liver may be divided into eight segments, as first suggested by the French surgeon Claude Couinaud in 1957 (Figure 3.14) [4]. This classification relies on the fact that each of these segments has its own individual blood supply and might be resected without jeopardising the viability of other segments. In this classification, the liver segments II and III are situated to the left of the LHV and falciform ligament, and the left branch of the PV (LPV) divides them into segment II (above the PV) and segment III (below the LPV). Segment IV is situated between the LHV and the MHV and the LPV divides them into segment IVA (above the LPV) and segment IVB (below the LPV). Segments V and VIII are located between the MHV and RHV, whereas segments VI and VII represent most lateral segments situated to the right of the RHV. The right branch of the RPV divides segment V (caudal) from VIII (cranial) and segment VI (caudal) from VII (cranial) (Figure 3.15). On the dorsal, central part of the liver, between the IVC and the venous ligament, lies the caudate lobe that corresponds to segment I (Figures 3.6 and 3.12c).
Normal Variants of Liver Anatomy
Liver anatomical variants might be related to the shape, size, and vasculature, as well as the GB and biliary tree. Parenchymal variants include diaphragmatic slips, sliver of liver, Riedel’s lobe, and papillary process of the caudate lobe [5]. Diaphragmatic slips represent incomplete accessory fissures at the site of the diaphragmatic liver surface due to invagination of the diaphragm (Figure 3.16). A sliver of the liver refers to an anatomical variant where the left liver lobe extends to the left hypochondrium, wrapping around part of the spleen (Figure 3.17). Another common variant is a Riedel’s lobe, represented by a downward tongue‐like projection of the lower anterior edge of the right liver lobe (segment VI), sometimes so pronounced as to extend along the right paracolic space up to the iliac fossa (Figure 3.18) [6]. The papillary process is an anterior and medial extension of the caudate lobe, which might resemble a lymph node or mass next to the pancreatic head or IVC (Figure 3.19).
Other anatomical variants include the position of the PV, HA, and CBD at the level of the hepatic hilum. In the majority of cases the PV lies posteriorly, and the HA lies between the PV and the above CBD, while less frequently the HA will run above the CBD (Figure 3.20
Related posts:
Stay updated, free articles. Join our Telegram channel

Full access? Get Clinical Tree


