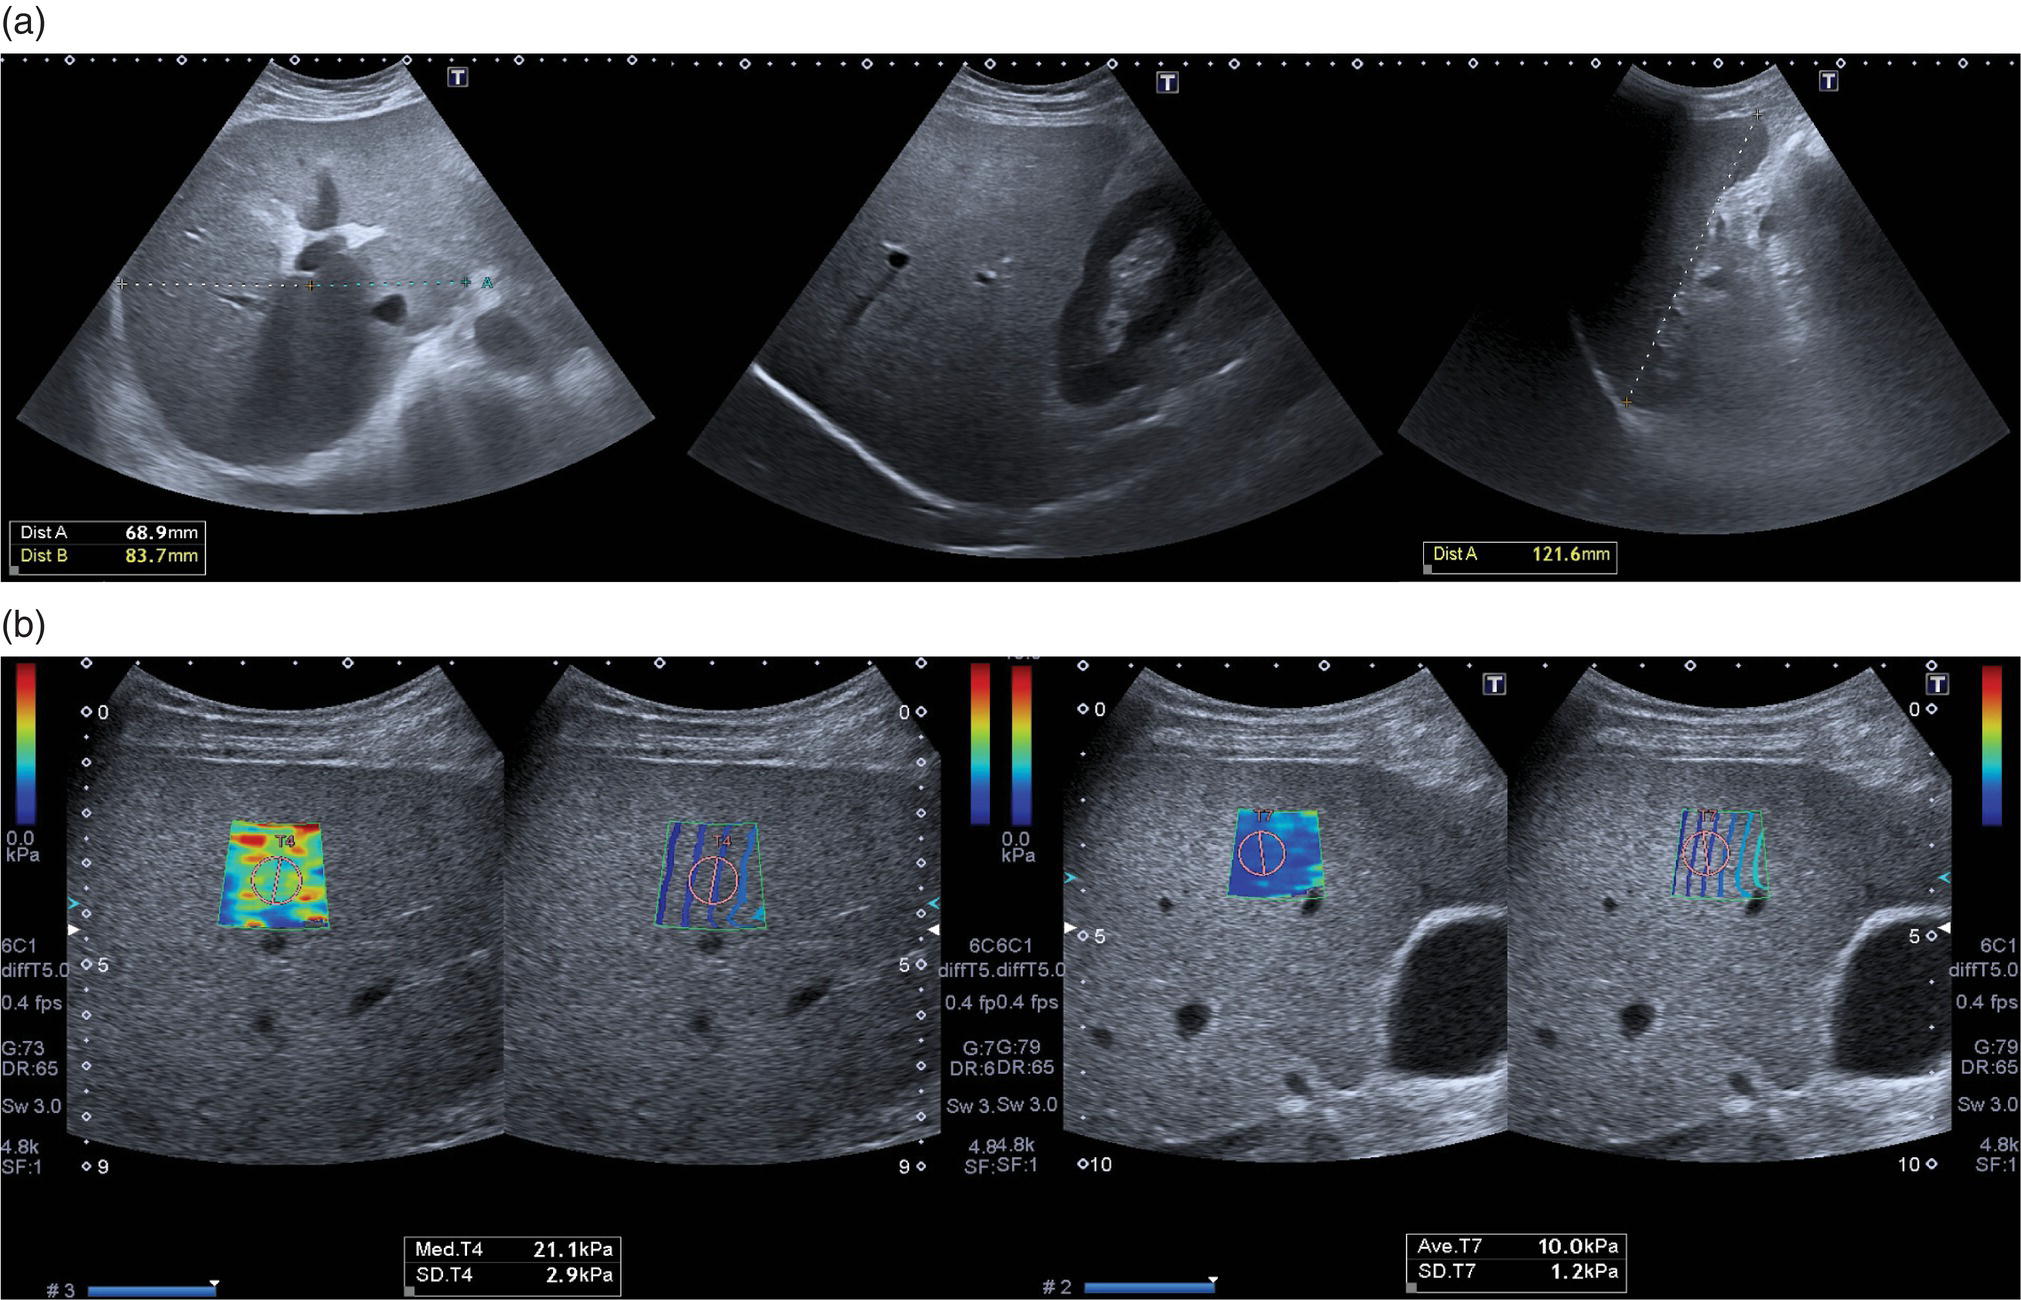
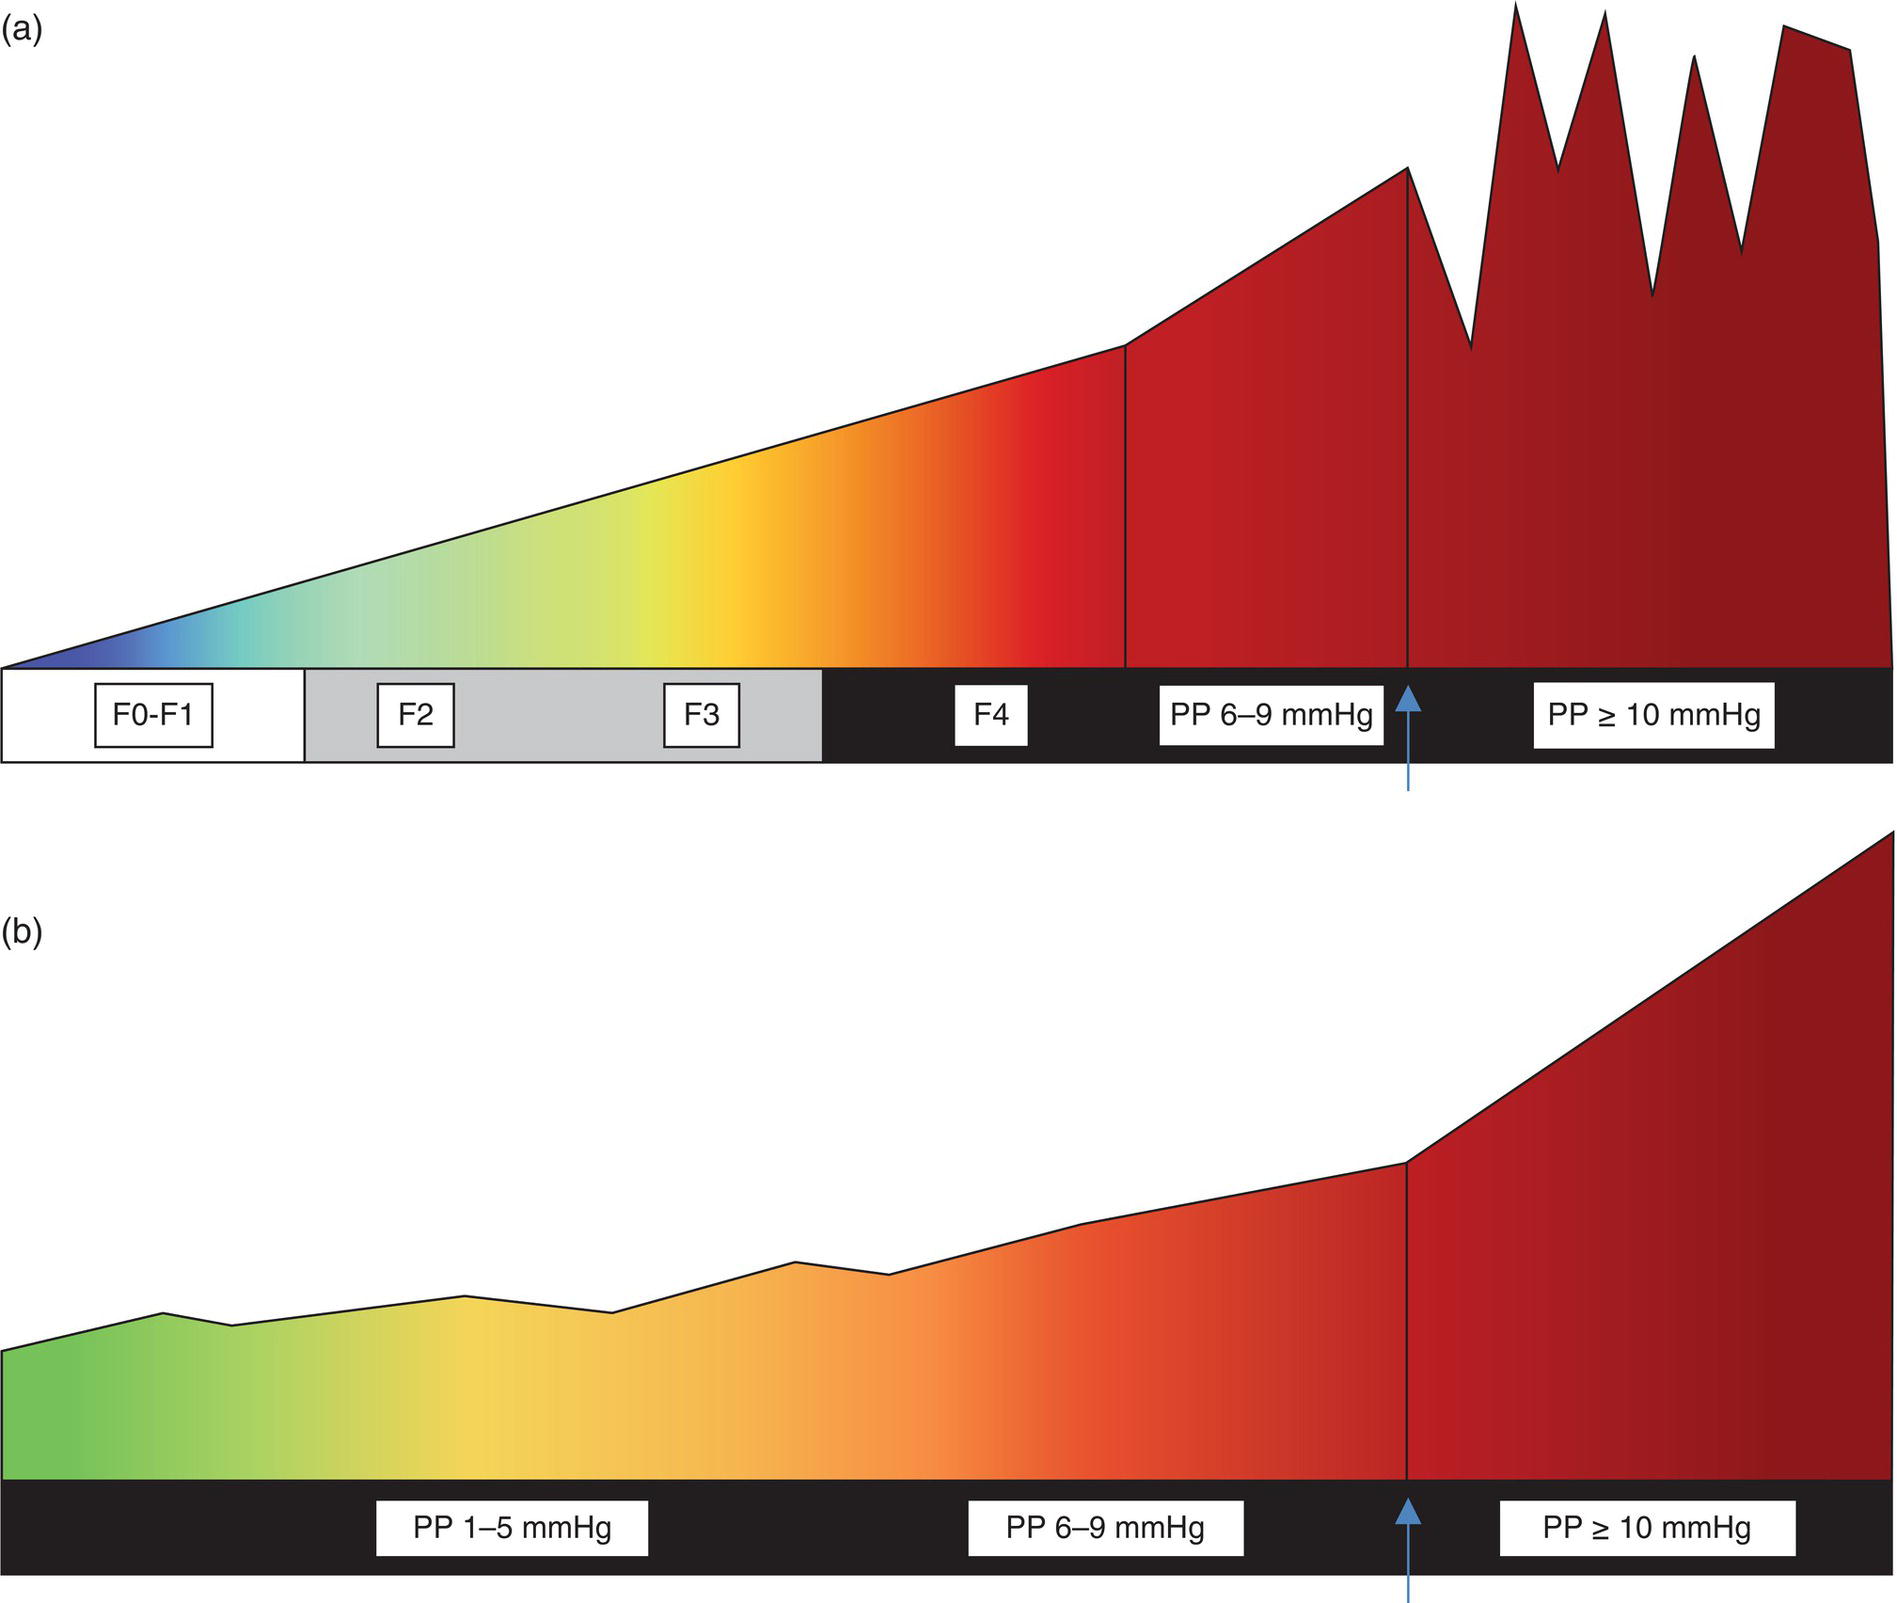
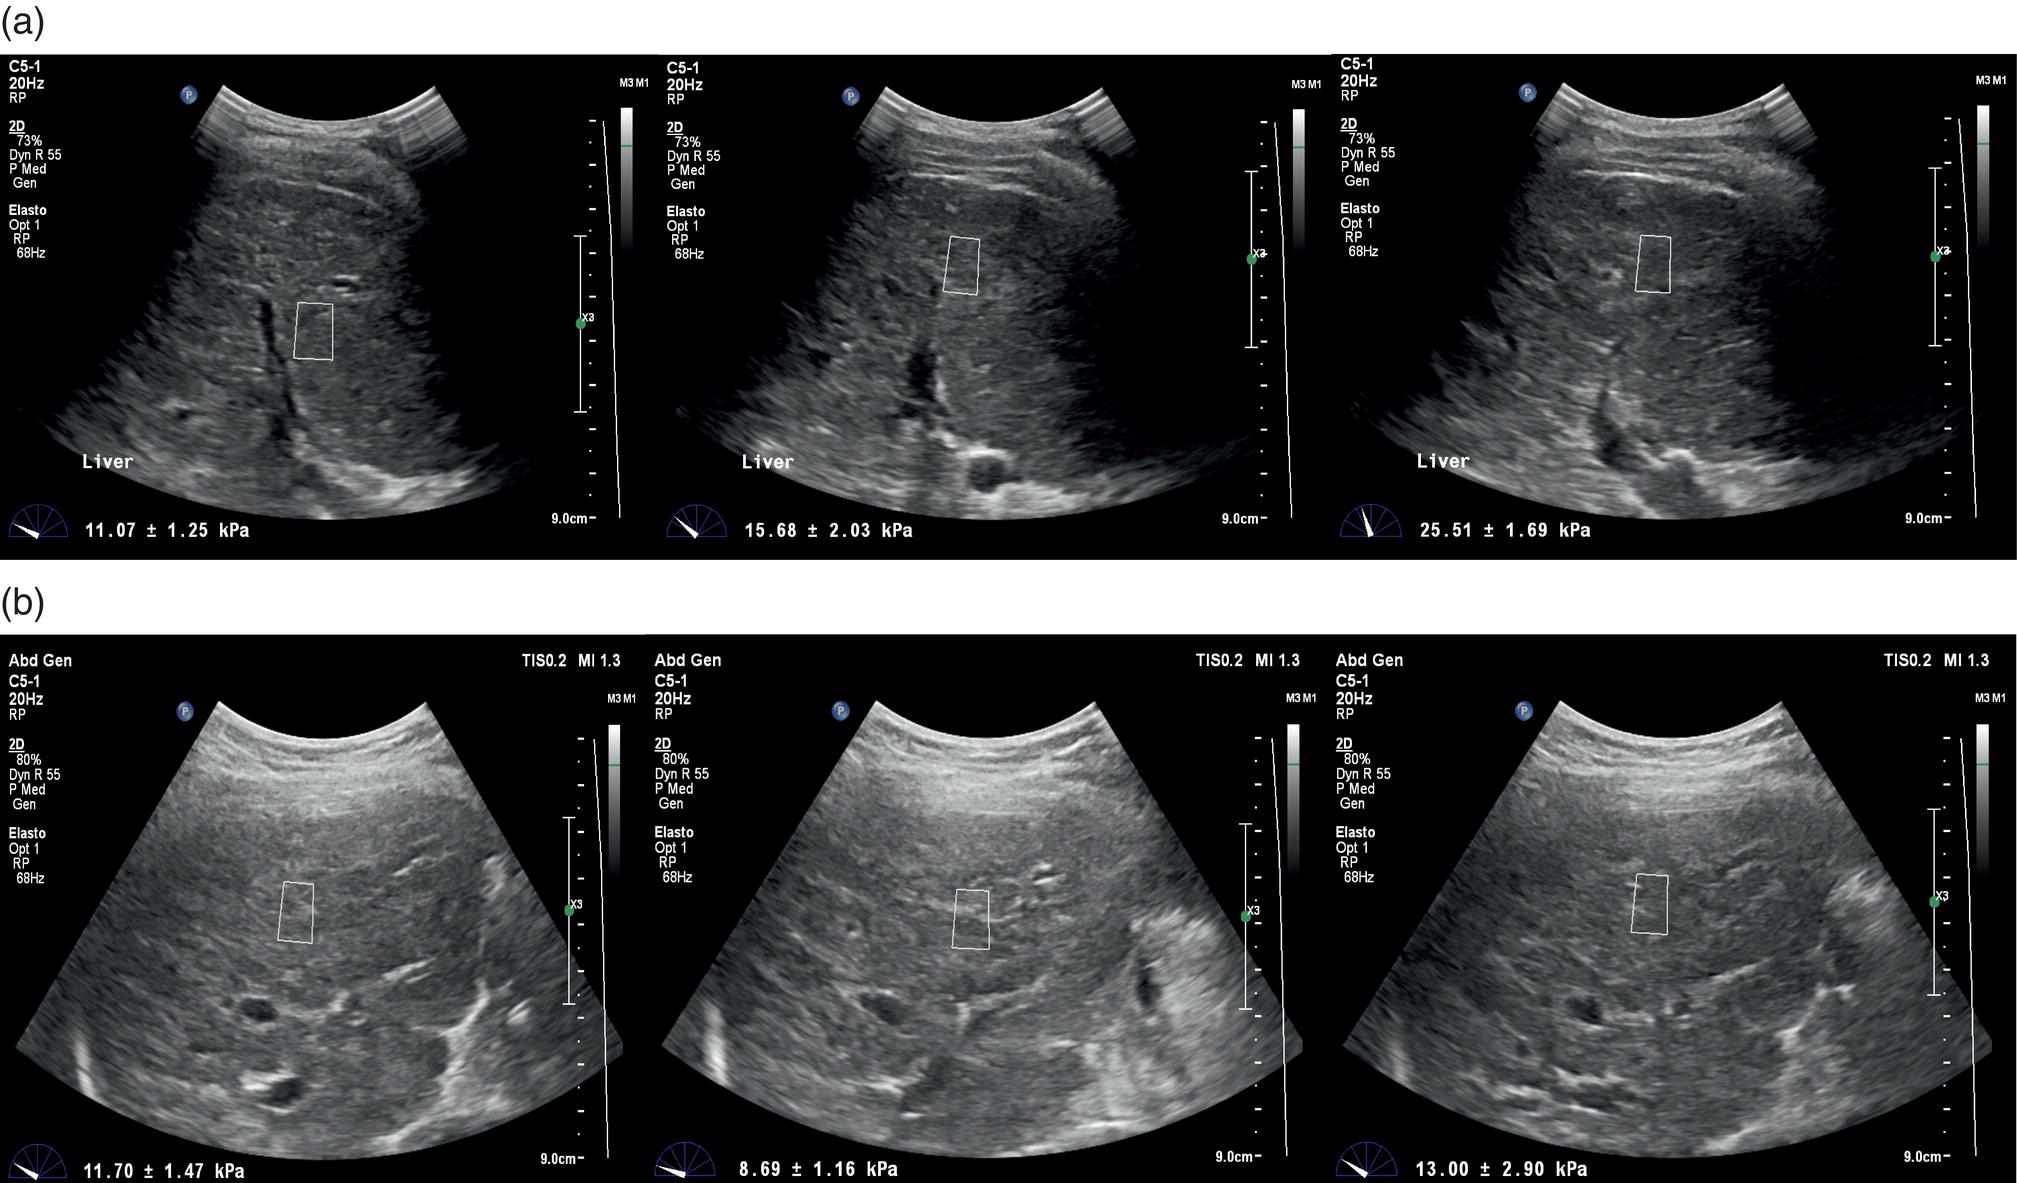
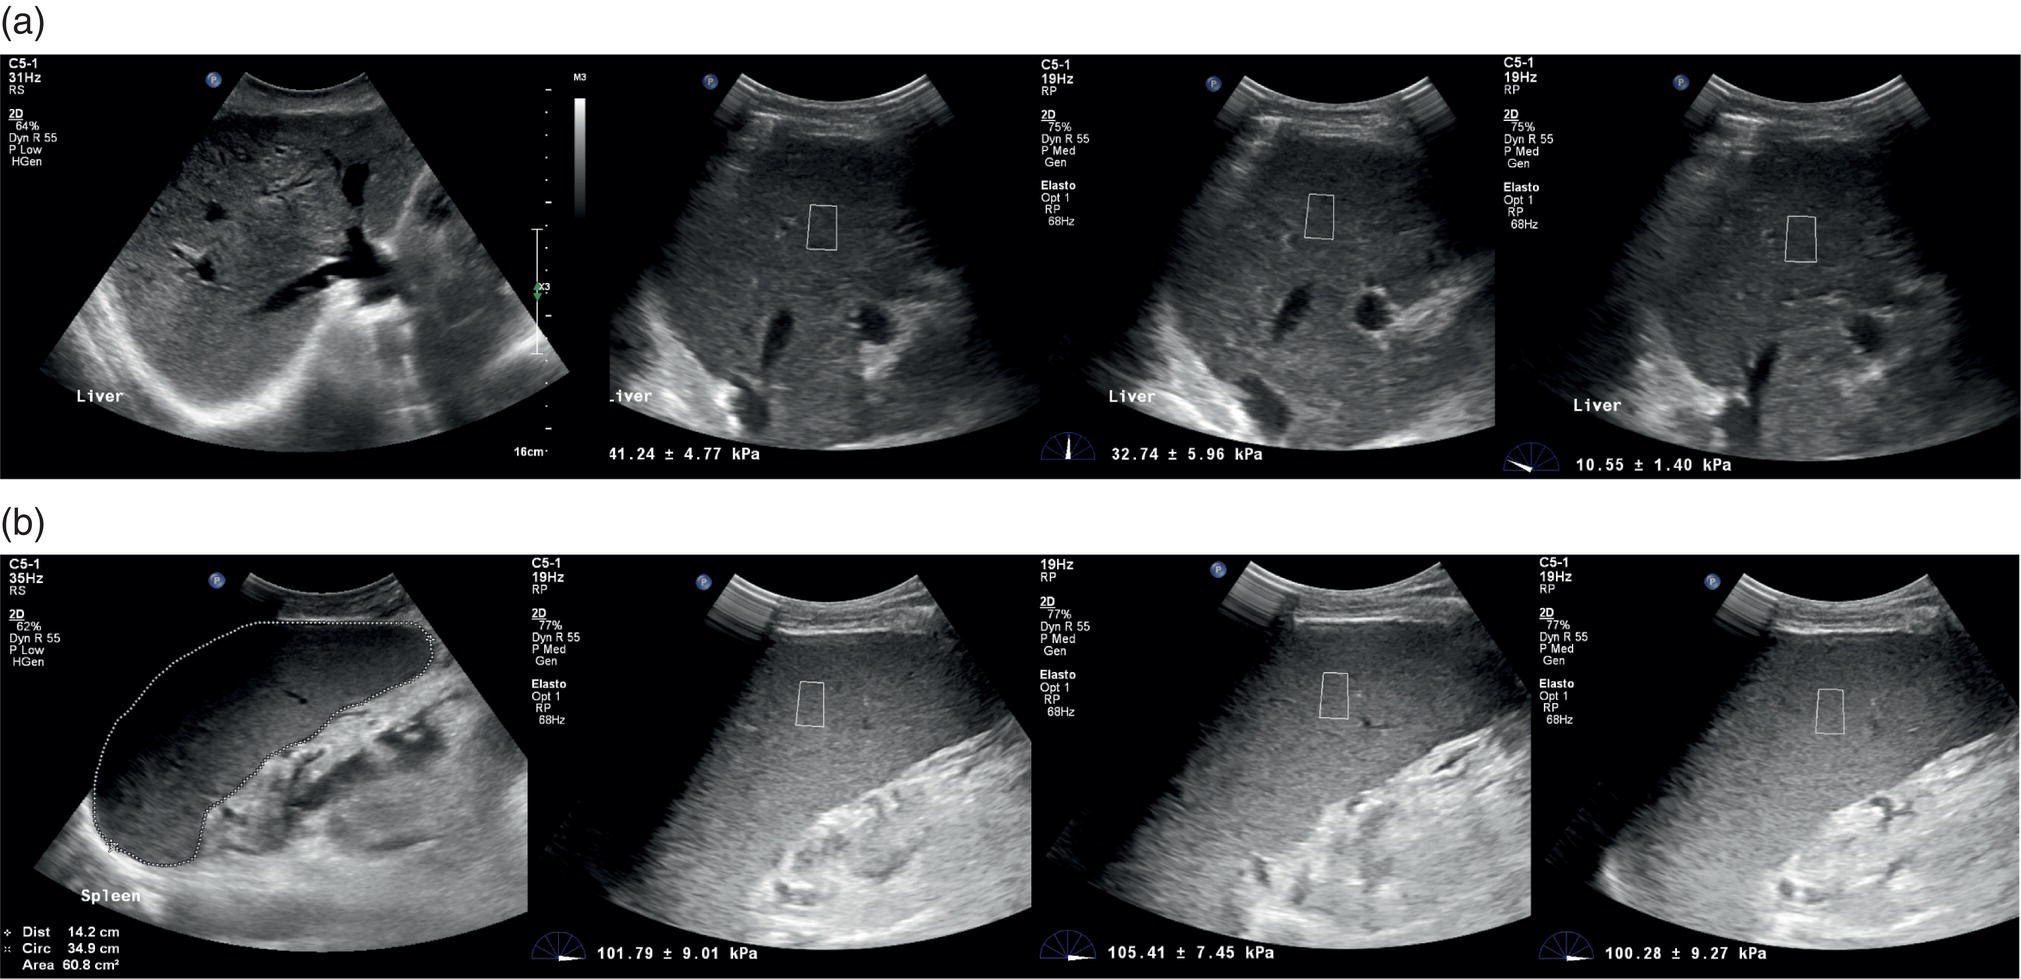
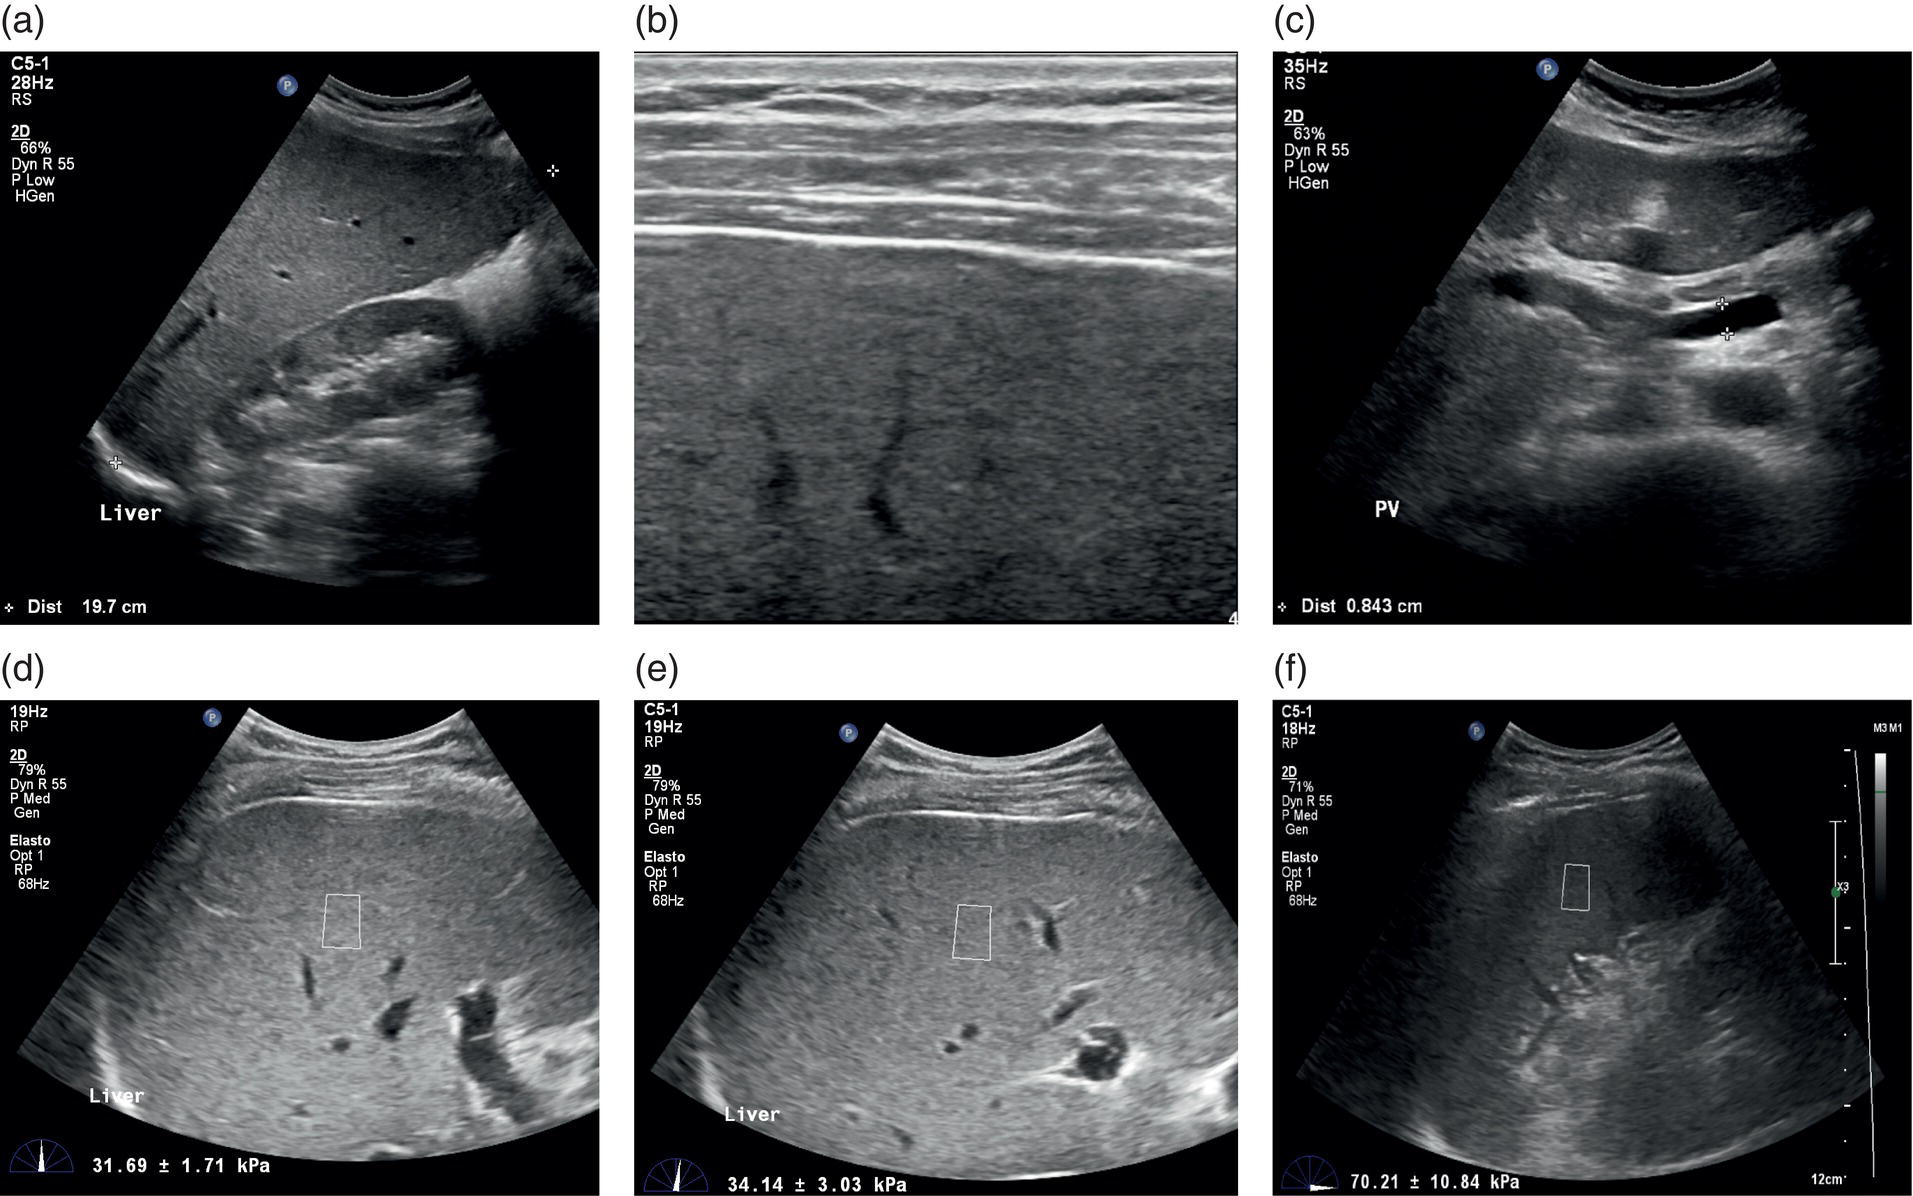
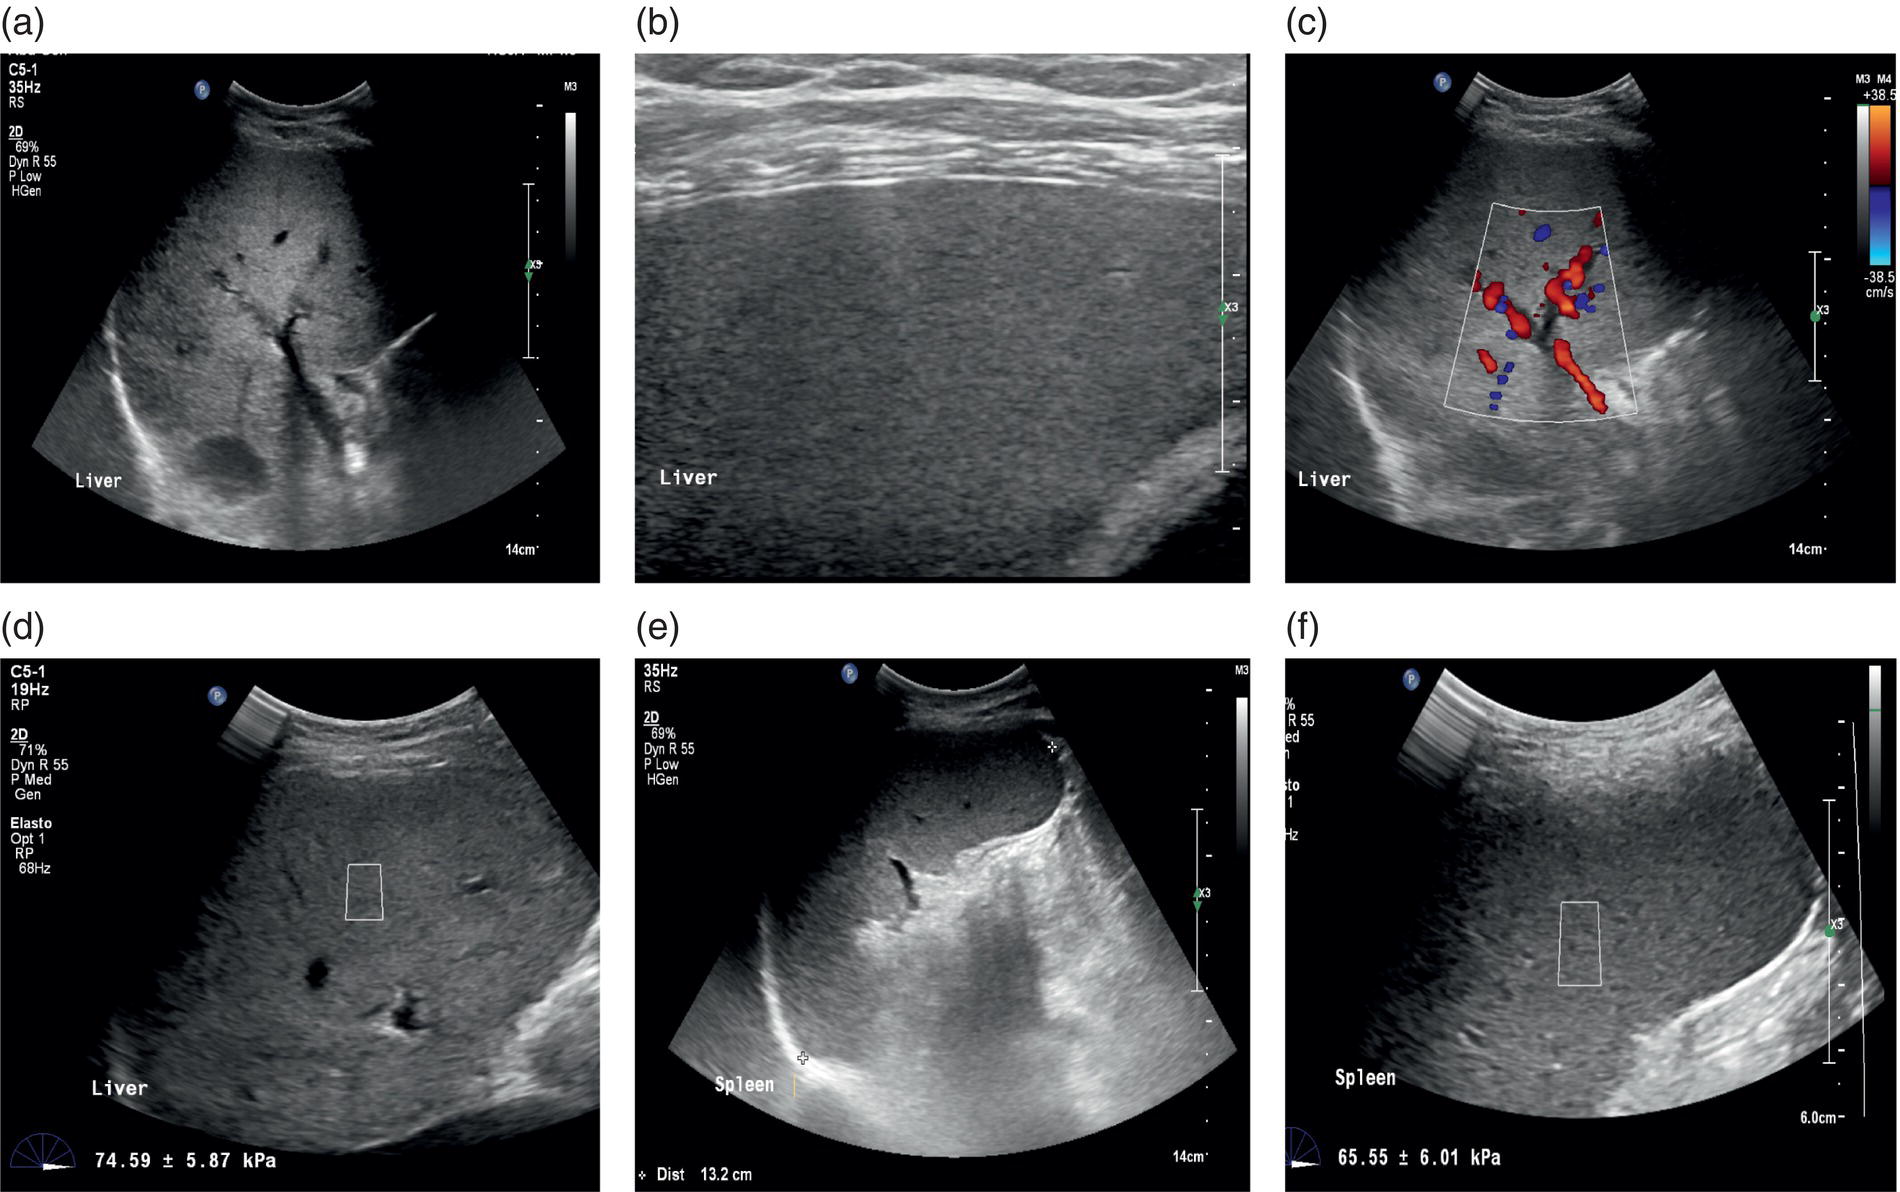
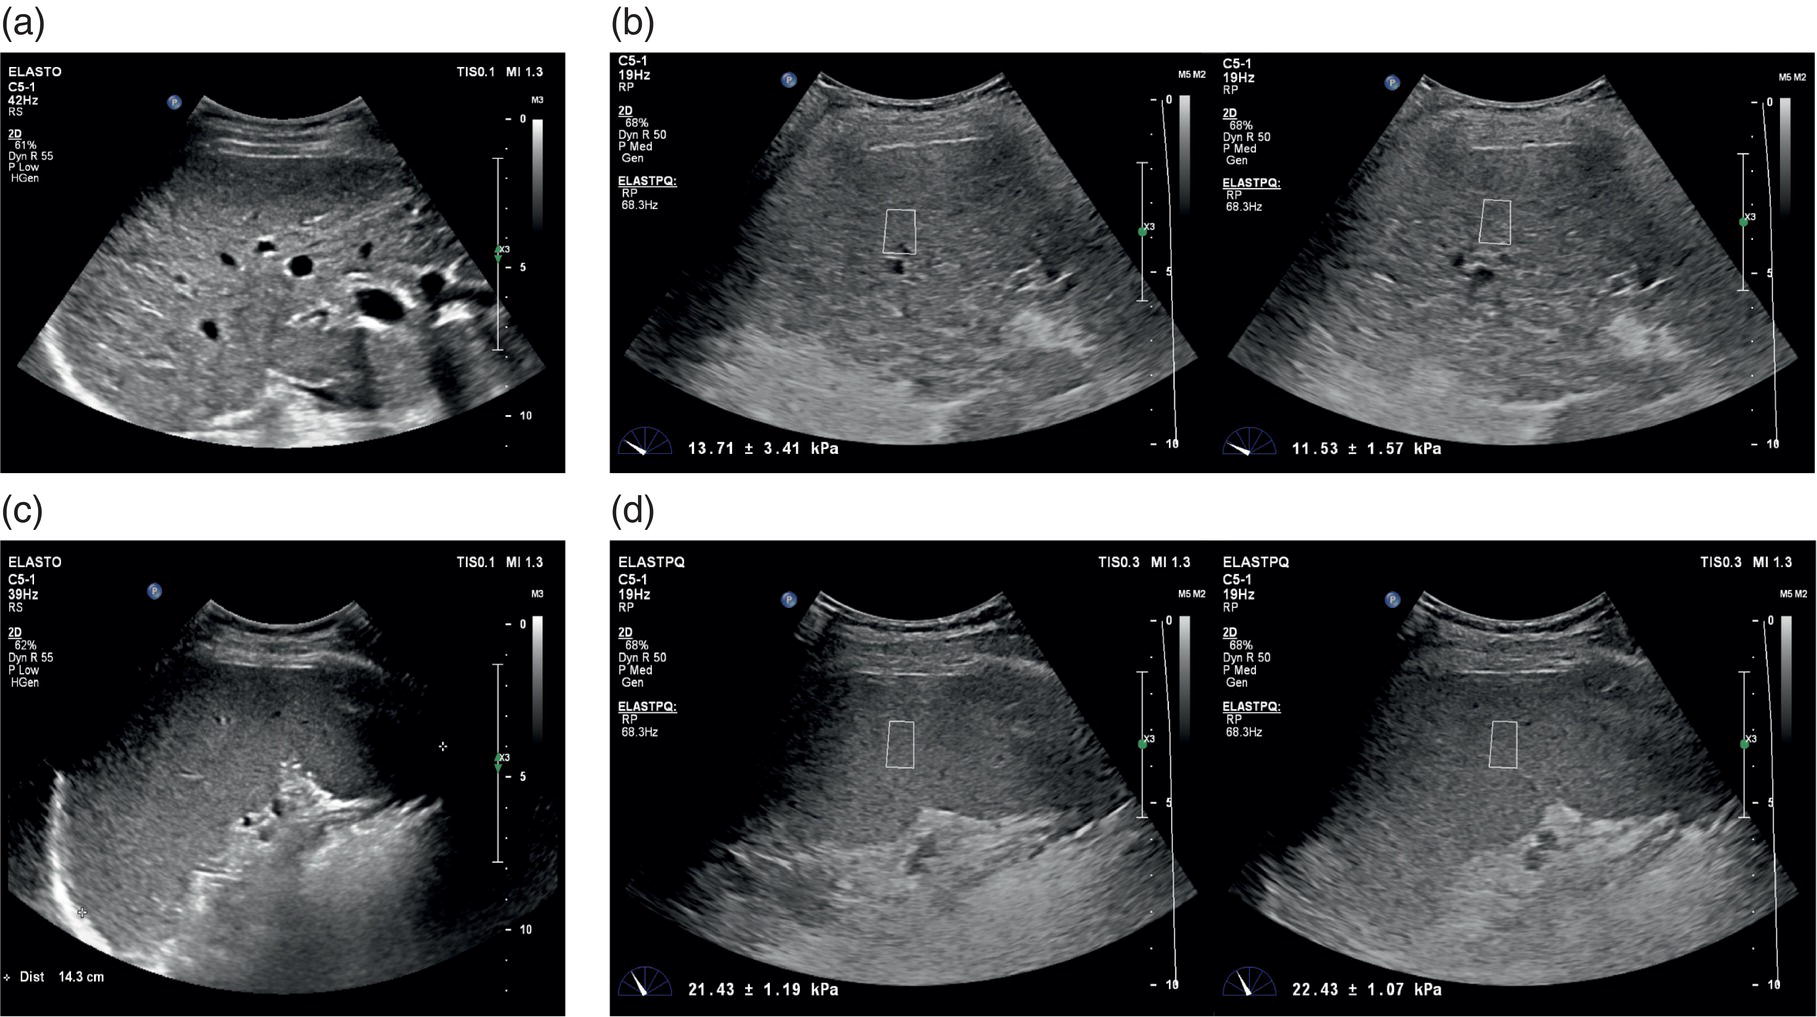
Matteo Rosselli1,2, Ioan Sporea3, and Giovanna Ferraioli4 1 Department of Internal Medicine, San Giuseppe Hospital, USL Toscana Centro, Empoli, Italy 2 Division of Medicine, Institute for Liver and Digestive Health, University College London, Royal Free Hospital, London, UK 3 Department of Gastroenterology and Hepatology, Victor Babes University of Medicine and Pharmacy, Timisoara, Romania 4 Department of Clinical, Surgical, Diagnostic and Pediatric Sciences, University of Pavia, Pavia, Italy Elastography has marked a milestone in the management of liver disease, by dramatically reducing the number of biopsies for staging purposes [1], predicting the severity of portal hypertension (PH) [2], and providing information on the risk of clinical decompensation in cirrhosis [3]. It has also proven to be a useful tool in the follow‐up of liver transplant patients [4], as well as in the paediatric population with chronic liver disease (CLD) [5]. Furthermore, the liver can be a target in systemic diseases and elastography can reveal its possible involvement. This chapter aims to provide an overview on the applications of elastography, highlighting its indications, benefits, and limitations, in line with the most recent guidelines and practical experience in various clinical scenarios. Elastography was validated by comparing liver stiffness (LS) results to the amount of fibrosis found on biopsy. According to histological staging, four different ranges of LS were defined as surrogate markers of fibrosis (F0/F1 no or low‐grade fibrosis, F2 moderate fibrosis, F3 severe fibrosis, and F4 cirrhosis). However, the diagnostic accuracy of elastography is higher in identifying no or minimal fibrosis (F0/F1), severe fibrosis or cirrhosis (F3–F4), and in general in ‘ruling in’ and ‘ruling out’ cirrhosis. The intermediate ranges of LS correlate with a continuum of moderate to severe fibrosis, in which there could be a certain degree of overlap, especially if one considers that the fibrosis scoring system traditionally follows a scale of descriptive ‘semiquantitative’ measurements, while LS is a quantitative method (Figure 9.2.1). Hence, when stiffness values fall in this ‘grey zone’ particular caution is recommended, suggesting additional tests and eventually even liver biopsy in case of ongoing diagnostic uncertainty [6]. Figure 9.2.1 Elastography is considered accurate in detecting minimal or absent fibrosis and advanced fibrosis/cirrhosis. Intermediate stages of fibrosis (F2–F3) may fall in a grey zone of low diagnostic accuracy where an overlap of values can potentially be found. The interpretation of LS results needs to take several elements into account: Figure 9.2.2 The presence of confounding factors such as cholestasis, inflammation, congestion, and hepatic infiltration increases liver stiffness (LS), leading to false‐positive results. There is no specific cut‐off level that allows discrimination of the exact impact of confounding factors on the elastography results related to possible fibrosis. Eventually, if the confounding factor can be reduced/removed, the delta stiffness value will provide information on the magnitude of the interference and the true baseline value of LS, which may or may not reveal underlying fibrosis. The figures of the ultrasound scans above the diagram represent examples of confounding factors that can lead to increased stiffness regardless of the severity of fibrosis. The undulated line represents an example of the potential stiffness variability induced by the impact of confounding factors. Figure 9.2.3 (a) B‐mode ultrasound shows features in keeping with chronic liver disease (CLD) in a 58‐year‐old woman with a suspected diagnosis of autoimmune hepatitis. Elastography shows dynamic changes of liver stiffness (LS) according to the severity/worsening and improvement of hepatic inflammation over a period of three weeks. (b) At time 0 the patient was assessed showing high LS results in keeping with cirrhosis (20 kPa). However, transaminase levels were significantly high (>500 U/L), suggesting possible interference. (c) At one week biochemistry showed further worsening of liver function tests and transaminase, with a simultaneous increase of LS (37 kPa). Liver biopsy was carried out and the patient was commenced on high‐dose steroids, with a dramatic improvement of LS (13 kPa) after just three days of immunosuppressive treatment (d). Findings in keeping with CLD secondary to autoimmune hepatitis with severe inflammatory flare and significant treatment response. Figure 9.2.5 A patient admitted to hospital with clinical and biochemical features of alcohol hepatitis and no known history of liver disease. (a) Ultrasound showed caudate lobe/right lobe ratio (CL/RL) >0.65 and initial margin retraction in keeping with chronic liver disease (CLD), but a smooth liver contour and no splenomegaly. (b) Elastography on admission revealed a liver stiffness value of 21.1 kPa (left side) and subsequent significant reduction of almost 10 kPa at one week after detoxification (right side). Features in keeping with alcohol‐induced hepatitis against the background of CLD and no signs of clinically significant portal hypertension. PH is a crucial clinical landmark in the natural history of liver disease, representing the physiopathological base of cirrhosis‐related complications [8]. Therefore once CLD is diagnosed, it is extremely important to know if the patient has cirrhosis and if the threshold of clinically significant portal hypertension (CSPH) is reached. However, it is also important to bear in mind that the timeframe between these two endpoints is difficult to define, that imaging is usually unable to assess the degree of PH, and that liver disease might clinically declare itself with a decompensating event (variceal bleeding, ascites, hepatic encephalopathy) if its severity is not predicted accurately. It is within this physiopathological landscape that elastography fills a gap of diagnostic uncertainty, in which imaging might underestimate the severity of liver disease, and in which the diagnostic gold standard would be highly invasive (hepatic venous pressure gradient [HVPG] measurement) and endoscopic screening could be carried out unnecessarily, in the absence of high‐risk varices. Robust data shows that liver elastography is able to predict the presence of both CSPH and high‐risk varices in cirrhosis with considerably high accuracy, reducing the number of unnecessary endoscopies [9, 10]. Nevertheless, a few considerations need to be kept in mind. The development of PH can be roughly distinguished in a first phase characterised by liver fibrosis and nodular regeneration, which increase intrahepatic resistances, and in a second phase related to more advanced cirrhosis, in which extrahepatic factors, mainly vasoactive molecules, influence splanchnic flow, further increasing PH. LS has a good linear correlation with HVPG until the threshold of CSPH is reached (HVPG ≥10 mmHg). Since varices develop in the presence of severe PH, with a relative increase of bleeding risk for HVPG >12 mmHg, the diagnostic accuracy of LS per se, in detecting high‐risk varices, is lower than expected [11]. The accuracy of non‐invasive assessment of PH was improved by combining LS and platelet count, as recommended by the Baveno VI Consensus Conference (and confirmed in Baveno VII), which initially proposed a vibration‐controlled transient elastography (VCTE) LS cut‐off ≤20 kPa and a platelet count ≥150 000/mm3 to rule out patients without high‐risk varices, hence who could safely avoid an endoscopic screening. These recommendations have been validated extensively with VCTE in hepatitis B (HBV) and hepatitis C (HCV)‐related cirrhosis, as well as in alcohol‐related cirrhosis, with the prerequisite of the absence of superimposed alcoholic hepatitis [9, 10]. However, even better results were obtained by measuring spleen stiffness (SS), which proved to be independently correlated to CSPH, accurately predicting the presence of high‐risk varices as well as the risk of clinical decompensation in cirrhosis [12, 13]. In other terms, when the threshold of CSPH is reached significant variability can be found among LS values, although the integration with platelet count increases the diagnostic accuracy of diagnosing CSPH. Nevertheless, SS has a stronger, progressive, and independent correlation with the severity of PH (Figure 9.2.6). The rationale behind the higher accuracy of SS compared to LS in predicting severe PH is thought to be secondary to the following reasons: Figure 9.2.6 Two schematic diagrams that summarise the trend of (a) liver stiffness (LS) and (b) spleen stiffness (SS) in relation to different degrees of fibrosis and clinically significant portal hypertension (CSPH) in cirrhosis. (a) LS increases progressively together with the severity of fibrosis with a good correlation until the threshold of CSPH is reached (arrow). Beyond this point (≥10mmHg) the correlation is lower owing to increased variability with relatively low values of LS, or very high ones likely secondary to liver parenchymal irregularities. (b) SS is higher than LS in basal conditions and remains stable or slightly higher when severe fibrosis/cirrhosis is reached. However, it is only in the presence of CSPH (arrow) that SS increases significantly, showing a very good correlation with the severity of portal hypertension. In b the values of portal pressure 1‐5 mmHg are related to fibrosis in the abscence of portal hypertension; the values 6‐9 mmHg instead refer to cirrhosis without CSPH, while values ≥10 mmHg refer to CSPH. PP = portal pressure. Ultrasound can detect parenchymal changes of CLD expressed as echotexture heterogeneity and irregular outline. In general, its specificity is high for advanced stages of CLD, where clear modification of liver morphology, signs of PH, and clinical decompensation are more obvious, but its sensitivity is low, especially in the pre‐cirrhotic and early stages of cirrhosis. Figure 9.2.7 Two cases of primary biliary cholangitis–related chronic liver disease. (a) Liver stiffness (LS) measured by point shear wave elastography reveals high stiffness results, which however are very variable secondary to the uneven surface of the liver parenchyma. (b) Nodularities and heterogeneity of the liver parenchyma are even more pronounced in the second case, which is an example of advanced cirrhosis in which LS results are lower than expected. Figure 9.2.8 Patient with primary biliary cholangitis with a heterogeneous liver echostructure and high liver stiffness (LS) variability (a). There is evidence of homogeneous splenomegaly (bipolar diameter of 14.2 cm; area 60.8 cm2), with very high but low‐variability stiffness values (b). An example of the higher accuracy of spleen stiffness in predicting clinically significant portal hypertension compared to LS. Figure 9.2.9 (a) Heterogeneous liver echotexture with irregular outline and (b) homogeneous splenomegaly. Features highly suspicious for CLD complicated by clinically significant portal hypertension. Elastography shows almost normal liver stiffness results despite obvious parenchymal irregularities (a, right side) and increased spleen stiffness (b, right side) in keeping with non‐cirrhotic portal hypertension. Liver biopsy revealed features compatible with porto‐sinusoidal vascular disorder (See Chapter 11). However, it is of note that despite the severity of liver disease, underlying aetiology might influence liver appearance, sometimes showing pronounced parenchymal heterogeneity in pre‐cirrhosis, or a relatively smooth outline and homogeneous echotexture when cirrhosis is already established. Similarly, ultrasound cannot establish the degree of PH unless clear signs of its presence can be seen, such as portal venous flow inversion and portal‐systemic vascular collaterals. In fact, even in the presence of splenomegaly, dilated portal vein, and morphological changes, which suggest advanced cirrhosis, the chance of significant PH is high, but the accuracy of staging it is insufficient. On the other hand, ultrasound is extremely useful for revealing features that suggest the diagnosis of non‐cirrhotic PH, such as portal vein thrombosis, periportal fibrosis, or rarer causes associated to haematological malignancies or parasitic infections. Therefore, while ultrasound is fundamental for revealing liver appearance, spleen size, and splanchnic circulation, elastography is able to overcome imaging limitations by objectively estimating both fibrosis and PH. The most accurate results of non‐invasive assessment therefore require the integration of both ultrasound and elastography (Figures 9.2.10–9.2.16). Figure 9.2.10 Patient with chronic liver disease (CLD) secondary to hepatitis C virus. (a) The liver seems to have an almost homogeneous echotexture. However a futher look with a high frequency transducer (b) highlights parenchymal heterogeneicity. (c) The portal vein is not dilated. Nontheless liver stiffness (d, e) is significantly increased at >30 kPa and the spleen (f), that is not enlarged, has a stiffness of 70 kPa in keeping with clinically significant portal hypertension. This is a case in which there are some ultrasound features of CLD but the appearance clearely underestimates its severity which instead is revealed by elastography. Figure 9.2.11 48 year‐old women with alcohol‐related chronic liver disease (CLD). (a) B‐mode US shows a steatotic looking liver with (b) a homogeneous echotexture and a smooth outline. (c) Colour Doppler showed arterialisation of liver parenchyma as a result of arterial buffering against portal venous flow inversion (subtle blu signals on colour Doppler adjacent to the red arterial ones). (d) Liver stiffness is very high at 74 kPa. (e) The spleen is almost normal in size (bipolar diameter 13.2 cm), however (f) its stiffness is signifincantly increased at 65 kPa. In this csase B‐mode features clearly underestimated the severity of liver disease, colour Doppler suggested significant portal hypertension, elastography suppports the definitive diagnosis of advanced CLD complicated by clinically significant portal hypertension (elastography assessment of a case presented in Chapter 8, Figure 8.26). Figure 9.2.12 40 year‐old patient with autoimmune hepatitis. (a) The liver has a heterogeneous echotexture although the outline is quite smooth. (b) liver stiffness is increased compatibly with F3‐F4 fibrosis. (c) Note is made of moderate splenomegaly. (d) Spleen stiffness is relatively low. Features are compatible with chronic liver disease with no signs of clinically significant portal hypertension. Figure 9.2.13 Non‐alcoholic steatohepatitis‐related chronic liver disease. (a) The liver has a grossly heterogeneous echotexture and it is significantly increased in stiffness (a, right side). (b) There is homogeneous splenomegaly that has high stiffness values (b, right side). B‐mode appearance is compatible with advanced cirrhosis and portal hypertension that is confirmed by the elastography results. Figure 9.2.14 A 60 year‐old woman with primary biliary cholangitis (PBC). (a) The liver has a pronounced heterogeneous echotexture; (b) the outline is smooth; (c) the spleen is normal in size. (d) Liver stiffness is just slightly increased showing a clear discrepancy between the appearance of the liver and the elastography results. PBC can be characterised by an ‘early’ heterogeneicity of liver parenchyma. Figure 9.2.15
9.2
Shear Wave Elastography for Liver Disease: Part 2
Clinical Use and Interpretation of Shear Wave Elastography in Liver Disease
Elastography Assessment of Liver Fibrosis
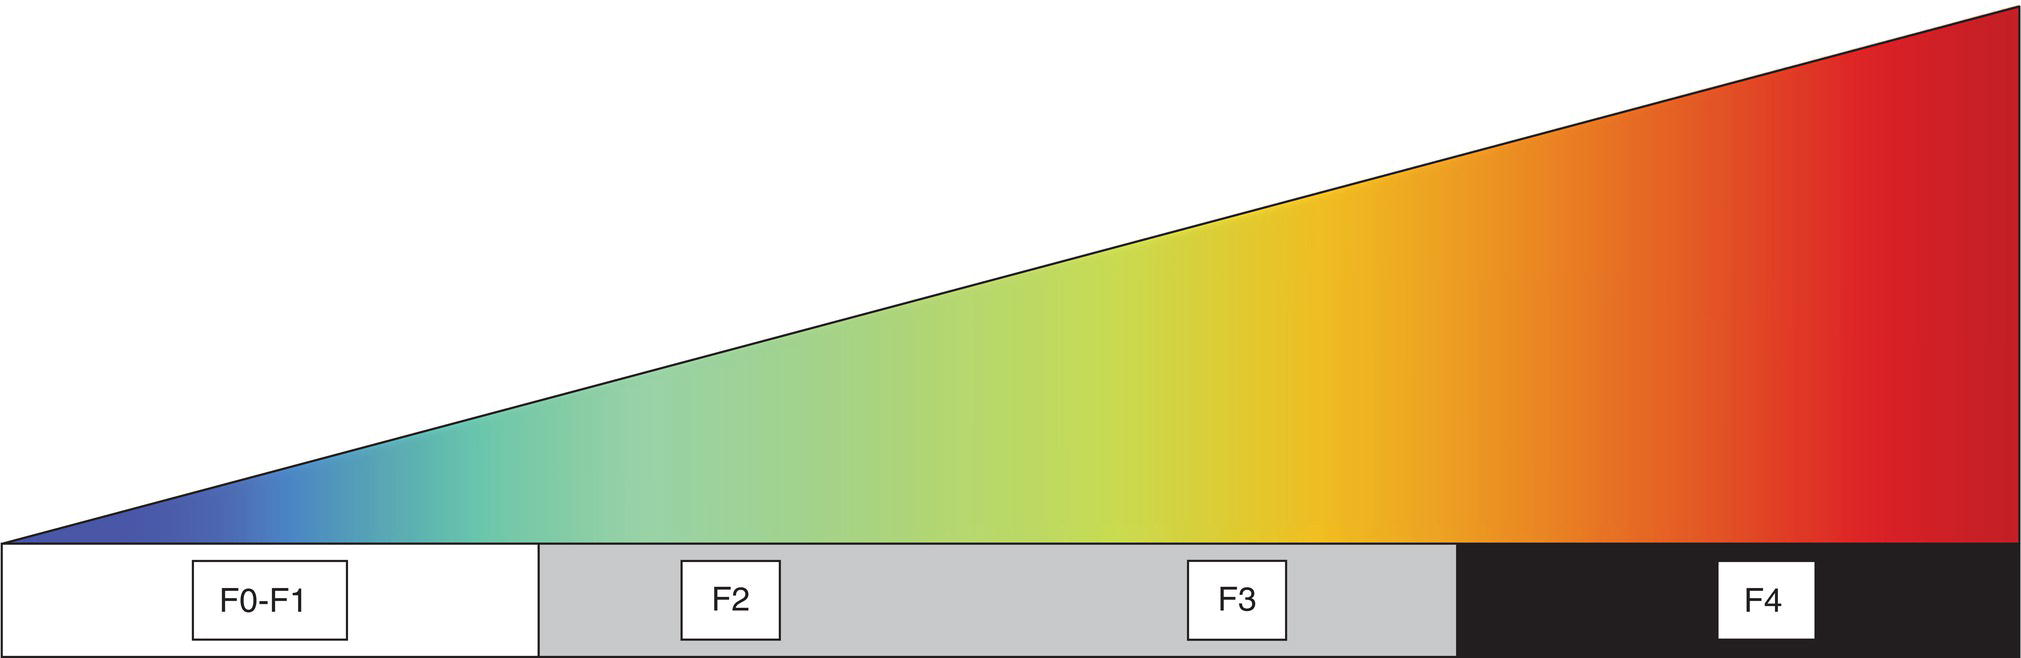

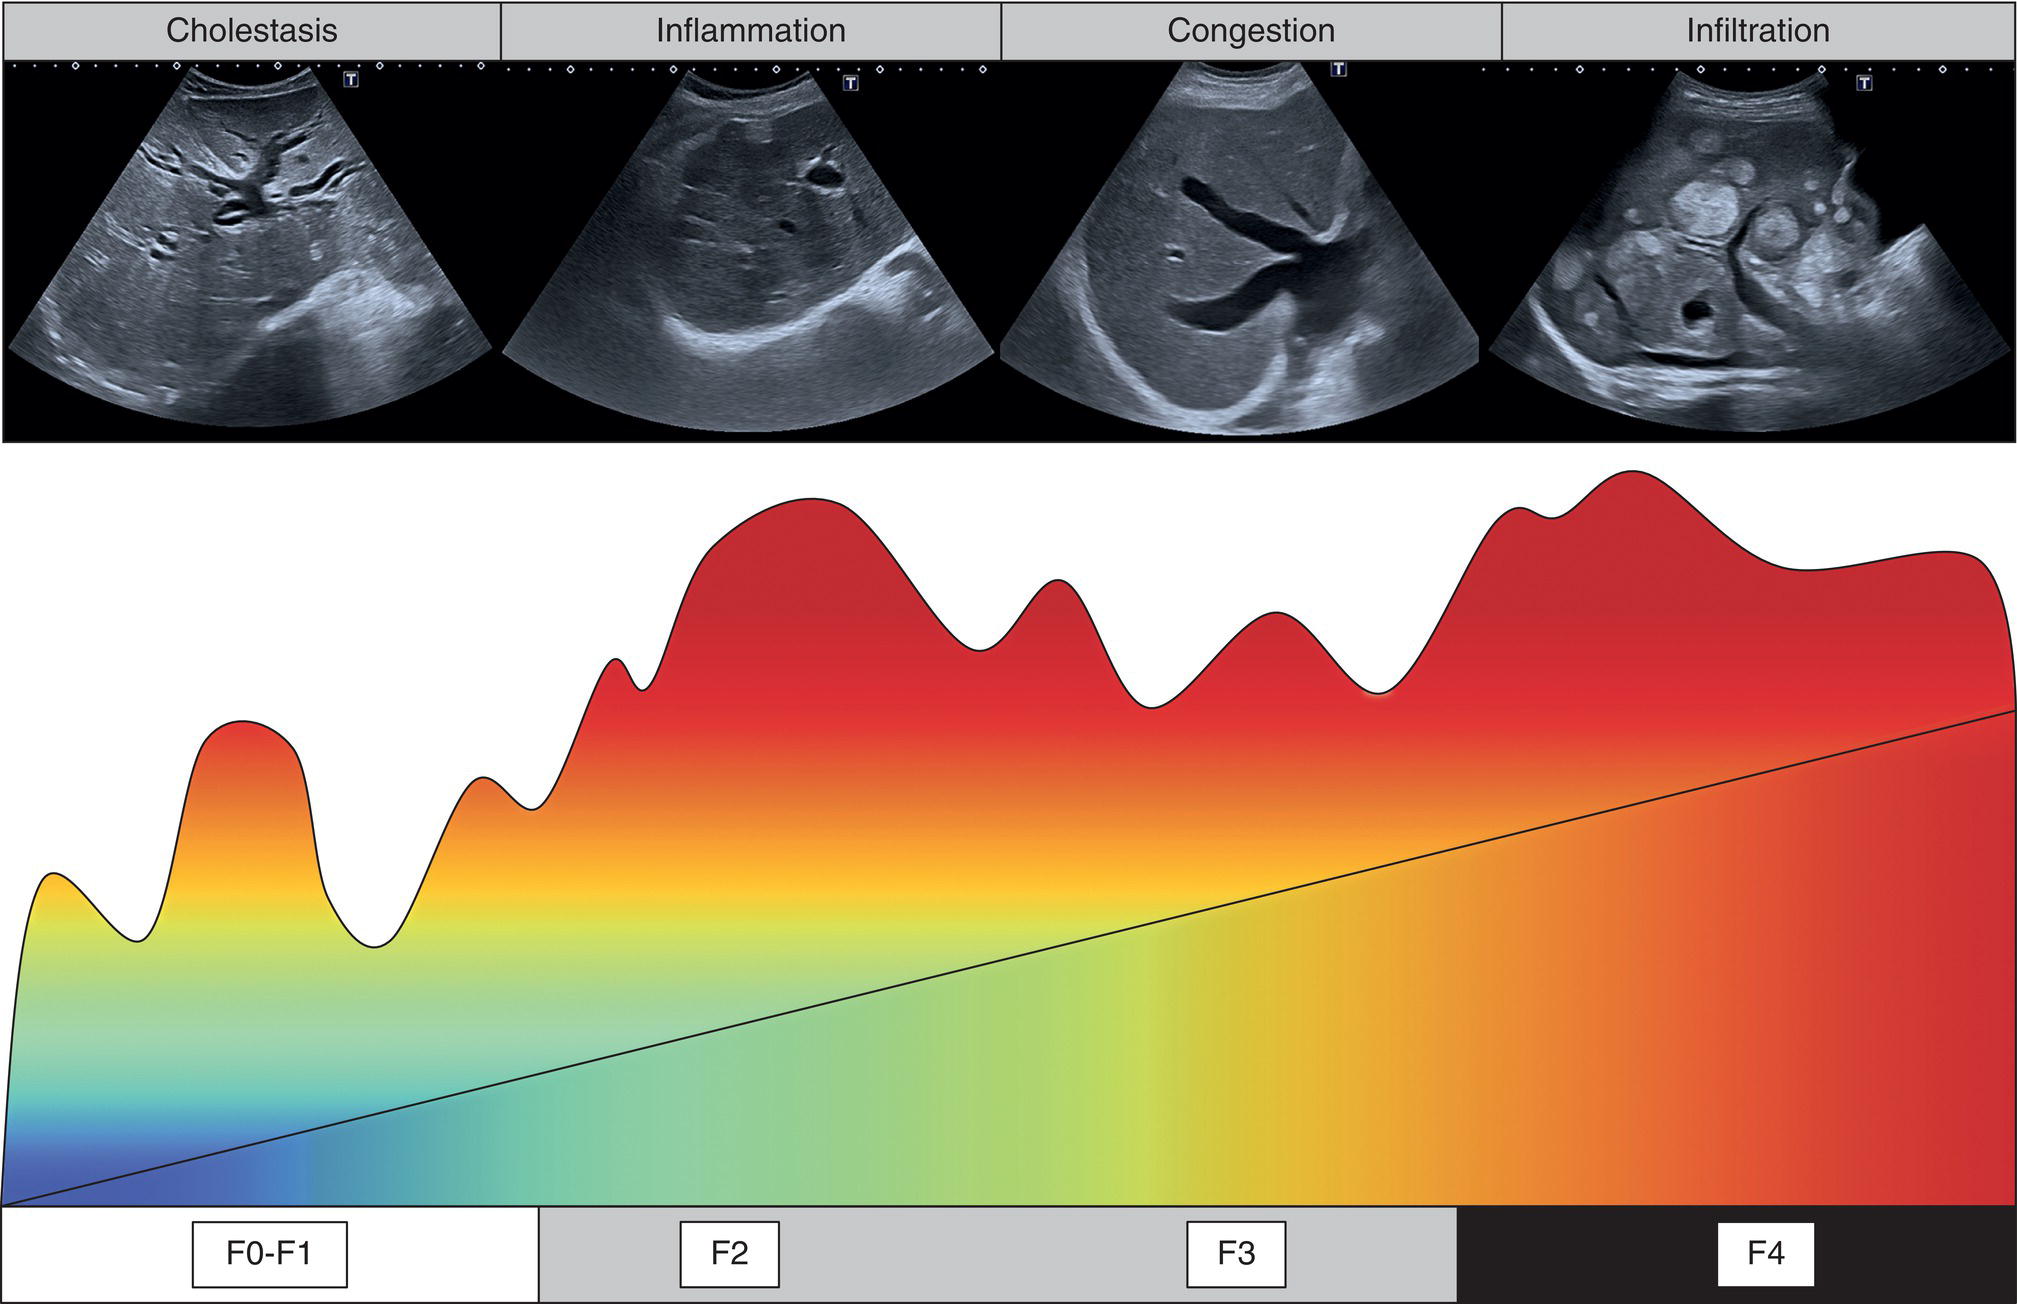
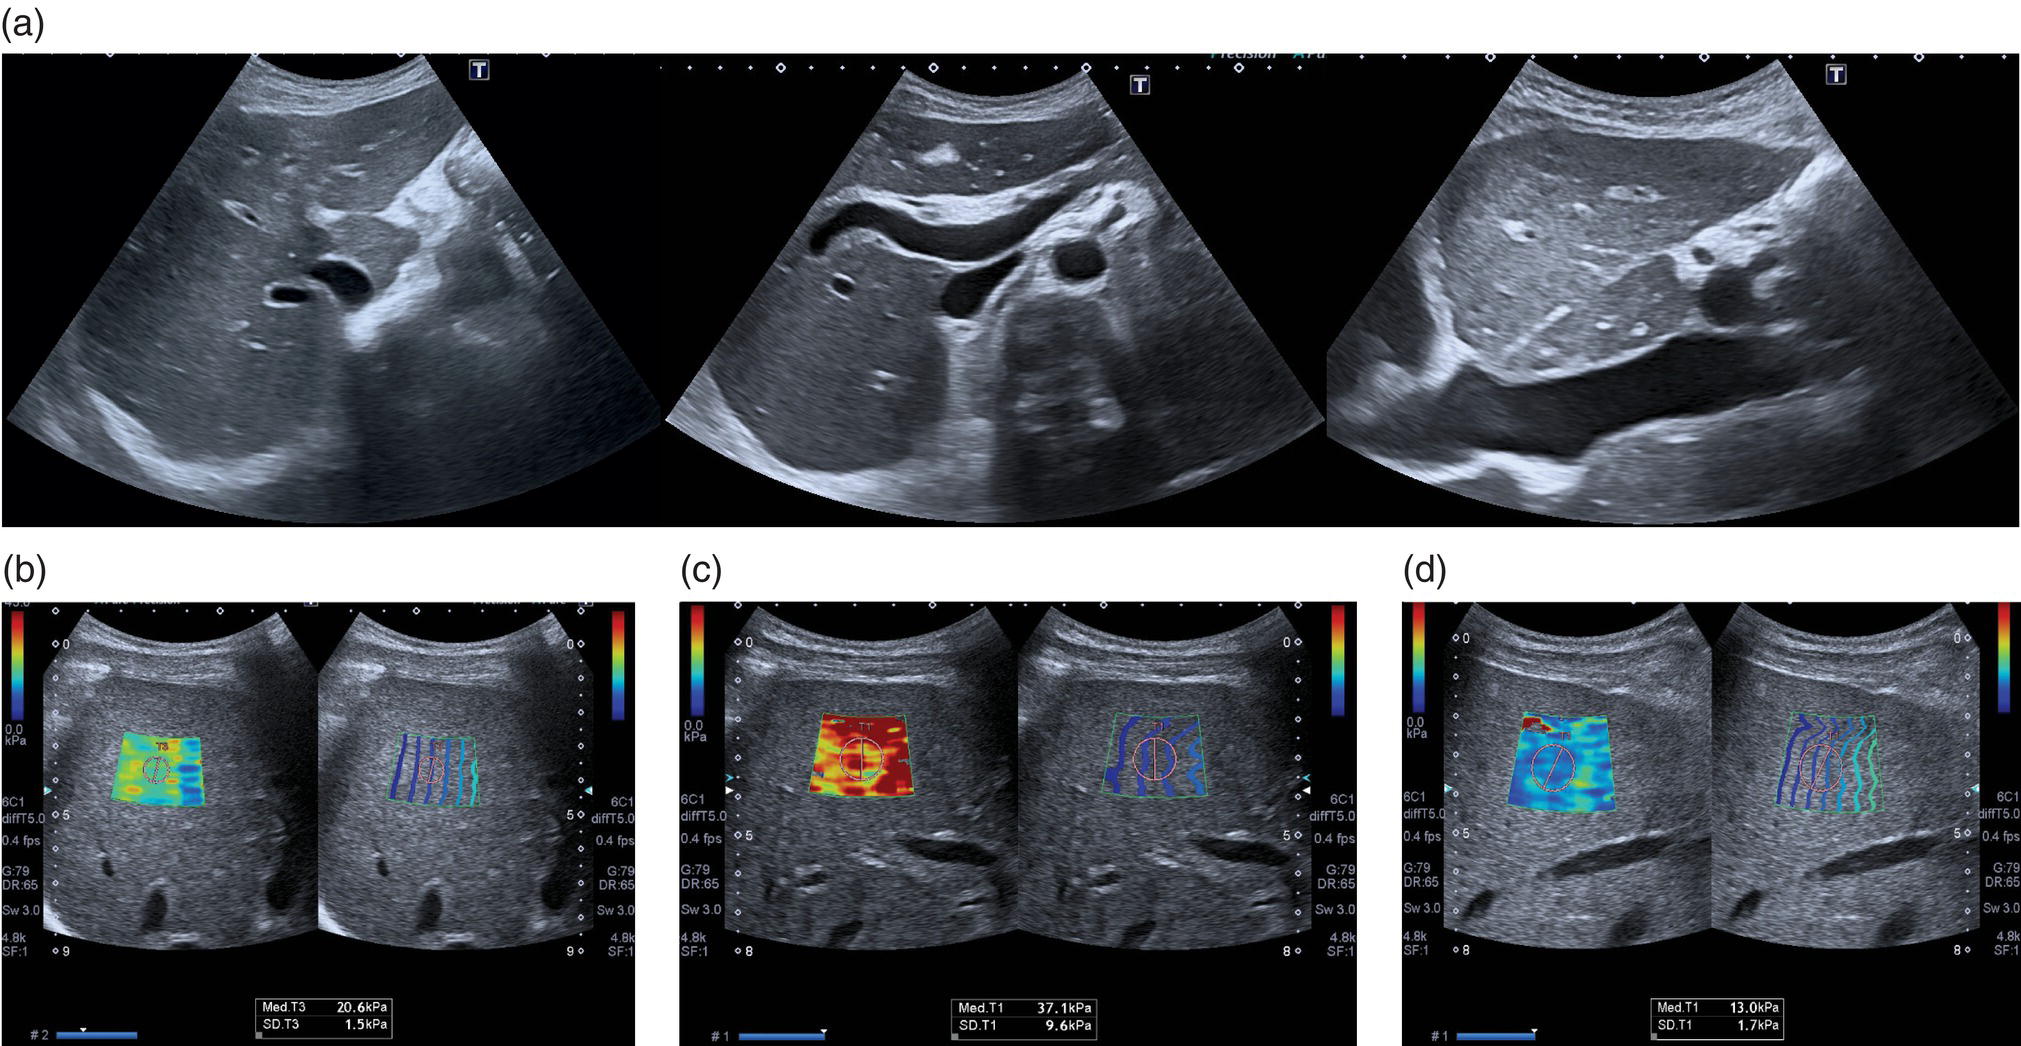
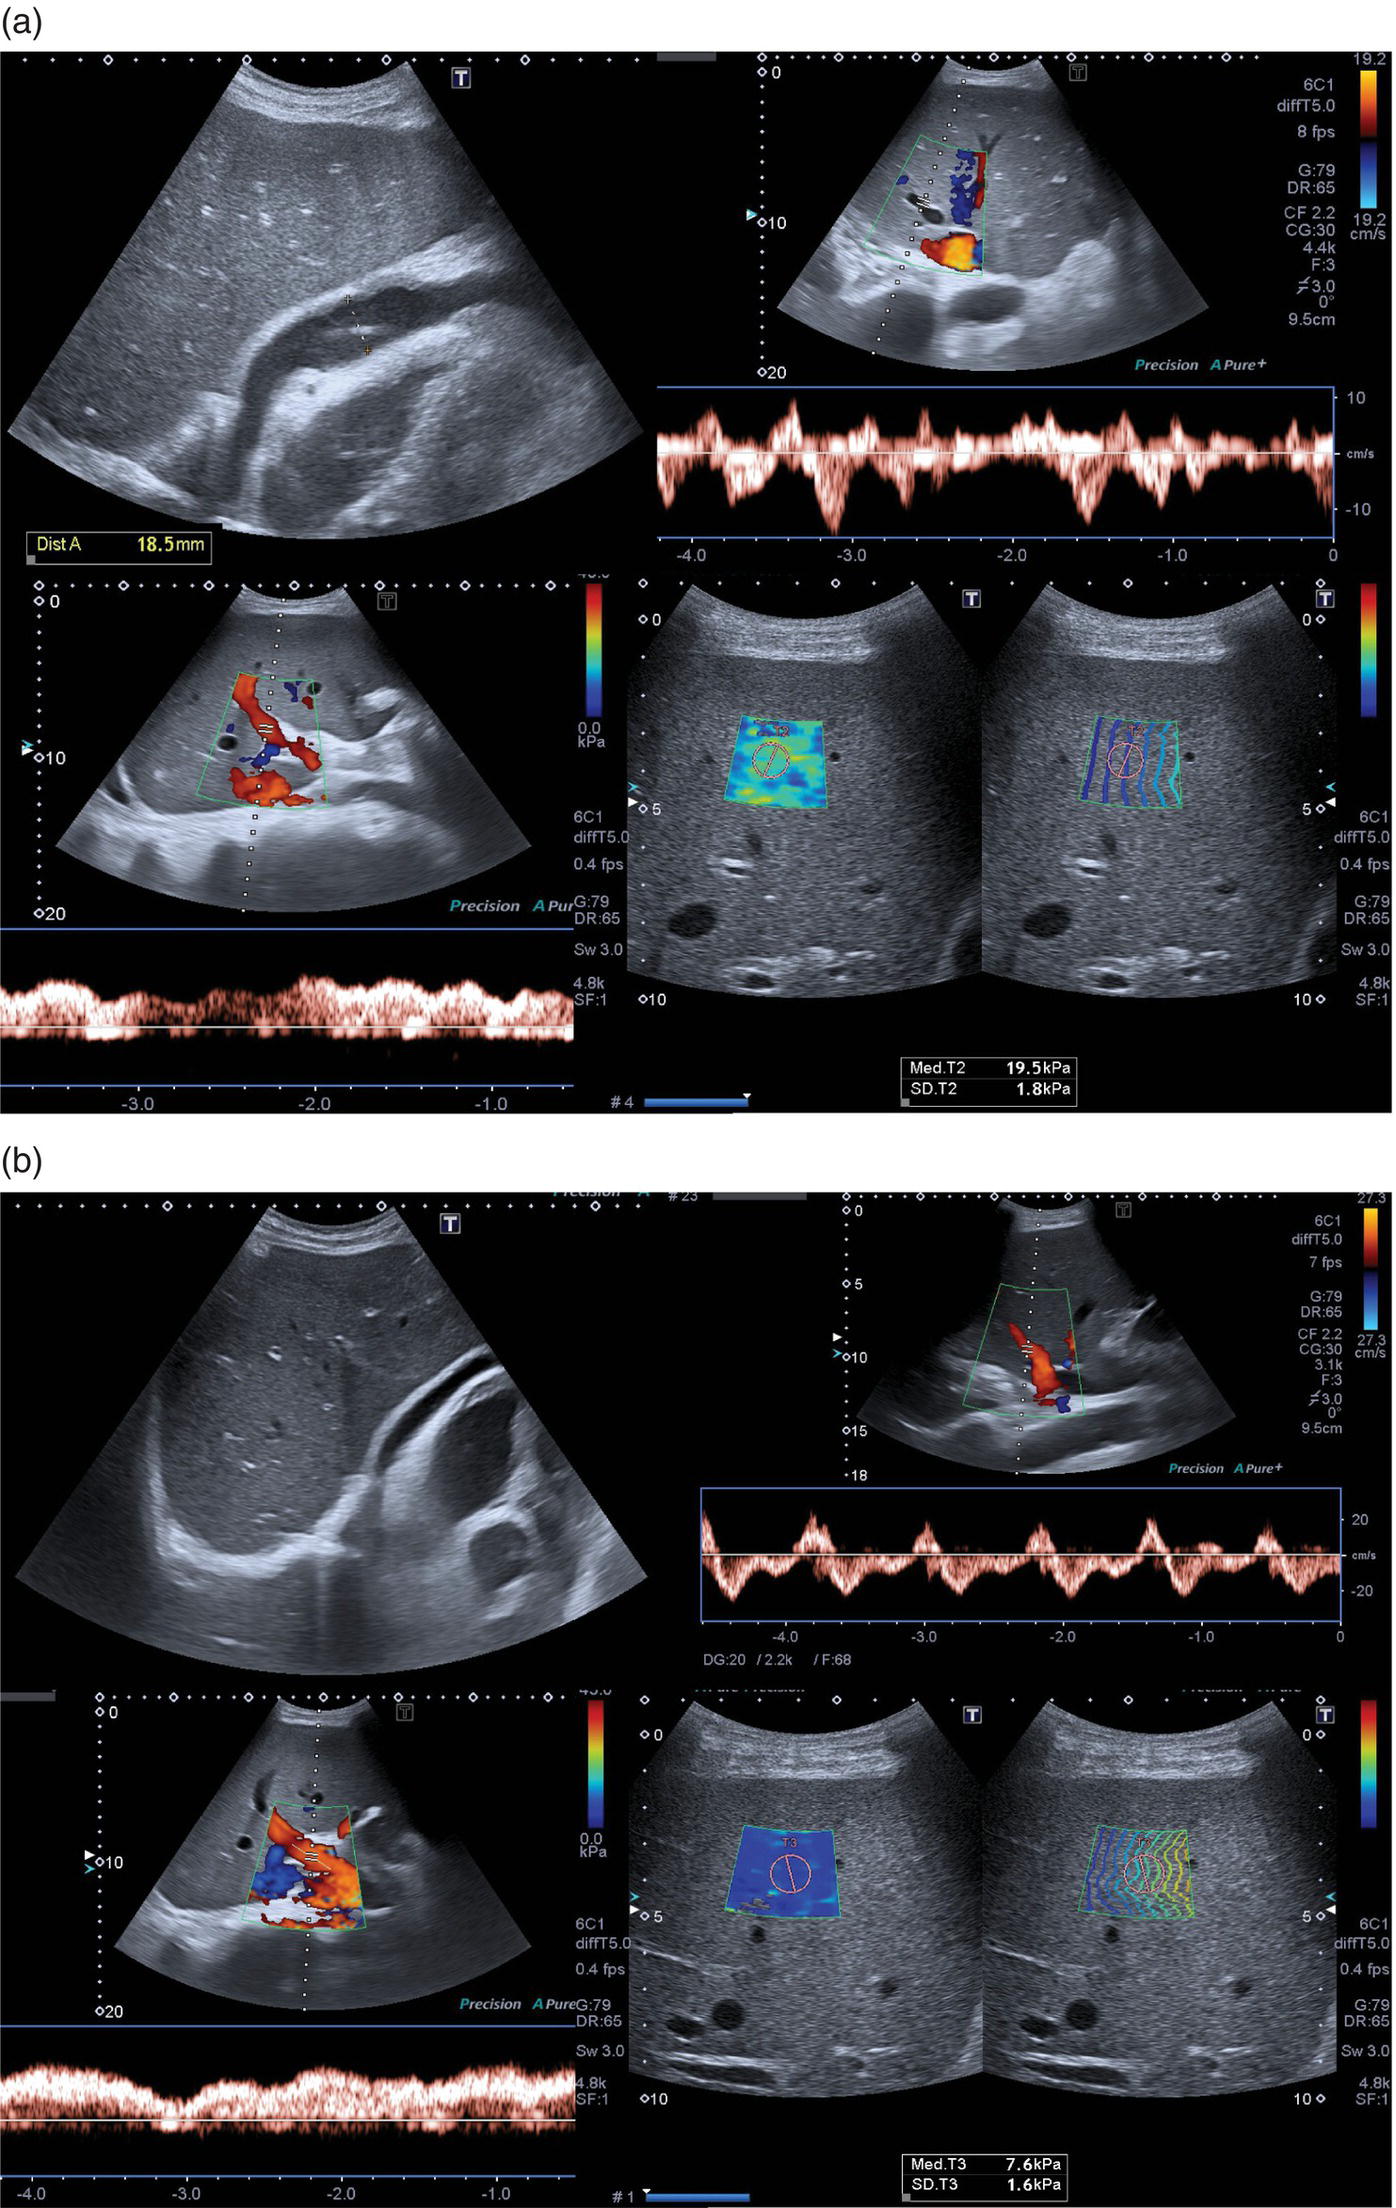
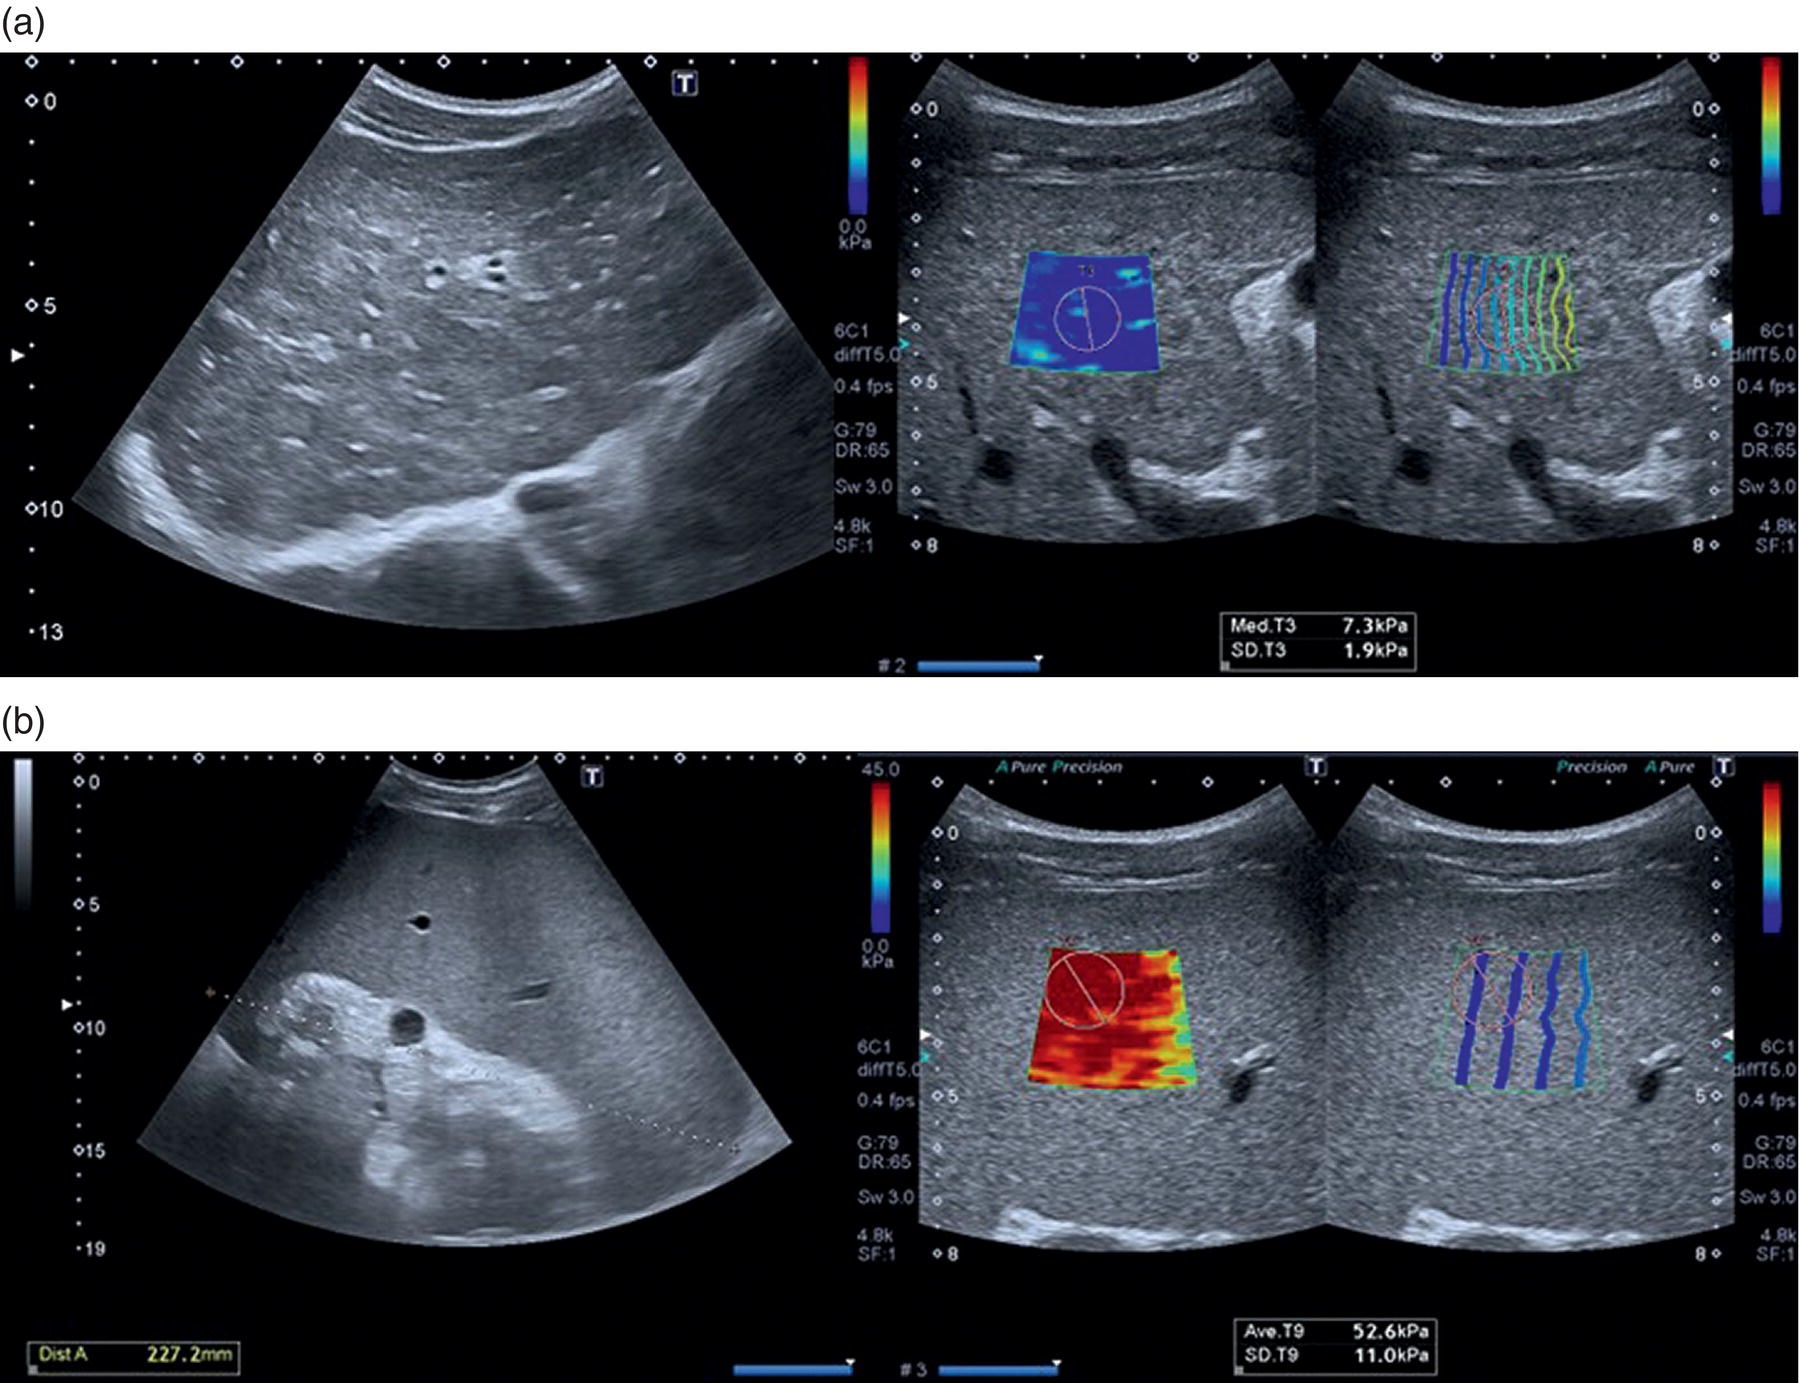
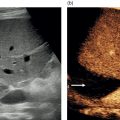
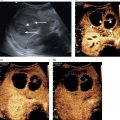
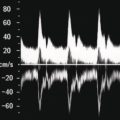
 Figure 9.2.4 Patient with polyserositis complicated by pericardial effusion and severe hypotension. (a) At presentation the patient was severely hypotensive with an arterial pressure of 70/40 mmHg, clinically dehydrated, in atrial fibrillation, and with an almost 2 cm pericardial effusion, which caused hepatic congestion secondary to dynamic cardiac outflow obstruction (Video 9.2.1). There was pulsatile portal venous flow and deranged spectral waveform of the hepatic veins. Liver stiffness (LS) was significantly increased (19.5 kPa) and there was no clear sign of chronic liver disease on B‐mode ultrasound. (b) After large‐volume fluid infusion and anti‐inflammatory treatment, there was significant reduction of the pericardial effusion, with consequent improvement of heart rate and venous return recruitment (Video 9.2.2). Haemodynamic improvement was accompanied by an almost complete normalisation of LS, as shown by 2D shear wave elastography (7.6 kPa).
Elastography Assessment of Portal Hypertension
Physiopathological Background of Cirrhotic Portal Hypertension and Non‐invasive Assessment
Non‐invasive Liver Disease Assessment and the Importance of Integrating Elastography with Ultrasound Imaging
Related posts:
![]()
Stay updated, free articles. Join our Telegram channel


Full access? Get Clinical Tree


