Computed tomography is the first-line modality for evaluation of chest diseases primarily because of its spatial resolution. Magnetic resonance (MR) imaging is used as a problem-solving tool to answer key questions that are vital to optimal patient management. MR has the potential to provide qualitative, quantitative, anatomic, and functional information without the use of ionizing radiation or nephrotoxic contrast administration. With new advances in proton MR techniques, MR imaging can overcome some of the inherent problems associated with imaging the lung. This article describes novel MR applications for evaluation of the pleura and pleural diseases.
Key points
- •
Optimizing current magnetic resonance (MR) protocols provide more efficient and valuable MR applications and potentially help identify imaging biomarkers that can be predictive and prognostic.
- •
Diffusion-weighted (DW) and perfusion imaging are emerging techniques and can provide complementary information, which can be used in evaluation and management of pleural diseases.
- •
MR imaging continues to play a vital role is assessing suitability for surgical resection and continues to be superior to other cross-sectional modalities.
Introduction
MR imaging is an excellent modality for differentiating benign from malignant pleural diseases. Owing to better soft-tissue contrast and higher intrinsic flow sensitivity, it is superior to computed tomography (CT) and fluorodeoxyglucose (FDG) PET-CT. MR imaging plays a vital role in determining resectability of primary and secondary pleural tumors, especially malignant pleural mesothelioma (MPM), and is superior to other cross-sectional imaging modalities in evaluating invasion of the chest wall, diaphragm, heart, vessels, airways, and other critical structures. Optimizing standard MR imaging sequences to reduce susceptibility and improve spatial and temporal resolution can improve the sensitivity and specificity of imaging findings and help in surgical planning and response assessment.
Even though the differential diagnosis of pleural diseases is limited and the lesions are easy to biopsy, the diagnostic yield of biopsies is low and more invasive procedures are often needed to make a diagnosis. A variety of MR imaging techniques can help differentiate benign from malignant diseases and guide biopsy, thus improving the yield and diagnostic accuracy. Although CT is the mainstay of chest imaging and has good sensitivity and specificity, MR imaging and PET seem to have higher accuracy. MR imaging has the added benefit of being an excellent aid in determining surgical resectability of tumors without irradiation.
Pathologic pleural involvement ranges from pleural effusions to pleural thickening and masses, both due to primary chest processes or secondary to a disease outside the thorax. CT remains the gold standard imaging modality in chest, as it provides exquisite resolution of the anatomic structures of the lungs and airways, has fast acquisition times, and does not require complex planning or postprocessing to extract the desired information. MR imaging has been advocated as a powerful adjunctive tool and can provide complementary information when assessing pleural pathology.
In the past, the proton-poor environment in the chest, rapid signal dephasing, and respiratory and cardiac motion presented significant obstacles for widespread adoption and clinical use of MR imaging in evaluation of noncardiac chest diseases. Advances in pulmonary MR imaging methods, optimization of MR protocols, and individualization of pulse sequences for the clinical question at hand have increased the utilization of MR in evaluation of the pleural abnormalities in recent times. The future of chest MR imaging will include a greater emphasis on quantitative imaging. This article provides comprehensive information regarding the utility and applicability of novel MR imaging techniques for evaluation of pleural diseases.
MR imaging pleural protocols
MR protocols comprise sequences designed for both anatomic and functional imaging, thus allowing a comprehensive evaluation of chest tumors and pathologies in a single examination. Pulse sequences, imaging planes, and parameters such as slice thickness and interslice gap are specified according to the anatomic range being imaged and the study objectives. T1-weighted (T1W) images are known for their excellent anatomic resolution and ability to resolve and differentiate between the pleural space and extrapleural fat. T2-weighted (T2W) images allow differentiation of pleural thickening and nodularity from pleural fluid and help delineate tumor from adjacent muscle. Gadolinium administration further enhances tissue contrast and increases the conspicuity of the borders between lesions and adjacent normal structures on T1W images with fat saturation. Short tau inversion recovery (STIR) images are particularly sensitive for bone involvement by tumor or infection, denoted by fluid signal in place of normal dark to intermediate marrow signal and breach of the normal dark cortical line.
Parallel MR imaging used with sequences that allow for high temporal resolution cine imaging, such as steady state free precession, may reveal subtle invasion of mediastinal structures and the chest wall. Additional sequences that have utility in selected cases of tumor assessment include diffusion-weighted imaging (DWI) and dynamic contrast-enhanced (DCE) or perfusion MR imaging.
The authors’ clinical MR protocol for pleural tumor evaluation is performed on a 3-T whole-body system (Magnetom TIM Trio, Siemens AG, Erlangen, Germany) using the manufacturer’s body array coil for signal reception and body coil for transmission. Initial anatomic-based imaging consists of coronal and transverse T2W single-shot acquisition (half Fourier acquisition single-shot turbo spin echo [HASTE]; repetition time, 1200 milliseconds; echo time, 101 milliseconds; section thickness, 5.0 mm; interslice gap, 1.5 mm; signal averages 1; field of view [FOV],400 mm; matrix size, 320 × 224; parallel imaging factor 2) and 3-dimensional (3D) T1W volume interpolated gradient echo acquisitions (volume interpolated breath-hold examination [VIBE]; repetition time, 3.34 milliseconds; echo time, 1.26 milliseconds; section thickness, 4.0 mm; interslice gap, 0 mm; signal averages 1; FOV, 400 mm; matrix size, 320 × 256; parallel imaging factor 2) to cover the entire thoracic cavity and diaphragm using a breath-hold technique.
Diffusion-Weighted Imaging
Axial DWI scans in the authors’ institution are acquired with fat suppression using a free-breathing single-shot spin echo- echo planar imaging sequence (repetition time 5000 milliseconds, echo time 82 milliseconds, section thickness 8.0 mm, interslice gap 1.5 mm, signal averages 6, FOV 400 mm, matrix size 160 × 96, parallel imaging factor 2).
The number and range of b-values used are chosen to optimize apparent diffusion coefficient ADC calculation by providing 4 data points for calculating each ADC value while reducing intravascular water perfusion effects on b-value DW images. The total imaging time for DWI is approximately 6.5 minutes. The ADC value is calculated by a logarithmic linear fit of signal intensity versus the b values; this yields a monocompartmental fit for the raw signal intensity data. The major limitation is the lack of consensus on standardization of region of interest analysis and utilization of mean and minimal ADC values ( Table 1 ).
| Methods of ADC Calculation | Evaluation |
|---|---|
| Parametric ADC | Graphical representation of changes in ADC on a voxel-by-voxel basis |
| ADC histogram | Depiction of each voxel in multiple ROIs as a histogram |
Perfusion MR Imaging
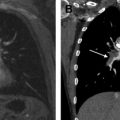
Perfusion imaging is performed using a 3D GRE based sequence (repetition time/echo time [TR/TE], 2.02/0.84 ms; flip angle, 10°; acquisition matrix, 256 × 135; slab thickness, 168–200 mm; 42–56 slice encoding; pixel spacing, 1.76–1.88 mm; scan time, 2.84–3.96 s/image). Follow-up chest radiograph obtained after treatment demonstrated internal resolution. Postprocessing and calculation of perfusion indices is performed using the Toft model ( Fig. 1 ). The area under the curve (AUC) represents the area under the plot of plasma concentration of gadolinium (not logarithm of the concentration) against time and can be used to calculate the apparent volume of distribution of gadolinium in the tissues or tumors. The AUC is often used in addition to or as an alternative to parameters derived from pharmacokinetic modeling of T1W DCE MR imaging data. AUC has been shown to be a mixed parameter that can display correlation with transfer constant ( K trans ), elimination constant ( v e ), and rate constant ( K ep ) and can have a relationship with all three ( Table 2 ). Furthermore, it has been demonstrated that AUC is not affected by vascular input function.

| MR Pharmacokinetic Parameter | Units |
|---|---|
| Transfer constant (K trans ) | min −1 |
| Rate constant (Kep) | min −1 |
| Elimination constant (Ve) | None |
Clinical applications in pleural diseases
Characterization of Pleural Pathologies
Various pleural pathologies have different imaging features as summarized in ( Table 3 ).
| Pleural Disease/Abnormality | T1W | T2W | Postcontrast | ADC Value (mm 2 /s) | Other Features and Associations |
|---|---|---|---|---|---|
| Transudate pleural effusion | Low | High | − | 3.42 ± 0.76 × 10 −3 | Absence of loculations |
| Exudative pleural effusion | Low | High | +++ | 3.18 ± 1.82 × 10 −3 | Pleural thickening, split pleura sign, loculations, modularity, internal septations |
| Chylothorax | High | Low | − | − | Signal comparable to fat, associated with lymphoma, lymphangioleiomyomatosis, and postsurgical |
| Hemothrorax | High | High | − | — | Concentric rim sign due to T1 shortening on T1W and T2W imaging |
| Pleural plaques | Low | Low | –/+ | 2.6 ± 1.82 × 10 −3 | Extrapleural fat, round atelectasis, and pleural effusion |
| Lipoma | High | Moderate to high | − | − | Fat suppression sequences are helpful |
| Liposarcoma | Low | High | +/++/+++ | − | Heterogeneous, calcifications may be present |
| Fibrous tumor of the pleura | Low | Low | +++ | — | Myxoid degeneration and calcifications can be present, pedunculated |
| Malignant fibrous tumor | Low | High | +++ | — | Lower ADC than benign fibrous tumor of the pleura |
| Synovial sarcoma | Low | Mixed | +++ | — | Triple sign, bunch of grapes appearance on T2W image |
| Pleural metastases | Low | Low/high | ++/+++ | Enhancement and morphologic characteristics similar to primary tumor | |
| Lymphoma | Low | Low | ++ | 1.23 ± 0.3 × 10 −3 | Multistation adenopathy, marrow involvement |
| Lung cancer | Low | Mixed | +++ | 2.12 ± 0.6 × 10 −3 | Pleural effusion, lung masses and adenopathy |
| Epithelial mesothelioma | Low | Low | +++ | 1.31 ± 0.15 × 10 −3 | Asbestos exposure, circumferential tumor, pleural effusion |
| Sarcomatoid mesothelioma | Low | Mixed | +++ | 0.99 ± 0.07 × 10 −3 | Circumferential tumor, pleural effusion, pleural masses, chest wall invasion |
Related posts:

Stay updated, free articles. Join our Telegram channel

Full access? Get Clinical Tree


