Fig. 1.
Septal curvature measurements: (A) Points tracked in short-axis images for measurement of septal curvature: midpoints of septum (S) and LVFW (L), and anterior (J1) and inferior (J2) LV/RV junction points. (B) Geometric method for calculation of location of center and radius of circle through three points. Distance between endocardial septal mid-point (S) and the endocardial LVFW mid-point (L) was defined as the septum-lateral wall distance (SLWD).
2 Methods
2.1 Magnetic Resonance Imaging
Two patients with QRS duration > 120 ms and LBBB ECG morphology, one of them with SF, were retrospectively selected. Presence of SF was based on visually inspection of four chamber MRI images, obtained by a Siemens 1.5 T system (Avanto, Siemens Medical Systems, Germany). No scar tissue was present based on late gadolinium enhancement images in either patient. Phase flow quantification images were acquired to determine aortic valve opening time. An MRI set of short axis images at the level of the papillary muscles was identified and used for septal curvature (Csept) and displacement measurements. The time delay between the moment of onset QRS and the acquisition of the first image was ignored. Matlab (MathWorks Inc., MA, USA) was used to select the superior and inferior RV-LV junction points at the endocardial site in the first frame (Fig. 1A: J1 and J2). The image was rotated so that the line through the junction points was perpendicular to the y-axis. Two endocardial points on the perpendicular bisector of the junction points were selected: one on the septum and one on the LVFW (Fig. 1A: S and L). Using these reference endocardial points, Csept was calculated as previously described by Dellegrottaglie et al. [7] (Fig. 1B). Briefly, two chords, connecting the mid-wall point to the superior and inferior RV-LV junction points, were defined. The intersection point of the two lines which bisects these chords perpendicularly was defined as the centroid of the circular arc segment intersecting the defined mid-wall and two junction points. Csept was defined as the inverse of the distance of the line drawn from the calculated centroid C to any point on the arc segment. The distance from mid-point of the septum to the mid-point of the LVFW (both endocardial site) along the x-axis was defined as septal-to-lateral wall distance (SLWD).
The four endocardial reference points were tracked over time using an automated-feature-tracking algorithm based on normalized cross-correlation [8]. Briefly, a 20 pixel square area surrounding the selected point in the initial view was compared to a 40 pixel square search area in the next phase. The pixel which correlated the most to the selected point in the previous frame was selected as the location of the new point. This procedure was performed for all frames, to provide measurements of septal curvature and displacement throughout the cardiac cycle.
2.2 CircAdapt Model
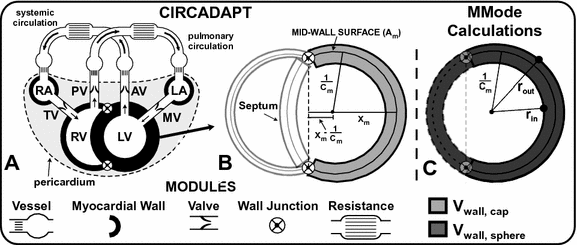
The effects of dyssynchronous activation and LVFW hypocontractility on septal motion were tested using the CircAdapt computational model of the human heart and circulation [9, 10]. CircAdapt consists of modules, representing cardiac walls, cardiac valves, large blood vessels, systemic and pulmonary peripheral vasculature, the pericardium and local cardiac tissue mechanics. The geometrically simplified LV and RV cavities of the heart in the CircAdapt model are surrounded by three spherical caps: the LVFW, RVFW and interventricular septum. The cardiac walls are surrounded by a passive elastic sheet, the pericardium. The ventricular walls are mechanically coupled at the septal junction through equilibrium of tensile forces (Fig. 2) [10].
2.3 Assessment of Septal Motion Using CircAdapt
SF was assessed in the CircAdapt model by calculating traces of curvature and SLWD, and by generating a pseudo-MMode image. Transmural pressure calculations take place on the midwall surface dividing the volume of the wall in two (Fig. 2B) [10]. The thickness of tissue on either side of the mid-wall surface depends on mid-wall curvature (Cm). For each cap, the displacement of the mid-wall surface from the septal junction (xm), the mid-wall surface area (Am), the wall volume (Vw) and Cm are known (Fig. 2B). The wall area of the entire sphere Am,s (Fig. 2C) can be calculated by:


(1)
The cap therefore takes up a proportion of the whole sphere:


(2)

Fig. 2.
(A) CircAdapt model designed as a network of modules representing atrial and ventricular cardiac walls, blood vessels, cardiac valves: AV: aortic; MV: mitral; PV: pulmonary; TV: tricuspid valve, and the pulmonary and systemic peripheral vasculatures. (B) Cross-sectional view of ventricular walls. The walls are mechanically coupled at the junction points. Cm: mid-wall curvature; xm: distance from junction plane to mid-wall. (C) rout: radius of outer wall; rin: radius of inner wall. Solid lines denote the shaded cap in panel B, dashed lines are constructed in the calculation. Panels A and B are adapted from Lumens et al. [10]
The corresponding wall volume of the entire sphere is:


(3)
Solving the following equations then gives the inner and outer radii of this sphere:


