Fig. 1
Multiple visual areas in monkey cortex and two processing streams, dorsal and ventral. Adapted from Farah et al. (1999)
Most early MEG studies of basic vision [see review by Aine and Stephen (2002)] focused on examining properties (e.g., spatial or temporal frequency tuning properties) of a single visual area (e.g., primary visual cortex or V1) or have examined the retinotopic organization of visual areas (i.e., the point-to-point projection of visual field onto cortical areas). By carefully selecting stimulus parameters (e.g., color, size, motion), it is possible to identify and characterize different visual areas in the human brain similar to the methods employed in monkey studies. More recently, visual MEG studies have examined cognitive processes such as the representation of language in the brain, as well as memory and imagery. These studies rely less on the invasive results in monkeys and more on results from other functional neuroimaging methods such as PET and functional magnetic resonance imaging (fMRI) for corroboration [See review of fMRI visual studies in Courtney and Ungerleider (1997)].
Contemporary views of higher cognitive functions (e.g., cognitive neuroscience) date back to the late 1980s which emphasize that a number of different neural systems participate in the representation of an object or event (Kosslyn 1988; Squire 1986). A paradigm shift occurred away from the predominant view at that time that feature integration relies on convergent hierarchical processing, i.e., the visual system can be viewed as a series of processing stages that represent a progressive increase in complexity of neuronal representations that are dependent upon the output of preceding stages (De Yoe et al. 1994; Van Essen 1985; Van Essen and Maunsell 1983; Zeki 1978). While no investigator would argue that serial hierarchical processing does not occur within the visual system, a new emphasis was placed on “networks” or “systems.” The earliest example of a systems approach was the overwhelming evidence for the existence of at least two functionally specialized processing streams in the visual system (e.g., “dorsal” and “ventral”—see Fig. 1) operating in parallel (De Yoe and Van Essen 1988; Merigan and Maunsell 1993; Ungerleider 1995; Ungerleider and Mishkin 1982; Van Essen and Maunsell 1983). Basically, attributes of stimuli are not believed to be stored as a unified percept in a single cortical location; but rather, appear to be stored in a distributed cortical system in which information about specific features are stored close to the regions of cortex that mediate the perception of those features (Goldman-Rakic 1988; Mesulam 1998; Ungerleider 1995). Memory retrieval, therefore, means that a cue triggers a pattern of neural activity which is the same as the one elicited during the initial processing of the retrieved material (Alvarez and Squire 1994; Damasio 1989; Fuster 2001; Mesulam 1998; Mishkin 1982; Squire and Zola-Morgan 1991; Tulving 1995; Wheeler et al. 2000). Memories essentially consist of networks ranging from simple sensory memories or cell assemblies in sensory or parasensory areas to perceptual-motor associations consisting of reciprocal long-fiber connections linking perceptual memory networks of the posterior cortex with the prefrontal motor networks (Fuster 1997). The current results demonstrating consistent networks of activity during rest (e.g., default mode network or DMN) underline this view that brain activity during rest and task related activities involve broad cortical network activation.
Prefrontal cortex (PFC) was shown to be a key player in maintaining perceptual representations during working memory tasks and providing feedback to posterior cortex, thereby biasing activity in favor of behaviorally relevant stimuli (Baylis and Rolls 1987; Fuster 1973; Goldman-Rakic 1995). In monkeys, an elevated discharge in PFC during a delay interval was the most characteristic effect of the ‘sample’ stimulus (during encoding) on prefrontal cells suggesting that short-term memory basically consists of the continued facilitation of neural activity in cerebral structures recently engaged in sensory processing (Fuster 1973; Fuster and Jervey 1981; Miller et al. 1991; Richmond et al. 1983; Wilson et al. 1993). The monkey studies also showed that cooling of either PFC or inferotemporal cortex (ITC) interrupted loops of reverberating activity between them, a likely mechanism of the continued facilitation (Fuster 2001). Chafee and Goldman-Rakic (2000) found similar patterns of neuronal activity in PFC and parietal neurons in monkeys and demonstrated their interdependence via cortical cooling. These studies and others (Tomita et al. 1999) indicate that PFC-parietal and PFC-ITC regions share reciprocal projections and that these circuits are necessary for the transmission of receptive field properties and other dimensions of task-related activity when these areas are recruited to a common task. Our earliest memory study (Aine et al. 2003), designed to parallel the Delayed-Match-to-Sample (DMS) working memory studies conducted in monkeys, revealed strikingly similar results as those obtained in monkeys. Figure 2 (top row) shows similar time-courses for V1 in the monkey and humans. Walsh Stimuli (upper right) were used in both cases. The bottom row (left) shows an example from monkey area V4 when the monkey was attending a preferred stimulus versus attending a non-preferred stimulus. At the right, an effect of attention or working memory in humans also reveals elevated and sustained activity in several brain regions including the prefrontal region (Aine et al. 2003).
Fig. 2
Top row Monkey V1 responses are compared to time-courses localized to occipital cortex in a human participant. Sample stimuli (Walsh patterns) used in both studies are shown in the upper right panel. Bottom row Effects of attention are shown for monkey V4 and for human prefrontal cortex. Activity in both monkey and human participants was elevated and sustained. Compare solid lines (attended) with dashed lines (not attended). Each tracing in the human time-course represents an average of 250 responses. Adapted from (a) Richmond et al. (1990); (b) Reynolds and Desimone (1999); and (c) Aine et al. (2003)
Cortical Feedback Connections. Although little is known about the physical nature or development of feedback connections, many believe that feedback projections from prefrontal cortex play a major role in modifying responses in lower-order brain regions during controlled or effortful processing, such as that required for attention and working memory tasks. Studies in nonhuman primates have revealed the existence of massive feedback projections that carry information from higher-order to lower-order regions. Although feedback connections can theoretically modulate early portions of the initial visual response (Hupe et al. 2001), most studies show that attentional modulations lag the earliest response (~250–300 ms in monkeys) (Haenny and Schiller 1988; Lamme et al. 1998; Mehta et al. 2000a; Motter 1994; Roelfsema et al. 1998; Seidemann and Newsome 1999). The late sustained activity allows information from feedback connections to be incorporated into the response to increase and sharpen the neural responses (Gilbert et al. 2001; Lamme and Roelfsema 2000). Our early attention studies using MEG were the first to suggest that attention can modulate V1 of humans via feedback from higher-order areas (Aine et al. 1995). These conclusions were based on the observations that: (1) attention-related effects in area V1 occurred later in time (~150 ms) than the earliest V1 activity and (2) this later attention-related activity showed a ~180º difference in net direction of current flow relative to the initial feedforward response around 80 ms. Previously, when ERPs were utilized to examine visual selective attention, concepts of “early in time” were often confused with “early levels of the visual system” suggesting that if attention had its effect early in time, then it must have occurred at the level of V1 or V2 and that if the attention-related effect occurred later in time, then it must have occurred at a higher level within the visual system (e.g., extrastriate regions). More recently, the attention effect in V1 was examined using both ERPs and fMRI (Di Russo et al. 2003; Martinez et al. 1999; Noesselt et al. 2002) and these studies supported the conclusions reached in Aine et al. (1995), as well as providing more definitive evidence. Additionally, fMRI studies (Brefczynski and DeYoe 1999; Tootell et al. 1998a) routinely show that attention can affect activity at the level of primary visual cortex and invasive studies show that it is via feedback influence which occurs later in time (Lamme and Roelfsema 2000; Mehta et al. 2000a, b). In general, MEG provides a unique tool for characterizing the spatio-temporal dynamics of neuronal activity that can even be used in certain circumstances (e.g., imagery) to differentiate feedforward activation sequences from feedback activity (Aine et al. 2003). Feedback connections are crucial for the establishment of neural circuits.
Feature Integration. How features and attributes of stimuli become integrated across widespread cortical regions has been an issue of intense interest and debate. Evidence indicates that (1) local field potentials (LFPs), which provide a measure of mainly postsynaptic dendritic responses, show strong sub-threshold synchrony of ongoing fluctuations in the cell’s membrane potentials (Lampl et al. 1999) and (2) coordinated sub-threshold excitability changes have been demonstrated to modulate local networks (Engel et al. 2001). From this perspective, induced oscillations are part of different cell assemblies that are activated to temporally bind different stimulus characteristics or to bind the activation of a system of distributed areas necessary for the task at hand. While the specific roles these rhythmic activities play are still debated (i.e., is it an epiphenomenon?), the existence of oscillatory activity is not (Salinas and Sejnowski 2001; Tallon-Baudry et al. 2004). But, as Tallon-Baudry et al. (2004) suggest, it is important to establish the behavioral relevance of oscillatory activity by showing that it is associated with behavior such as correct performance. Along these lines, Jensen and Tesche (2002) presented a list of digits similar to the original Sternberg design and found that MEG theta band activity over frontal regions increased parametrically with the number of items retained in working memory and there was stronger theta during the memory task compared to a control task. There was also a systematic increase in RT with increase in memory load. EEG and fMRI studies also suggest that an increase in frontal theta, associated with an increase in memory load, corresponds to a decrease in BOLD in DMN regions (Scheeringa et al. 2009). These studies suggest a functional role for oscillatory activity, but the conditions under which gamma, theta, beta or alpha activity is involved as well as their specific roles is still unclear. For example, does synchronization in theta band reflect episodic memory encoding (Klimesch 1999) or does it play a role in holding a stimulus in mind over the course of a brief delay (Lee et al. 2005)? MEG methods are uniquely suited for this exciting area of study.
As mentioned above, memories are formed through associations; brain regions or neural systems that are repeatedly active at the same time will tend to become associated (i.e., the principle of synchronous convergence) (Aertsen et al. 1989; Fuster 1997). Some investigators refer to the correlated activity across cortical areas as functional connectivity (Friston 1994) and others refer to it as temporal binding (Engel et al. 1992; Gray 1999; Roelfsema et al. 1997; Singer and Gray 1995). The former emphasizes the observed temporal correlation between two neurophysiological measurements from different parts of the brain (Gerstein and Perkel 1969) and the latter denotes the linking together of different features and attributes of stimuli through the selective synchronization of distributed neuronal activities (Bressler 1995; Gray 1999; Milner 1974; Singer and Gray 1995). Attention has been shown to enhance synchronization across different areas of cat brain (visual, parietal and motor cortex); with close to zero time lag (Roelfsema et al. 1997). While most studies in humans examine connectivity via coherence analysis using sensor measurements (sensor space), we have used our localized time-courses (source space) for cross-correlational analyses. Figure 3 shows a cross-correlation analysis (50–480 ms) conducted on the DMS data for three brain regions (medial occipital, medial temporal lobe or MTL, and PFC) and 4 participants. Similar to the Roelfsema study, attention or task relevance increases synchronicity across distributed cortical regions in healthy human participants (Aine et al. 2003). Activity in MTL and PFC regions covaried with each other (e.g., compare time-courses for one participant at left for MTL and PFC and cross-correlation plots for 4 participants at the right—green tracings). The maximum peak of the PFC and MTL correlation is near the zero lag while the maximum peak of the PFC and occipital correlation (shown in blue in the plots at the right) is not near zero. Lags and cross-correlation coefficients can be compared with behavioral performance measures to determine the relatedness of these brain regions. For a more thorough review of the functional organization of the visual system and of visual MEG studies in general, please refer to Aine and Stephen (2002).
Fig. 3
Cross-correlation plots for three cortical regions. Post hoc comparisons revealed that the maximum cross-correlation value for medial temporal and prefrontal time-courses were significantly greater than the other two comparisons [occipital and medial temporal time-courses (p < 0.05) and the occipital and prefrontal time-courses (p < 0.01)]
2 Basic Differences Between ERPs and ERFs
Although some ERP manuals readily provide normative values for amplitudes and peak latencies of ERP waveforms, similar tables will not be created here since: (1) the shape of MEG waveforms change dramatically across small cortical distances and (2) net amplitudes depend critically upon the net orientation of the sources of activity. Newcomers to MEG from the ERP field will notice immediately that averaged event-related fields (ERFs) do not look the same across subjects even though the same stimuli were presented to evoke them (Fig. 4). Investigators using ERPs know that whole-head ERP topography maps appear quite similar across participants and consequently, averaging data across subjects was used as an easy data-reduction approach. However, as Fig. 5 shows, MEG is extremely sensitive to the primary source of neuronal activity, in particular the orientation of sources, which is why it is not justified to average ERFs across subjects. In Fig. 5, the averaged ERFs, superimposed across 122 sensors for 2 subjects, appear different. However, once sources are localized to occipital cortex and other brain areas, then time-courses and locations can appear remarkably similar across participants, as in this example (see Fig. 5b and c, respectively). Consequently, our data reduction strategy has been, in some studies, to localize the sources of activity first, and then average time-courses from similar brain regions across participants.
Fig. 4
A grating stimulus presented to the same position in the visual field for 2 subjects reveals radically different field distributions for this small region at the back of the head. Aine et al. (1995)
Fig. 5
a MEG waveforms are shown for 2 subjects. b Time-courses localized to left medial occipital cortex are shown. c Locations of active sources for 2 participants. Time-courses were taken at source locations marked with blue asterisks
Because MEG signal strength is sensitive to net dipole orientation, signals may appear to have reduced amplitudes for some subjects relative to others which do not necessarily indicate pathology. Figure 6 shows an example where the source moment is the same for three subjects in our realistic simulated data but the resultant waveform amplitudes are not (Stephen et al. 2003). Two spikes (upper right plot) separated by 10 ms were generated in left and right premotor cortices (shown in yellow on the MRI at the left) and embedded in real spontaneous activity from each participant. Considerable differences in signal-to-noise ratio (SNR) can be seen across patients as a result of: (1) cancellation of signals across gyri and sulci and (2) the net orientation of the active patch (radial vs. tangential). The background activity in each case is fairly similar in this example. It was the differences in the cortical geometry of the sources that contributed to these overall differences in SNR.
Fig. 6
Realistic simulated data for 3 study participants using the same source moment (135 nAm) for left and right premotor sources (1 cm2 patches on the MRI). The first and second sources were separated by 10 ms as shown in the upper right plot. Adapted from Stephen et al. (2003)
Figure 7a shows how cortical geometry differences can exist across participants even for a prominent fissure in cortex such as the calcarine fissure. Sample MRIs for two participants show how the fissures differ (i.e., follow the fissure from the black arrows starting at the occipital pole up to the parieto-occipital sulcus). In this example, the MRIs were placed into Talairach space, a space used for roughly equating brain regions across subjects. However, there is about a 2 cm difference, between subjects, in terms of where the calcarine fissure meets the occipital pole (black arrows). The MRI at right shows that even within a single participant, MEG waveforms and contour plots may appear radically different across hemispheres given the asymmetry of some calcarine fissures. In general, the pattern of summation and cancellation may differ across hemispheres and participants.
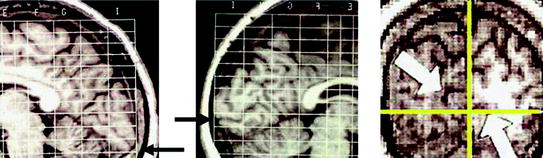
Fig. 7
MRIs from 2 subjects show Talairach bounding boxes to reveal differences in calcarine fissures. The black arrows show where the calcarine fissures meet at the occipital pole. The right panel shows that even within a single subject, calcarine fissures can be very asymmetric across hemispheres (see white arrows)
Do ERP methods share similar problems with ERFs regarding amplitude measures? Both EEG and MEG are source orientation dependent (i.e., scalar product and vector product, respectively of two vector quantities). It holds only for a spherical volume conductor assumption that EEG “sees” only radial sources and MEG “sees” only tangential sources. In realistic head volumes the two techniques have preferential but not exclusive sensitivity to radial and tangential sources, respectively. However, because MEG primarily measures intracellular current flow rather than return currents, significant differences in field patterns across sensor locations from subject to subject is usually evident due to the variable orientations of the sources contributing to the field patterns. EEG, reflecting primarily volume currents, tends to show a more similar pattern of activity across subjects, regardless of differences in functional neuroanatomy across subjects.
In general, EEG and MEG are both sensitive to differences in cortical geometry across subjects and cancellation/summation of potentials/fields within active cortical patches. EEG and MEG are also both sensitive to the stimulating parameters used to evoke responses. Camisa and Bodis-Wollner (1982) report, for example, that using a horizontal grating instead of a vertical grating or by changing the luminance of the stimulus changed the number of subjects classified as being normal using ERPs. As a general strategy, when one wishes to compare amplitude measures across subjects one could make within-subject comparisons across different experimental conditions first (e.g., attend versus not attend or passive versus active tasks). In this way, within-subject comparisons act as a control for individual absolute amplitude measures since one is comparing relative effect sizes across subjects (e.g., the effect of attention). As a final note, normative ERP measures for one laboratory are typically not used by other laboratories since ERP amplitudes (and ERF amplitudes) are dependent upon the stimulus parameters and equipment used to evoke them. When one adds the variability of cortical geometry normally witnessed across individuals to the above, it becomes very difficult to defend the use of absolute ERP/ERF peak amplitudes as a clinical diagnostic measure.
ERP Peaks. Early ERP studies labeled peaks in the evoked responses either as components 1, 2, and 3 (CI, CII, CIII) or as peaks denoted by polarity (negative versus positive) and latency (N70, P100, N200, P200, P300), depending on the type of stimulation (e.g., pattern reversal, pattern onset, flash stimulation) and the country in which in the studies were conducted (e.g., UK vs. USA). Considerable effort was expended on attempts at localizing the source of each individual peak either qualitatively (Jeffreys and Axford 1972a, b; Michael and Halliday 1971) or quantitatively via source localization procedures [e.g. Butler et al. (1987), Darcey et al. (1980), Maier et al. (1987), Ossenblok and Spekreijse (1991)], but it eventually became clear that single peaks/components in the waveforms (e.g., P100) do not necessarily reflect activity from a single cortical area. Each peak can reflect activity from a number of different sources.
ERF Peaks and Origins. The neural origin of the P100 visual response, which was so elusive in the ERP studies, became a focus of several early MEG studies. Seki et al. (1996) used a single-dipole model to account for activity occurring within a 90–135 ms time window to pattern reversals of full-field, half-field, and quadrant-field stimulation. In each of these cases, the MEG correlate of P100 localized to the bottom of the calcarine fissure. However, source locations were often variable in these early studies since peaks were analyzed using single-dipole models even though many investigators were aware that multiple generators contribute to the peaks in the MEG waveforms even as early as 130 ms (Ahlfors et al. 1992; Aine et al. 1995). Most MEG studies focused on localizing the sources of different components of the visual ERPs and showed various localizations around the calcarine fissure for the 1st through 3rd components (Harding et al. 1994, 1991; Hashimoto et al. 1999; Seki et al. 1996; Shigeto et al. 1998).
In Supek et al. (1999) we set out to determine if we could find evidence for retinotopic organization of extrastriate areas in humans, as documented by invasive monkey studies, and to examine the linearity of the evoked magnetic fields. In the latter case, it was assumed that responses to paired stimuli should equal the sum of responses evoked by single stimulus presentations, at least for retinotopically organized visual areas. Two-dimensional, difference of Gaussians (DOGs), as shown in the top portion of Fig. 8a, was used to test this hypothesis. In general, the paired presentation of stimuli reflected superposition of the responses evoked by single stimuli but only for early activity up to 150 ms poststimulus; undersummation was evident later in time. This study also nicely demonstrated the retinotopic organization of 3 brain regions, using multidipole modeling, the first MEG study to do so (Fig. 8b). Later we moved away from using DOG stimuli in order to evoke additional visual areas simultaneously using circular sinusoids (e.g., bulls-eye targets); higher-order areas such as area V4 prefer stimuli that contain higher spatial frequency content. In addition, the circular sinusoids allowed us to examine spatial frequency without having to use large stimulus sizes (e.g., grating stimuli); i.e., in order to examine spatial frequency, stimuli should contain at least 2 cycles.
Fig. 8
a DOG stimuli were presented individually to 3 locations in the lower right field as well as in pairs to examine both retinotopy of extrastriate regions and superposition of evoked fields. Fixation point is shown as a white “+”. The lower portion reveals 2 sensor locations showing the averaged evoked fields to the 2.5° and 12.5° stimuli, when presented individually, and when the two were presented as pair. Every subject revealed sensor locations where the response to the paired stimuli were nulled (sensor 2) and showed the opposite relationship between stimulus conditions (sensor 5). b Two subjects reveal 3 regions of activation in response to DOG stimuli when a multidipole model was used and each region showed a systematic shift in brain location as a function of location in the visual field (i.e., retinotopy). Adapted from Supek et al. (1999)
The results of Stephen et al. (2002) helped confirm that the human visual system is as complicated as the monkey visual system by identifying many of the homologous visual areas including, V1, V2/V3, V4, putative MT, intraparietal sulcus (IPS), medial parietal cortex and frontal eye fields, using circular sinusoids. The timing and onset of the different visual areas are consistent with previous monkey results suggesting that cortical areas in the dorsal visual stream are activated more quickly than cortical areas along the ventral visual stream. The results also suggested that stimuli with characteristics that are preferred by the dorsal or ventral visual stream still activate both dorsal and ventral visual areas with the largest difference appearing to be timing associated with that activation. This study is discussed more completely under “Retinotopy.”
More recently, Aine et al. (2003) characterized temporal response profiles from several cortical areas during a working memory task. Response profiles from primary visual cortex revealed initial “spike-like” activity followed by “slow-wave” activity. Similar to findings by Hashimoto and colleagues (Hashimoto et al. 1999), the “spike-like” activity appeared to have different physiological properties than the “slow-wave” activity even though both of these activities were generated from the same cortical region; it was hypothesized that the former predominantly reflects afferent or feedforward activity and the latter reflects a mixture of afferent and efferent activity. As suggested in recent monkey studies, the late sustained activity does indeed allow information from feedback connections to be incorporated into the response to increase and sharpen the neural responses (Gilbert et al. 2001; Lamme and Roelfsema 2000). Effects of attention are also typically found later when feedback into lower cortical regions is evident. The overall shape of the visual time-courses in the working memory task was quite different than the time-courses identified in Stephen et al. (2002), when there was no task associated with the visual stimuli. The simple sensory responses tend to have more peaks with an overall shorter duration response than visual responses evoked by a memory task suggesting again that the visual system is inherently involved in memory tasks.
ERF Norms. Armstrong et al. (1991) attempted to establish norms for MEG responses to visual stimuli similar to what had been done with ERPs, using a 2nd-order gradiometer in an unshielded environment. They studied 100 subjects aged 18–87 years and found that pattern reversal stimuli evoked a major positive component between 90 and 120 ms while flash stimulation produced a major positive component between 90 and 140 ms. They noted that the latencies were considerably more variable in MEG than in EEG. This may be due to the fact that MEG primarily measures intracellular current flow rather than the return currents, which can cause significant differences from subject to subject in the field patterns at each sensor location, due to the variable orientations of the sources contributing to these components. Alternatively, some investigators suggest that MEG sees fewer sources than EEG. If several sources contribute to a given component and MEG does not see all of them, then it is possible that the overall latency would be more variable for MEG than EEG. In addition to the possible contributors to variability mentioned above, ERP signals are generally more distributed across the head, due to the conductivity properties of the skull and scalp, whereas MEG responses tend to be more focal. Therefore, every source is more likely to be seen in more of the sensors using ERPs leading to less variability to timing in the overall waveforms. However, every source will not contribute to every sensor in MEG. If the multiple sources are not accounted for when modeling the MEG data, then there will be more variability in reported onset times, overall. In addition to the fact that some sources may have a larger or smaller contribution to the waveform due to differences in cortical geometry, this will also lead to variability in the timing for MEG. These factors can be better accounted for using a proper source model to differentiate the timing of individual sources.
3 Experimental Design Parameters
Stimulus Location–Retinotopy. Figure 9 reveals a portion of the classical model of V1 retinotopic organization. V1 in monkeys contain a point-to-point representation of the entire contralateral visual hemifield (Felleman and Van Essen 1991; Van Essen 1979). This is true for humans as well, as shown initially from lesion studies (Holmes 1945; Horton and Hoyt 1991; Spector et al. 1981


Related posts:


Stay updated, free articles. Join our Telegram channel
Full access? Get Clinical Tree
