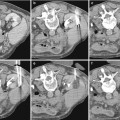
Fig. 1
The schemes represent the different possible acoustic views for the US examination of the kidney. (a, b) Anterior acoustic window at the level of the anterior axillary line: longitudinal (a) and transverse scanning plane (b). (c, d) Lateral acoustic window between the anterior and posterior axillary line: longitudinal (c) and transverse scanning plane (d). (e, f) Lateral acoustic window on the posterior axillary line: longitudinal (e) and transverse scanning plane (f). (g, h) Posterior acoustic windows behind the posterior axillary line: longitudinal (g) and transverse scanning plane (h). The anterior axillary line is defined as the vertical line extending inferiorly from the anterior axillary fold; the posterior axillary line is defined as the vertical line extending inferiorly from the posterior axillary fold, while the midaxillary line refers to a vertical line intersecting a point midway between the anterior and posterior axillary folds
Fig. 2
The different appearance of the kidney scanned through the different acoustic views. The resulting ultrasound (US) image is represented in grayscale level. (a–c) Longitudinal scanning planes of the kidney obtained through different directions of the acoustic beam according to anterior acoustic view (a), lateral acoustic window between the anterior and posterior axillary line (b), and lateral acoustic window on the posterior axillary line (c). (d) Transverse scan of the kidney. The resulting US image is represented in grayscale level
When the kidney is scanned on the longitudinal plane, the operator should remember that the kidney has an ovoidal shape and that both the renal poles should also be contemporarily visualized (Fig. 3) by using breath hold or patient lying on one side (Fig. 4). The normal longitudinal diameter of the kidney is between 9 and 12 cm. Normally, renal margins are smooth, except in some normal anatomical variants such as functional parenchymal defects and renal persistent fetal lobations. The mean normal value of renal cortical thickness (distance between the renal capsule and the outer margin of the pyramid) is 1–1.5 cm, while the normal value of renal parenchyma thickness (distance between the renal capsule and the margin of the sinus echo avoiding renal columns) is 1.4–2.2 cm. A renal parenchyma thickness <1 cm is associated with irreversible changes. The renal cortical echogenicity is normally lower than the echogenicity of the liver, spleen, and renal sinus. When the liver parenchyma appears hyperechoic on US, spleen echogenicity is used as a standard reference; however, kidneys may be isoechoic to the liver even when no clinical or laboratory evidence of renal disease are documented. The renal cortical echogenicity is correlated to the severity of histological changes in renal parenchymal diseases such as glomerual sclerosis, focal tubular atrophy, and hyaline casts per glomerulus. On US, the renal pyramids appear triangular and hypoechoic and may be differentiated from the renal cortex in approximately 50 % of adult patients, being more conspicuous with hydration and diuresis. The renal sinus appears hyperechoic when compared with renal parenchyma, for the presence of hilar adipose tissue with fibrous septa, blood vessels, and lymphatics. The renal sinus may appear inhomogeneous, less echogenic, and poorly differentiated from renal parenchyma when edema, fibrosis, or cellular infiltration is present. With increasing age, the amount of renal parenchyma decreases and the renal sinus fat increases. The renal sinus fat tissue may be increased also in renal sinus lipomatosis which can be determined by obesity, parenchymal atrophy, and normal variants. Tissue harmonic and compound imaging (Fig. 5) allows a better definition of the kidney profiles, the better identification of renal calculi and parenchymal calcifications, the better depiction of the intracystic septa in the complex cystic renal masses, the better characterization of the content in the dilated excretory tract, and the more accurate evaluation of the parenchyma echotexture.
Fig. 3
Grayscale US. Longitudinal scan. Optimal scanning technique to identify the upper renal pole (arrow). (a) An irregular US scan does not allow a correct insonation of the upper renal pole. (b) A regular US scan allows the correct insonation of the upper renal pole
Fig. 4
Grayscale US. Longitudinal scan. Optimal scanning technique to identify the lower renal pole (arrow). (a) An irregular US scan does not allow a correct insonation of the lower renal pole due to the interposing bowel gas. (b) A regular US scan, obtained with the patient lying on one side, allows the correct insonation of the lower renal pole
Fig. 5
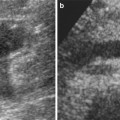
Compound imaging in the depiction of the renal margins. (a) In spatial compound imaging, the same insonated slice is interrogated according to different insonation angles. The resulting images are managed by subtracting all echoes step-by-step which appears incoherently in the different acquired images, corresponding essentially to noise. (b) Conventional grayscale US. (c) Tissue harmonic imaging and compound imaging allow speckle reduction with better depiction of the renal echotexture and profiles
Only dilated ureters may be identified by grayscale US, even though the presence of interposing bowel gas often masks the dilated ureter. The employment of the posterior acoustic view through the ipsilateral psoas muscle is fundamental in the assessment of the dilated ureter.
2.1.2 Fundamental Alterations of Renal Echogenicity
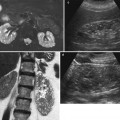
The alterations in the echogenicity on grayscale US are always compared to the surrounding tissues and may involve the renal parenchyma or the renal sinus. Diffuse renal parenchyma diseases, including acute glomerulonephritis (Fig. 6a), vasculitides, and acute tubular necrosis, determine the increased echogenicity of the renal cortex with an increased corticomedullary differentiation. Autosomal recessive polycystic kidney disease manifests with enlarged and hyperechoic kidneys (Fig. 6b) due to the unresolved 1–2 mm cystic dilatation of the collecting tubules that increases the number of acoustic interfaces.
Fig. 6
Grayscale US. Longitudinal scan. (a) Increased renal cortical echogenicity and corticomedullary differentiation in a patient with acute glomerulonephritis. (b) Autosomal recessive polycystic kidney disease manifesting with enlarged and hyperechoic kidney (arrows) due to the unresolved small cystic dilatation of the collecting tubules that increases the number of acoustic interfaces. Calipers indicate a renal cyst
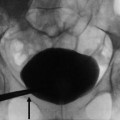
Calcium determines the focal or diffuse hyperechogenicity often with posterior acoustic shadowing. Focal parenchymal calcifications are due to Randall’s plaque characterized by comet-tail artifact (Fig. 7a), a reverberation type of artifact (Thickman et al. 1983) consisting of dense tapering trail of echoes just distal to a strongly reflecting structure, or papillary calcifications (Fig. 7b) in the medullary sponge kidney. Randall’s plaques correspond to the focal deposition of interstitial crystal at or near the papilla tip (Randall 1937) prevalently composed of apatite or calcium oxalate which may have a potential pathogenetic role as a precursor for calcium oxalate nephrolithiasis (Sakhaee 2009). Focal papillary calcifications appear as focal hyperechoic spots within or at the tip of renal papillae, and they can be observed in sarcoidosis, primary hyperparathyroidism, diabetes mellitus, medullary sponge kidney, drug nephropathy, and long dialysis treatment. Medullary hyperechogenicity (Fig. 7c) is due to medullary nephrocalcinosis which is characterized by diffuse calcium deposition within the renal medulla. Underlying causes include medullary sponge kidney, distal renal tubular acidosis, hyperparathyroidism, milk-alkali syndrome, hypervitaminosis D, chronic pyelonephritis, chronic glomerulonephritis, sarcoidosis, glycogen storage disease, Wilson’s disease, sickle-cell anemia, infections of the renal medulla, and in hyperuricemic (gout, Lesch–Nyhan syndrome) or hypokalemic conditions (primary hyperaldosteronism, long-term furosemide therapy, and Bartter’s syndrome due to an inherited defect in the thick ascending limb of the loop of Henle) (Kim and Kim 1990). Frequently, hyperechogenicity is determined by renal stones which present a posterior acoustic shadowing if larger than 3 mm (Fig. 7d). The calcifications in the cyst wall (Fig. 7e) may determine a diffuse posterior acoustic shadowing with the impossibility to visualize the cystic content (Fig. 7f).
Fig. 7
Hyperechogenicity. (a) Grayscale US. Longitudinal scan. Randall’s plaque (arrow) with comet-tail artifact. (b) Longitudinal scan. Focal papillary calcifications (arrows) in a medullary sponge kidney. (c) Diffuse hyperechogenicity of the renal medulla (arrows) due to medullary nephrocalcinosis in a patient with medullary sponge kidney. (d) Transverse scan. Hyperechogenicity with posterior acoustic shadowing (small arrows) due to a renal stone (large arrow). (e) Longitudinal scan. Hyperechogenicity due to diffuse wall calcifications (arrow) in a renal cyst. (f) Longitudinal scan. The calcifications of a cystic wall (arrow) do not allow the assessment of the cystic content due to diffuse acoustic shadowing
2.1.3 Solid and Cystic Renal Tumors
US is considered the first choice imaging modality when a renal mass is suspected. Due to the high diagnostic quality of today’s state-of-the-art US equipment, a constantly increasing number of both benign and malign focal renal lesions are detected. Baseline grayscale US presents a low accuracy in the characterization of renal masses, especially if smaller than 3 cm in diameter, since benign and malignant tumors frequently present similar appearance (Correas et al. 1999). Also benign and malignant renal masses >4 cm may present similar appearance, and large renal cell carcinomas prevalently reveal heterogeneous appearance due to intratumoral necrosis, calcifications, and hemorrhage similar to large angiomyolipomas which may reveal heterogeneous appearance due to solid, adipose, and hemorrhagic components. In daily routine work, the most useful one may be the widely accepted approach to do an initial differentiation between solid and cystic lesions by grayscale US. In case malignancy is suspected based on the US appearance, further diagnostic workup with CT or MRI is recommended. The reverse sequence of imaging studies, that is, an equivocal lesion diagnosed on CT or MRI, is referred for further evaluation by US, or contrast-enhanced US (CEUS) may occur in an institution where high level US expertise is available or if percutaneous ablation is considered.
Solid renal tumors. Solid renal tumors may present all the possible degrees of echogenicity. The most typical pattern is the homogeneous hyperechogenicity of renal angiomyolipoma (Fig. 8) which presents a homogeneously bright appearance and a wedge-shaped connection with the renal parenchyma resulting in a parenchyma defect, also with evidence of posterior acoustic shadowing (Yamashita et al. 1992; Helenon et al. 1997, 2001; Jinzaki et al. 1997). Atypical iso-/hypoechoic and slightly hyperechoic angiomyolipoma accounts, respectively, for 6 and 29 % (Helenon et al. 2001). Among small renal cell carcinomas (3 cm or less in diameter), 23–46 % of solid tumors are iso- or hypoechoic compared with normal renal parenchyma (Helenon et al. 2001). Approximately, 30 % of solid renal cell carcinomas smaller than 3 cm appear as hyperechoic masses (Forman et al. 1993). Tumors of papillary architecture are prevalently hyperechoic at US (Fig. 9a, b). There is no correlation of cell differentiation and cell architecture with echogenicity or tumor vascularity (Yamashita et al. 1992). The hyperechoic appearance, sometimes with evidence of an anechoic rim (Fig. 9c) or small intratumoral cysts (Fig. 9d), is frequently observed in renal cell carcinoma. Histologically, homogeneous tumors of solid architecture are usually isoechoic (Fig. 10) or hypoechoic at grayscale US (Fig. 11) (Yamashita et al. 1993; Siegel et al. 1996). Solid renal cell carcinomas larger than 3 cm appears prevalently heterogeneous at baseline US due to intratumoral necrosis, calcifications (Helenon et al. 2001), and hemorrhage. Some typical US patterns were described also for renal oncocytoma, as the presence of a central scar appearing as a stellate hypoechoic area and the absence of hemorrhage and necrosis (Helenon et al. 2001). Tissue harmonic imaging is useful in complicated solid renal masses to identify intratumoral necrosis or hemorrhagic perirenal collection from tumoral rupture (Fig. 12).
Fig. 8
Hyperechoic homogenous solid renal lesion (arrow). Large renal angiomyolipoma (arrow) with a prevalently extrinsic development appearing as a homogeneously bright renal mass with wedge-shaped connection with the renal parenchyma resulting in a parenchyma defect
Fig. 9
Different patterns of hyperechoic solid renal cell carcinoma. (a) Large papillary cell-type renal cell carcinoma. (b) Small papillary cell-type renal cell carcinoma. (c) Hyperechoic clear cell-type renal carcinoma with peripheral hypoechoic rim (arrows) and a central hypoechoic region corresponding to central necrosis (L liver, K kidney). (d) Hyperechoic clear cell-type renal carcinoma (arrows) with intratumoral hypoechoic cysts (small arrows)
Fig. 10
Solid renal lesion isoechoic to the adjacent renal parenchyma with bulging of the renal profile. Clear cell-type renal carcinoma (arrow)
Fig. 11
Hypoechoic solid renal lesion. Clear-cell type renal cell carcinoma (arrows) (calipers)
Fig. 12
Usefulness of tissue harmonic imaging in complicated solid renal masses. Rupture of a solid renal tumor with hemorrhagic perirenal collection. (a) Conventional grayscale US. A perirenal hypoechoic collection (arrow) is identified; (b) tissue harmonic imaging allows a better characterization of the perirenal collection (arrows) by depicting a corpuscular pattern typical of the hemorrhagic collection
Cystic renal tumors. Renal cysts are common incidental findings during the clinical diagnostic workup of patients (Helenon et al. 2001), and the simple renal cyst is the most common renal lesion encountered. Renal cysts frequently present an obvious simple cystic pattern at US and/or CT, and such cysts do not deserve any further imaging assessment or surgical procedure. In some cases, however, renal cysts show a complex pattern and vary in their malignant potential according to the number and thickness of intracystic septations and the presence of mural nodules and peripheral calcifications.
Well-established characteristics of a simple renal cyst include sharp borders and, particularly, sharply defined back wall, thin wall, anechoic contents, and strong posterior acoustic enhancement (Fig. 13a, b). The content of renal cysts typically appears more complex at US than at CT, owing to the greater accuracy of US in depicting thin intracystic septations and the corpuscular content due to hemorrhage or tumor debris. Varying degrees of cyst complexity are often shown at US, such as single or multiple septations (Fig. 13c–e), low-level echoes (due to hemorrhagic or proteinaceous debris – Fig. 13f), thick walls, calcifications, and mural nodularity (Fig. 13g). Renal cyst content may be easily characterized by using tissue harmonic imaging and compound imaging which allows speckle reduction and improved contrast-to-noise ratio with an increased diagnostic confidence in the differentiation between simple and complicated renal cysts (Figs. 14, 15, 16, 17, and 18).
Fig. 13
Different appearances of renal cysts on grayscale US. (a) Simple small renal cyst (arrow) with posterior acoustic enhancement; (b) large renal cyst (arrow) with diffuse posterior acoustic enhancement; (c) renal cyst with a single septation; (d) renal cyst with multiple septations (arrow); (e) complex renal cyst with multiple septations corresponding to a multilocular cystic nephroma; (f) hemorrhagic renal cyst (arrow) with hyperechoic content; (g) complex renal cyst with mural nodule (arrow) andechoic content
Fig. 14
Tissue harmonic imaging. Simple renal cyst with anechoic appearance (circle). (a) Conventional grayscale US. Doubtful content of the lesion. (b) Tissue harmonic imaging allowing a better characterization of the anechoic liquid content of the renal cyst with evidence of posterior acoustic enhancement
Fig. 15
Tissue harmonic imaging. Hemorrhagic renal cyst with hyperechoic corpuscular content. (a) Conventional grayscale US. The renal cyst reveals a corpuscular content. (b) Tissue harmonic imaging confirms the corpuscular content of the renal cyst
Fig. 16
Tissue harmonic imaging. Complex renal cyst with septations. (a) Conventional grayscale US reveals indistinct content of the cyst; (b) tissue harmonic imaging allows speckle reduction with a better depiction of the intracystic septations and a better characterization of the liquid content (arrow)
Fig. 17
Tissue harmonic imaging. Complex renal cyst with echoic content (arrow). (a) Conventional grayscale US reveals an indeterminate pattern; (b) tissue harmonic imaging allows speckle reduction with a better characterization of the liquid content (arrow) and a better depiction of the echoic content
Fig. 18
Tissue harmonic imaging and compound imaging. Complex renal cyst with peripheral wall thickening. (a) Hypoechoic renal mass (arrow) on the upper pole of the right kidney; (b) harmonic imaging reveals the cystic nature of the lesion with a peripheral wall thickening; (c) compound imaging combined to harmonic imaging confirms the cystic nature of the lesions with the addition of a better depiction of the lesion margins with respect to the adjacent renal parenchyma
The Bosniak (1986, 1991) classification categorizes the renal cysts according to their CT features: category I, simple benign fluid-containing cysts with the attenuation of water and thin walls without septa or calcification; category II, minimally complicated benign cysts with hairline-thin septa, fine calcifications in the walls or septa, or segmental slightly thickened calcifications, with or without minimal septal or mural enhancement (high-attenuation, sharply marginated, completely intrarenal, and not enhancing cystic masses ≤3 cm are also included in this category); category IIF (F indicates follow-up), more complex cystic lesions that cannot be classified as category II nor are complex enough to be characterized as category III since they may contain an increased number of septa and an increased amount of calcifications in the walls or septa, which may be thicker and nodular (high-attenuation, sharply marginated, completely intrarenal, and not enhancing cystic masses >3 cm are also included in this category); category III, indeterminate cystic masses whose benign or malignant nature cannot be determined with imaging studies, with thickened (>2 mm) irregular walls or septa, which may appear hyperdense on unenhanced CT and may contain either small or large amounts of calcification with septal and/or mural contrast enhancement; and category IV, cysts showing either small or large amounts of calcifications within a thickened, enhancing irregular wall or septum and presenting enhancing soft-tissue nodular components adjacent to or extending from the wall or septum.
2.2 Color and Power Doppler Ultrasound
2.2.1 Normal Anatomy
Beside the evaluation of both the kidneys by grayscale US (which should be extended to the bladder in every patient), color/power Doppler analysis of renal parenchyma vascularity should be performed in every patient to identify global or partial renal cortical perfusion defects. Color Doppler is a Doppler technique in which a color map displays the mean Doppler frequency shift of Doppler signal, giving information relative to the presence and direction of flows in renal vessels. Color Doppler presents some technical limitations, including US beam attenuation with depth, insonation angle dependence, and motion artifacts. The peripheral vasculature of the renal cortex distal to the arcuate level is abundant and is made of a dense series of small interlobular vessels (Martinoli et al. 1999). Nowadays, the US equipments allow the depiction of the renal parenchyma vessels up to arciform and interlobular arteries and veins and of the capsular vessels (Fig. 19a), while the renal medulla appears hypovascular at color Doppler. The depiction of the renal parenchymal vessels by color Doppler US is reduced with an insonation angle close to 90° (renal poles) and is dependent on the kidney depth and the frequency of the US transducer. Moreover, the depiction of the renal parenchyma flows is reduced in the elderly patient. To increase the visualization of the renal parenchyma vessels, it is important to employ a low wall filter, a low pulse repetition frequency, and an appropriate signal gain with the lowest level of the noise and clutter. The renal medulla is avascular at color/power Doppler analysis since those renal vessels present a slow-flow velocity.
Fig. 19
Color and power Doppler of the renal vasculature. (a) Color Doppler, (b, c) power Doppler, also with tissue background suppression by a colored mask (b), and (d) wide-band color Doppler allow an accurate depiction of the renal vessels up to the arcuate arteries
Power Doppler is a Doppler technique in which a color map displays the integrated amplitude of Doppler signal. Power Doppler is not dependent on insonating angle and is superior to color Doppler in delineating renal parenchymal blood flows, particularly at the renal poles and the superficial renal cortex (Fig. 19b). Power Doppler reveals a diffuse, homogeneous, low-amplitude color blush of the entire renal cortex generated from the sum of the numerous weak signals from interlobular vessels and their distal branches, and by high-frequency transducers power Doppler is able to solve color blush into the series of interlobular vessels also with the possibility of tissue background suppression by using colored masks (Fig. 19b). Failure of power Doppler to produce the cortical blush in normal native kidneys may occur either selectively in the far renal cortex due to the attenuation of the signal with depth or diffusely as a result of obesity or inability of the patient to breath hold adequately (Martinoli et al. 1999).
Occasionally, flow signals may be visible in the medullary regions. It is possible to obtain a 3D visualization of renal vessels by using matrix US transducers. Wideband color Doppler US (Fig. 19d), employing different color maps according to the US equipment, allows obtaining a better spatial resolution with an improved differentiation of the single vessels in the renal cortex.
The renal perforating vessels, traveling through the renal capsule, are recognizable using color Doppler, both in healthy subjects and in patients with renal failure (Bertolotto et al. 2000). Renal perforating arterial vessels (Fig. 20) are occasionally identified in normal individuals, while renal perforating venous vessels are frequently identified, especially in the young patient, and present a flow visible during diastole. Generally, the prevalence and flow characteristics of renal perforating vessels differ between healthy subjects, patients with mild and with severe chronic renal failure, and those with chronic renal failure complicated by acute renal insufficiency caused by renal artery stenosis (Bertolotto et al. 2000). The renal perforating arteries in healthy and hypertensive patients present various resistance indices and flow toward the capsule. Renal perforating arteries with a lower mean resistance index than the mean interlobar resistance index and flow toward the capsule are detected in the majority of kidneys in patients with mild chronic renal failure (Fig. 20) and in some patients with severe chronic renal failure. On the other hand, only a few perforating renal veins are visible in patients with chronic renal failure (Bertolotto et al. 2000). In kidneys with renal artery stenosis, detected in the patients with chronic renal failure complicated by acute renal insufficiency, some renal perforating arteries are detectable with flow toward the kidney and a mean resistance index higher than the mean interlobar resistance index (Bertolotto et al. 2000).
Fig. 20
Renal perforating arterial vessels. Color Doppler. Renal perforating arterial vessel (arrow) in a patient with chronic renal failure
2.2.2 Fundamental Alterations of Renal Parenchyma Vascularity
The renal parenchyma vascularity is reduced on color and power Doppler analysis in nephrosclerosis (Fig. 21) and in renal parenchyma diseases. The fundamental alterations of renal parenchyma visible at color and power Doppler US include perirenal hematoma (Fig. 22) and renal perfusion defects or infarctions (Fig. 23). The principal limitation of color Doppler US is the limited sensitivity in the detection of renal perfusion defects which is much improved by contrast-enhanced US (Robbin et al. 2003).
Fig. 21
Renal nephrosclerosis. Power Doppler US. (a) Normal distribution of renal vessels. (b) Reduced renal vessel density on renal parenchyma in a patient with nephrosclerosis
Fig. 22
Renal subcapsular hematoma. (a) Conventional US. A diffuse cortical thickening of the right kidney. (b) Color Doppler allows the identification of a subcapsular renal hematoma (arrow)
Fig. 23
Different appearances of renal vascular alterations. (a) Color Doppler US. Renal perfusion defect (arrow) in a 60-year-old male patient with lack of renal cortical vessels in the upper pole of the right kidney due to acute renal infarction. (b, c) Renal vascular scar due to previous renal infarction. Clear parenchymal scar (arrows) on grayscale US (b) which appears as a vascular defect on power Doppler (c)
One peculiar employment of color and power Doppler US is the renal stone detection and characterization through the color comet-tail artifact. The color comet-tail artifact (or twinkling sign) is a rapidly alternating color Doppler signal that occurs immediately deep in relation to the object causing it. It is typically observed behind a renal stone (Fig. 24). Because of the normal echogenic background of the renal sinus, small kidney stones are often difficult or impossible to detect or differentiate from small echogenic foci that are not caused by calcification (Tchelepi and Ralls 2009). The color comet-tail artifact is of value in identifying such stones. The artifact appears on images as a linear aliased band of color (Tchelepi and Ralls 2009) and depends both on the roughness of the surface of the object imaged (Rahmouni et al. 1996) and on machine settings, color gain, color-write priority, pulse repetition frequency, and grayscale gain (Kamaya et al. 2003). Sometimes, the artifact is enhanced by an increase in color gain and moving the transmit zones deep in relation to the object causing the artifact. Lower color Doppler frequency seems to produce a more prominent color comet-tail artifact than does a higher frequency (Tchelepi and Ralls 2009).
Fig. 24
Twinkling artifact due to renal stone. (a) Conventional US identifies a renal stone (arrow) with posterior acoustic shadowing. (b) Color Doppler allows a correct characterization of renal stone through the visualization of the twinkling artifact
2.2.3 Renal Tumors
Color and power Doppler US are usually employed for the characterization of renal solid masses. Each renal tumor must be preliminary scanned by baseline grayscale and color Doppler US, also with the employment of speckle-reducing technique such as tissue harmonic imaging and compound imaging (Claudon et al. 2002). Baseline color Doppler US is performed by using slow-flow settings (pulse repetition frequency 800–1,500 Hz, wall filter of 50 Hz, high levels of color vs. echo priority and color persistence). Color gain should be varied dynamically during the examination to enhance color signals and avoid excessive noise, with the size of the color box adjusted to include the entire lesion in the field of view. Spectral analysis of central and peripheral tumoral vessels is performed by pulsed Doppler to reveal continuous venous or pulsatile arterial flows. The intratumoral or penetrating vessel pattern is considered most frequent in angiomyolipomas (Fig. 25). The peripheral (Fig. 26) or mixed penetrating and peripheral tumoral vessel distribution (Fig. 27) may be observed in renal cell carcinomas (Jinzaki et al. 1998).
Fig. 25
Vessel distribution pattern at color Doppler. Renal angiomyolipoma. (a) Hyperechoic renal solid mass (arrow). (b) Penetrating vessel distribution at color Doppler
Fig. 26
Vessel distribution pattern at color Doppler. Renal cell carcinoma. (a) Hyperechoic renal solid mass (arrows). (b) Prevalently peripheral vessel distribution at color Doppler
Fig. 27
Vessel distribution pattern at color Doppler. Renal cell carcinoma. (a) Hyperechoic renal solid mass (arrows) with a hypoechoic peripheral rim. (b) Peripheral and intratumoral vessel distribution at color Doppler (blue color map)
2.2.4 Assessment of Renal Vessels
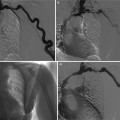
Color Doppler US is a fundamental technique in the screening of renal artery stenosis (Havey et al. 1985). For the evaluation of the main renal artery by Doppler US (Berland et al. 1990), the patient should follow a diet similar to that employed for intravenous urography during the 3 days before the examination to reduce the intestinal meteorism also with rectal enema on the day of examination. For color Doppler examination, coronal plane must be employed to visualize the flow in the main renal arteries with an insonation angle lower than 60° (Figs. 28 and 29). An insonation angle close to 0° allows obtaining a cosine value close to 1 which allows an accurate calculation of the frequency shift which is equal to 2vf i cos Ф/c, with v = blood velocity; f i = US frequency; cos Ф = cosine of the angle between the blood flow direction and the US beam direction; and c = US beam velocity in the medium. The velocitometric analysis of Doppler trace derived from renal (Fig. 30) and intrarenal arterial vessels is of primary importance (Fig. 31). The renal vein flow should also be analyzed by pulsed Doppler and reveals a typical biphasic pattern (Fig. 32).
Fig. 28
Insonation angle to image renal arteries by color Doppler. (a) Incorrect insonation angle between the US beam and the renal artery close to 90°. (b) Correct insonation angle between the US beam and the renal artery close to 0°
Fig. 29
Optimal visibility of renal arteries (arrows) at color Doppler US. (a) Conventional US. (b) Color Doppler. VCI inferior vena cava
Fig. 30
Color Doppler US with Doppler interrogation of the main renal artery. The normal Doppler trace of the main renal artery
Fig. 31
Color Doppler US with Doppler interrogation of the intrarenal segmentary renal artery. The normal Doppler trace of the renal segmental artery
Fig. 32
Normal renal veins on color Doppler. The renal vein is represented in blue color since the blood is moving away from the transducer (a). (b) Normal biphasic Doppler trace of the renal vein. RA renal artery, RV renal vein, k left kidney
The assessment of renal vascular resistances is obtained by Doppler waveform analysis obtaining the renal Resistive Index (RI) which corresponds to the peak systolic velocity minus the end-diastolic velocity divided by the peak systolic velocity. Increased sensitivity of color Doppler and power Doppler provided by the latest US equipments allows depiction and Doppler interrogation of the renal parenchymal vessels up to the interlobular arteries. The renal RI is considered a reflection of renal parenchymal resistance (Jensen et al. 1994; Bude and Rubin 1999; Tublin et al. 1999, 2003) and has been widely used to support diagnostic and therapeutic procedures. The glomerular circle presents a low influence in the RI value which is principally determined by the systemic cortical and medullary vascular circle in the kidney. The mean reference value for normal RI in adults was determined to be 0.60 ± 0.10, with 0.70 as the upper limit of normal (Platt et al. 1989, 1990; Kim et al. 1992; Keogan et al. 1996; Rivolta et al. 2000; Radermacher et al. 2002


Related posts:
Stay updated, free articles. Join our Telegram channel
Full access? Get Clinical Tree
